prior_bakeoff_20260930/runs/F1_lp7s_full and F2_lp7s_full, plus official K=5 fold fits. Their saved metadata confirms λ_local_poly = 3e8, window 7, λ_fine_nbr = 0, and reject_every = 0. The intended penalty is present; background preparation predates the new wing-mask recipe.figures/publication/section4_sources.json selects the input root, fields, arm, folds, and required penalty settings. New builders record its hash and check the recipe; replacing the dataset also requires compatible schemas and renewed source/figure checks.maskfoot_20261001/README.md, score_ksb.json, score_ksb.py) changed after their older exports. Preserve the old fingerprints; those background/mask snapshots require separate reconciliation, not silent hash updates.maskfoot_20261001/README.md, the timestamped 14:52–15:36 EDT dataset decisions, and paper-pin-diff background code. The operational linear-lane pin is a3d50a0; 846c1c3 failed its shape check and produced no accepted replacement.37dbfffb-6438-4ed7-aced-5f5832c05295, October 1 wing-radius discussion; executed estimator code and saved maskfoot_20261001 masks/scores supply the plotted evidence.FIGURE_PLAN.md gives F6/F7 different meanings and describes superseded background processing. Treat it as historical, not a second governing outline.| Proposed location | Purpose and figure | Assets / action |
|---|---|---|
| 1. Introduction | Question, contribution, testable endpoints | No results gallery; colour dependence itself is not the novelty. |
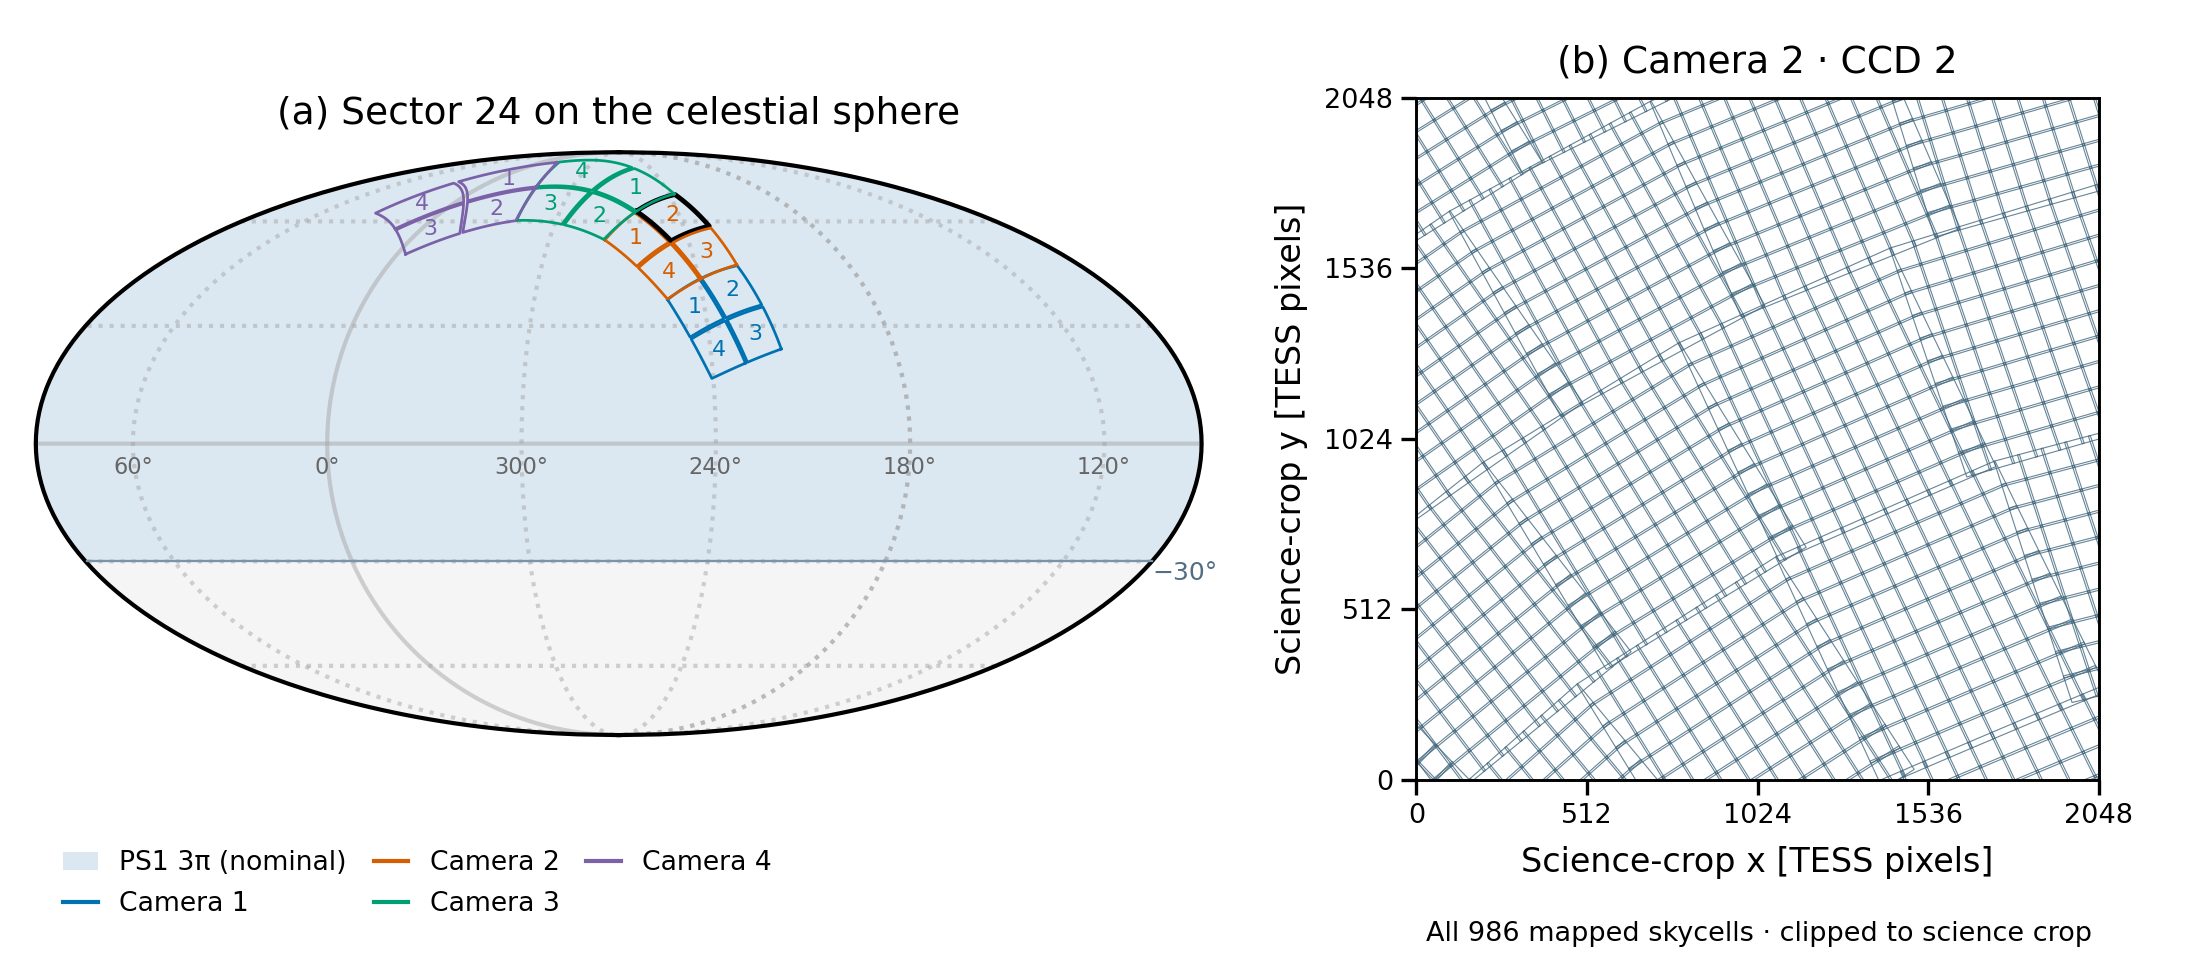
| 2. Data and evaluation | M1: coverage, star roles/folds, colour/magnitude coverage | F1 + new sample/fold panel. Table 1: five exposures, epochs and per-stage recipe pins. |
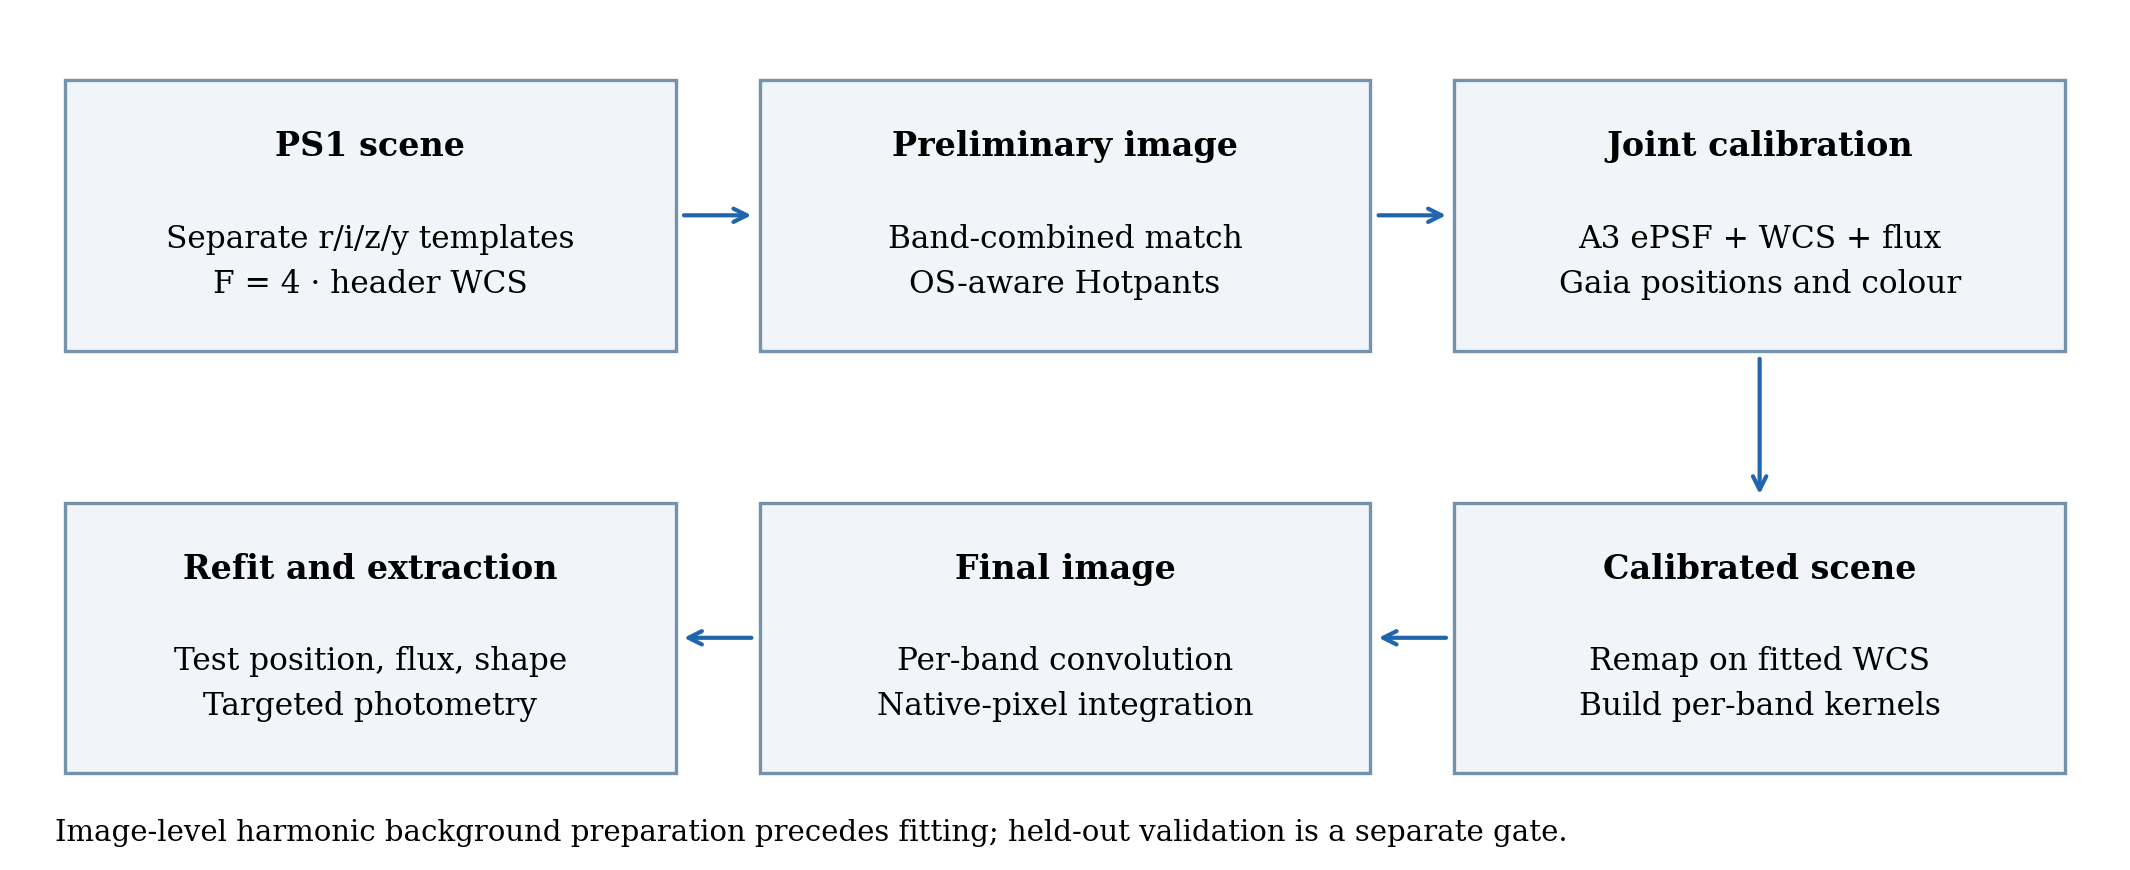
| 3.1 Method overview | M2: end-to-end flow | New F5; add explicit TESS input and separate held-out scoring branch. |
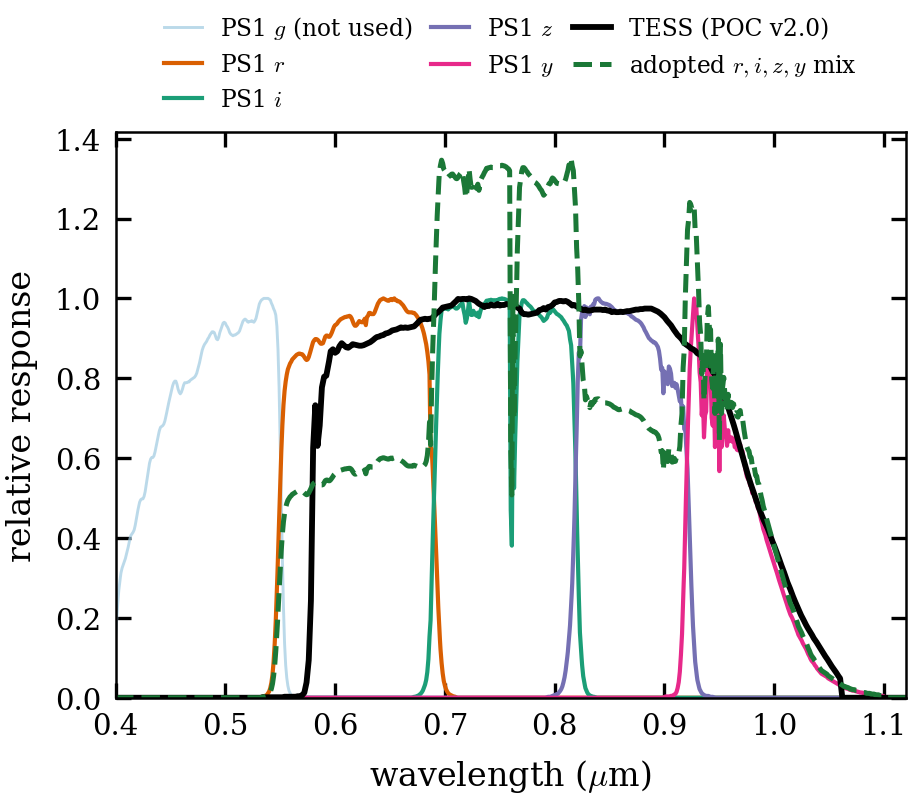
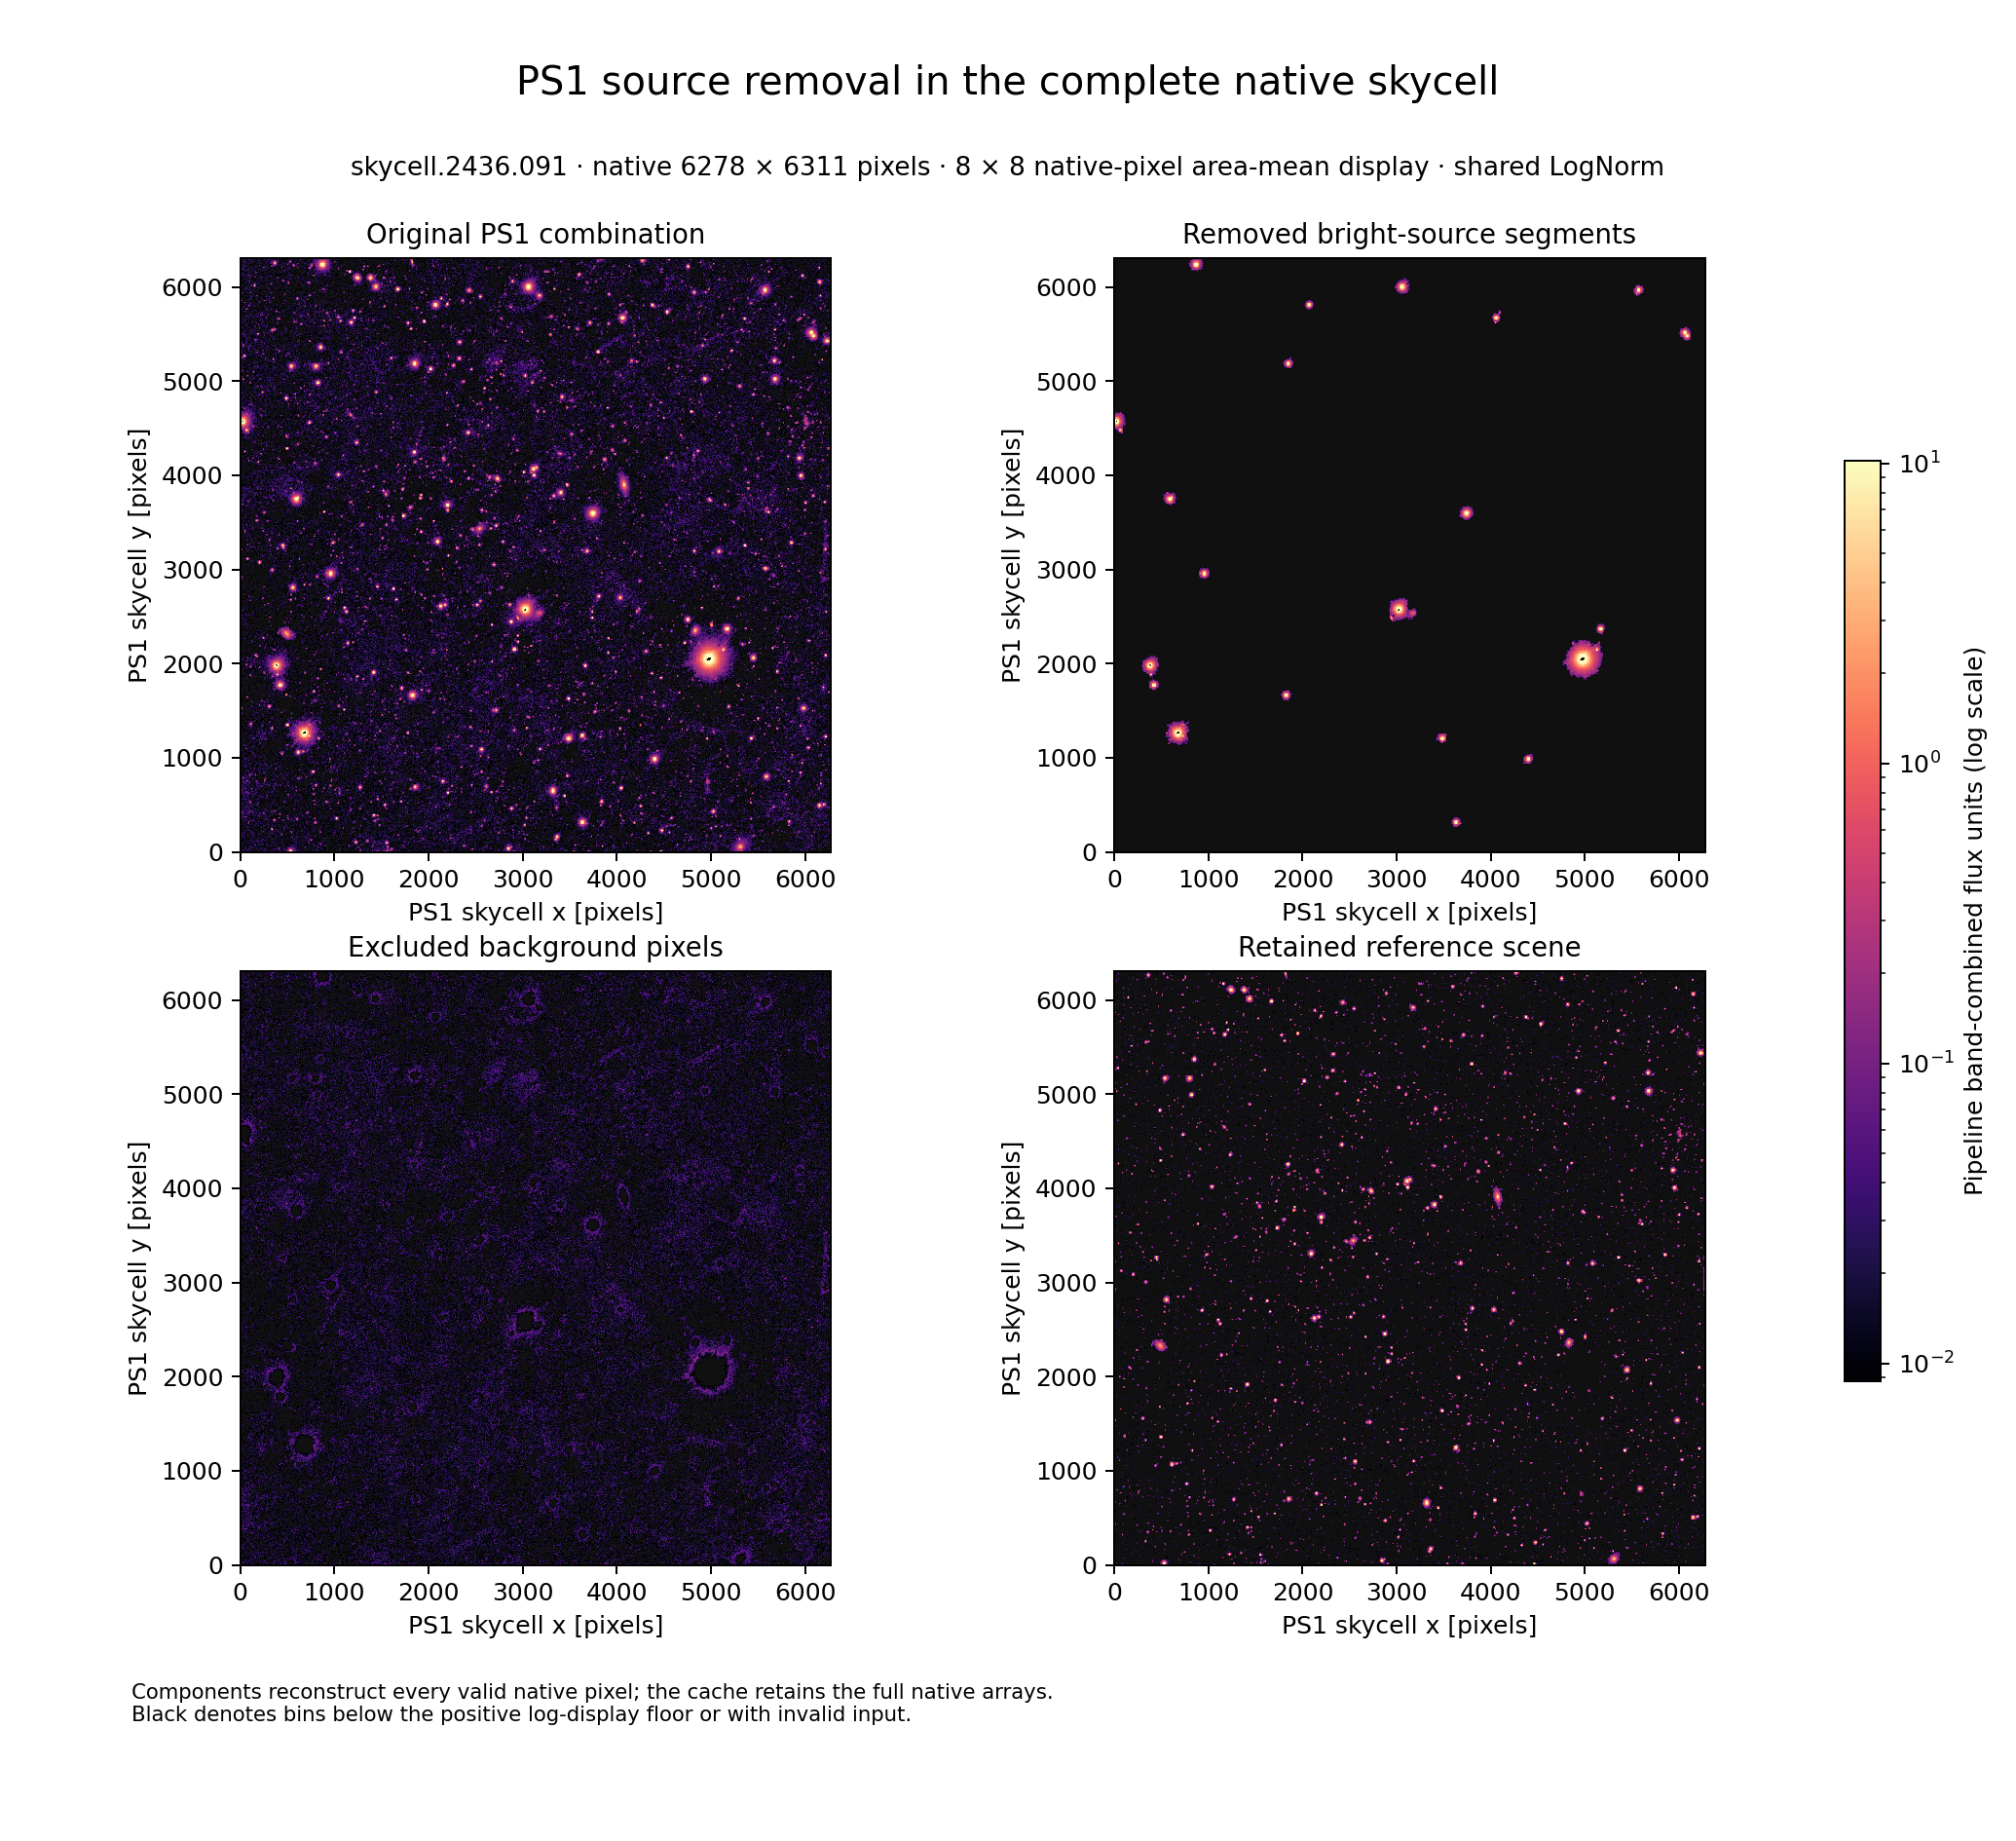
| 3.2 Reference scene | M3: resolved scene, removed segments, retained neighbours | F3 + common-coordinate segmentation zoom; F2 bandpasses and full decomposition in appendices. |
| 3.3 Preliminary image | Bootstrap and image-level background | Compact text; final harmonic F6 and blank-region validation in Appendix A. |
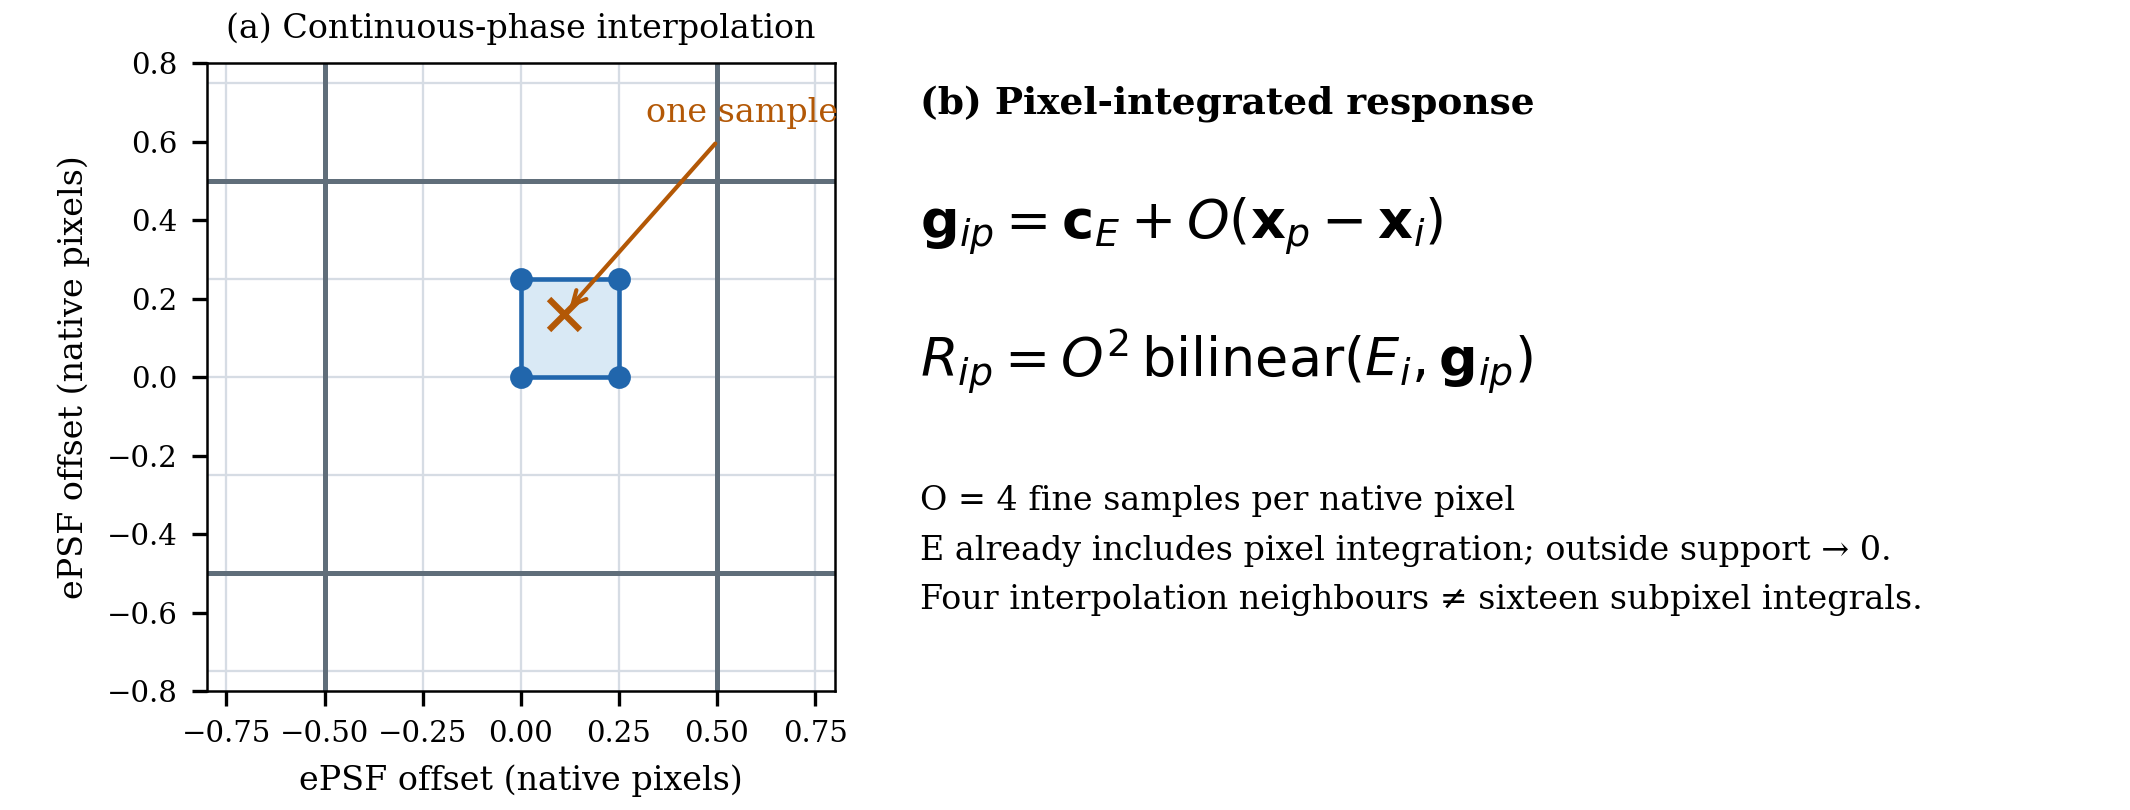
| 3.4 Joint calibration | M4: spatial response example and rendering | Corrected F5 inset + small final F14 profile panel; full mosaic/gauges in Appendix B. |
| 3.5 Per-band subtraction | Remapping, response-to-kernel conversion and scale | F20 basis/reconstruction in Appendix B; no performance claims here. |
| 4.1 Chromatic pixel response | M5: empirical residual stacks + displacement trend | Selected F10/F15 + compact held-out F11 data/model/residual examples; full F12 fields in Appendix B. |
| 4.2 Astrometric validation | M6: held-out vector residuals + radial-error distribution | Rebuild F9; common stars/masks, bias and scatter separately. |
| 4.3 Photometric consistency | M7: held-out colour/magnitude trends + spatial residuals | Rebuild F17; F7 stays development history, not a duplicate main figure. |
| 4.4 De-crowding performance | M8: image comparison + population residual score | F18 + selected F16 metrics/stamps; separate full-chain and kernel-only effects. Table 2: all five FFIs. |
| 4.5 Extraction, conditional | M9: target retained/subtracted + flux/uncertainty checks | Merge F19/F21 only with real independent targets; otherwise future work. |
| 5. Discussion; 6. Conclusions | Limits, interpretation, reproducibility, supported findings | G6 detail in Appendix B; failures remain explicit in the discussion. |
| Working ID | Visual/scientific verdict | Required action / destination |
|---|---|---|
| F1 | Clear overview; the 986-skycell grid shows mapping, not measured valid coverage. | Verify final mapping/count; add usable coverage and roles/folds; M1. |
| F2 | Readable curves; a synthesized response curve does not establish accurate synthetic fluxes. | State normalization, photon/energy and zero-point conventions; exact weights; Appendix C with spectral residuals. |
| F3 | Good accounting concept; whole-skycell view cannot establish neighbour preservation. Black conflates low/invalid pixels. | Adopted-recipe segmentation zoom; distinguish invalid pixels; M3, full plate appendix. |
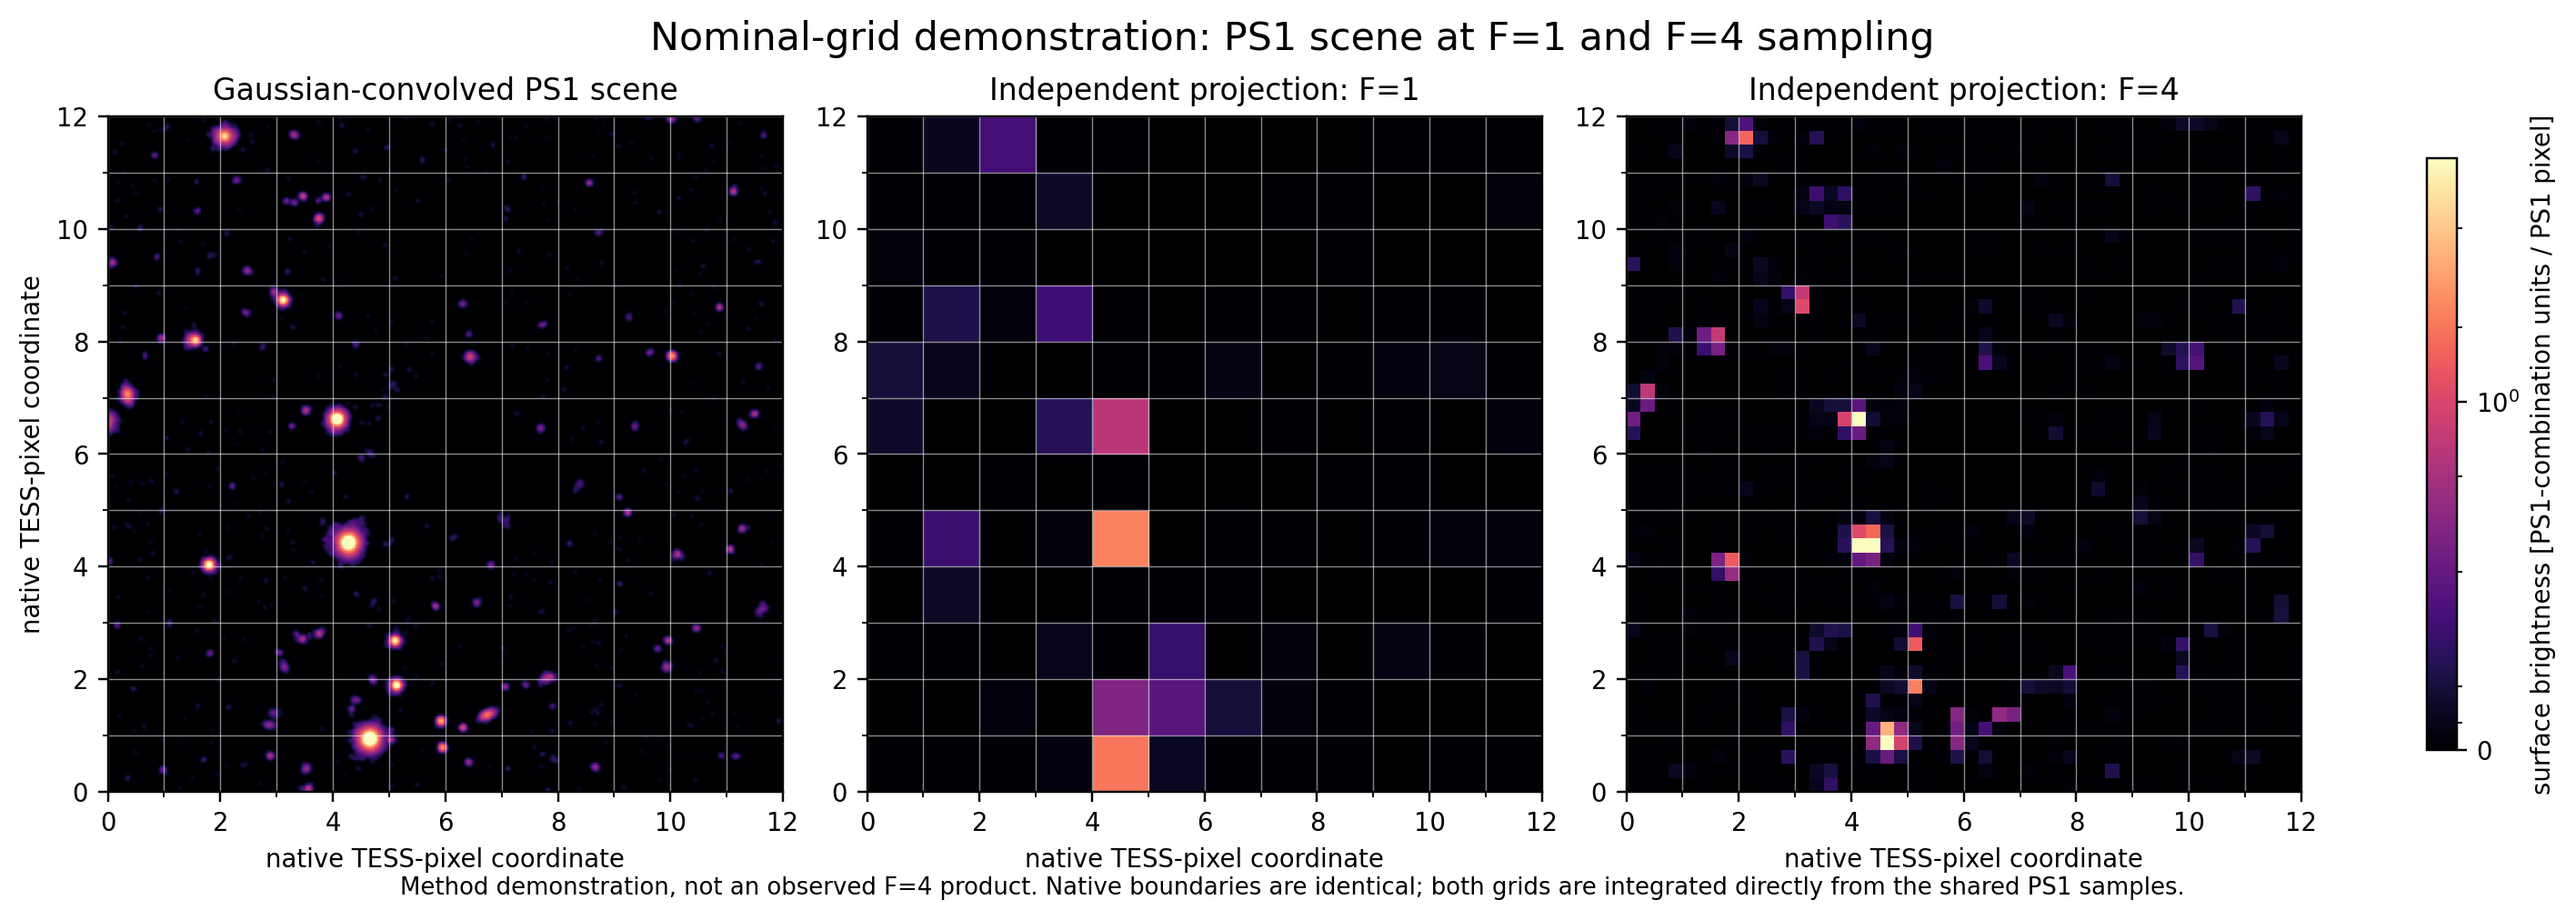
| F4 | Labelled nominal-grid demonstration; sharper fine pixels are not a measured accuracy gain. | Illustration or fixed-WCS sampling experiment; Appendix A. |
| F5 workflow | New layout is readable; TESS input is implicit, validation only a footnote, refit/extraction conflated. | Explicit TESS/Gaia inputs and scoring branch; distinguish optional extraction; M2. Old panoramic F5 is too small at print width. |
| F5 rendering | Corrects the old sixteen-sample diagram; symbols not all defined in caption. | Define coordinates, grid centre, stored response and normalization; distinguish spatial-node from pixel-grid interpolation; M4. Never reuse old f05inset.png. |
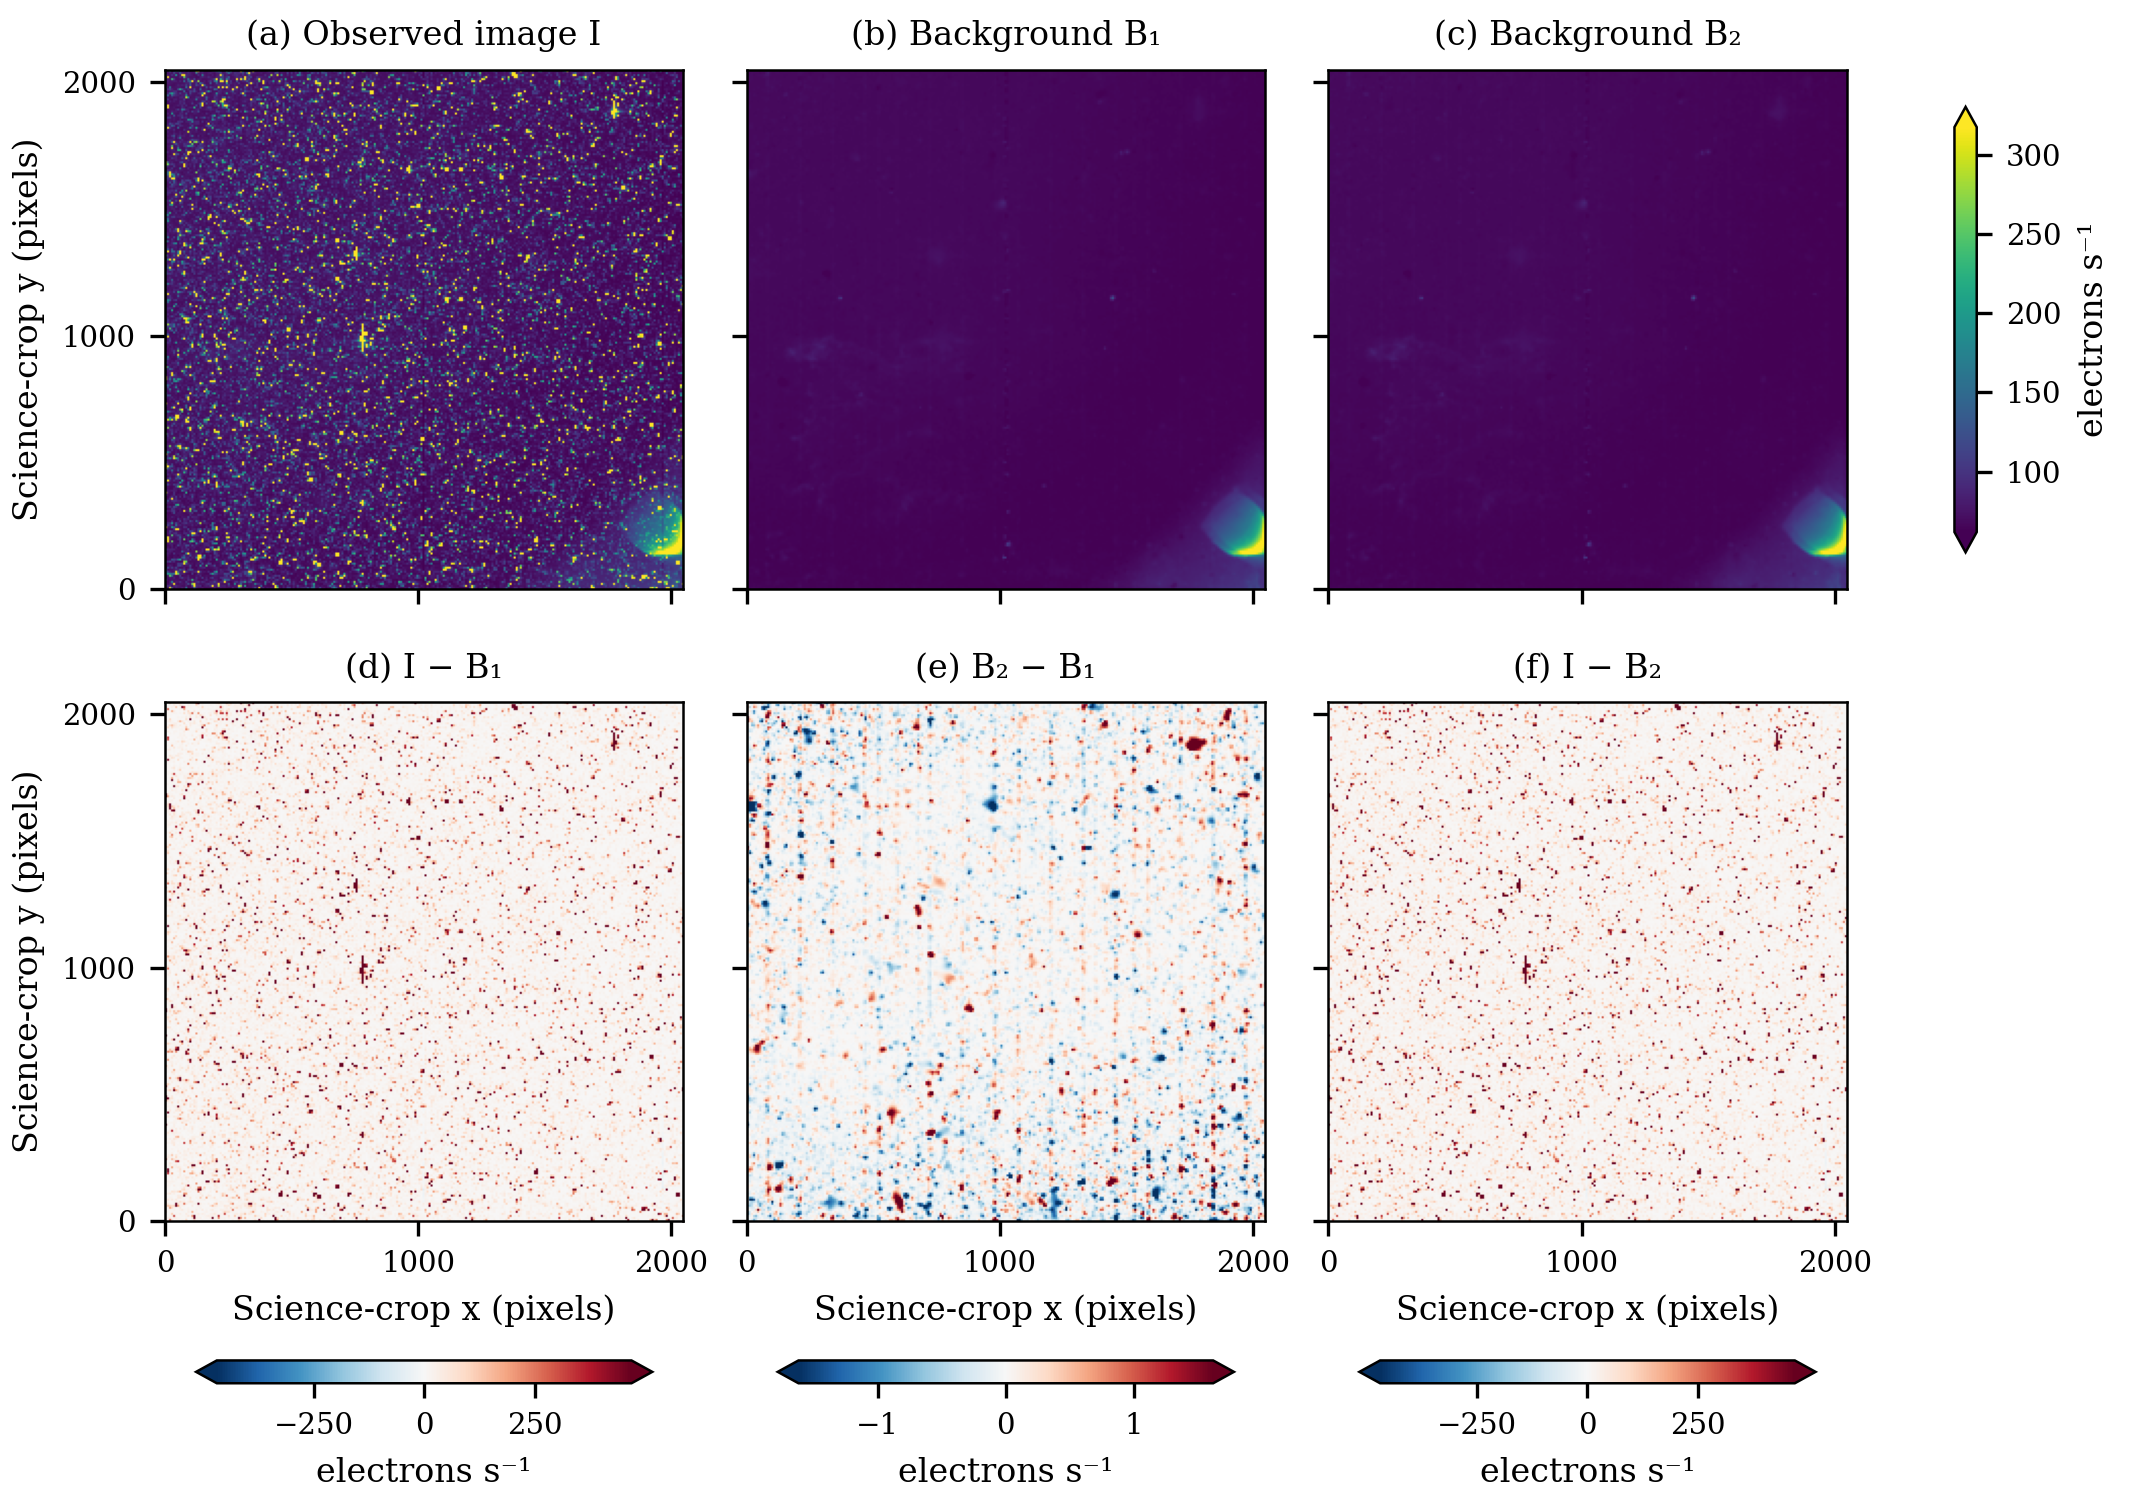
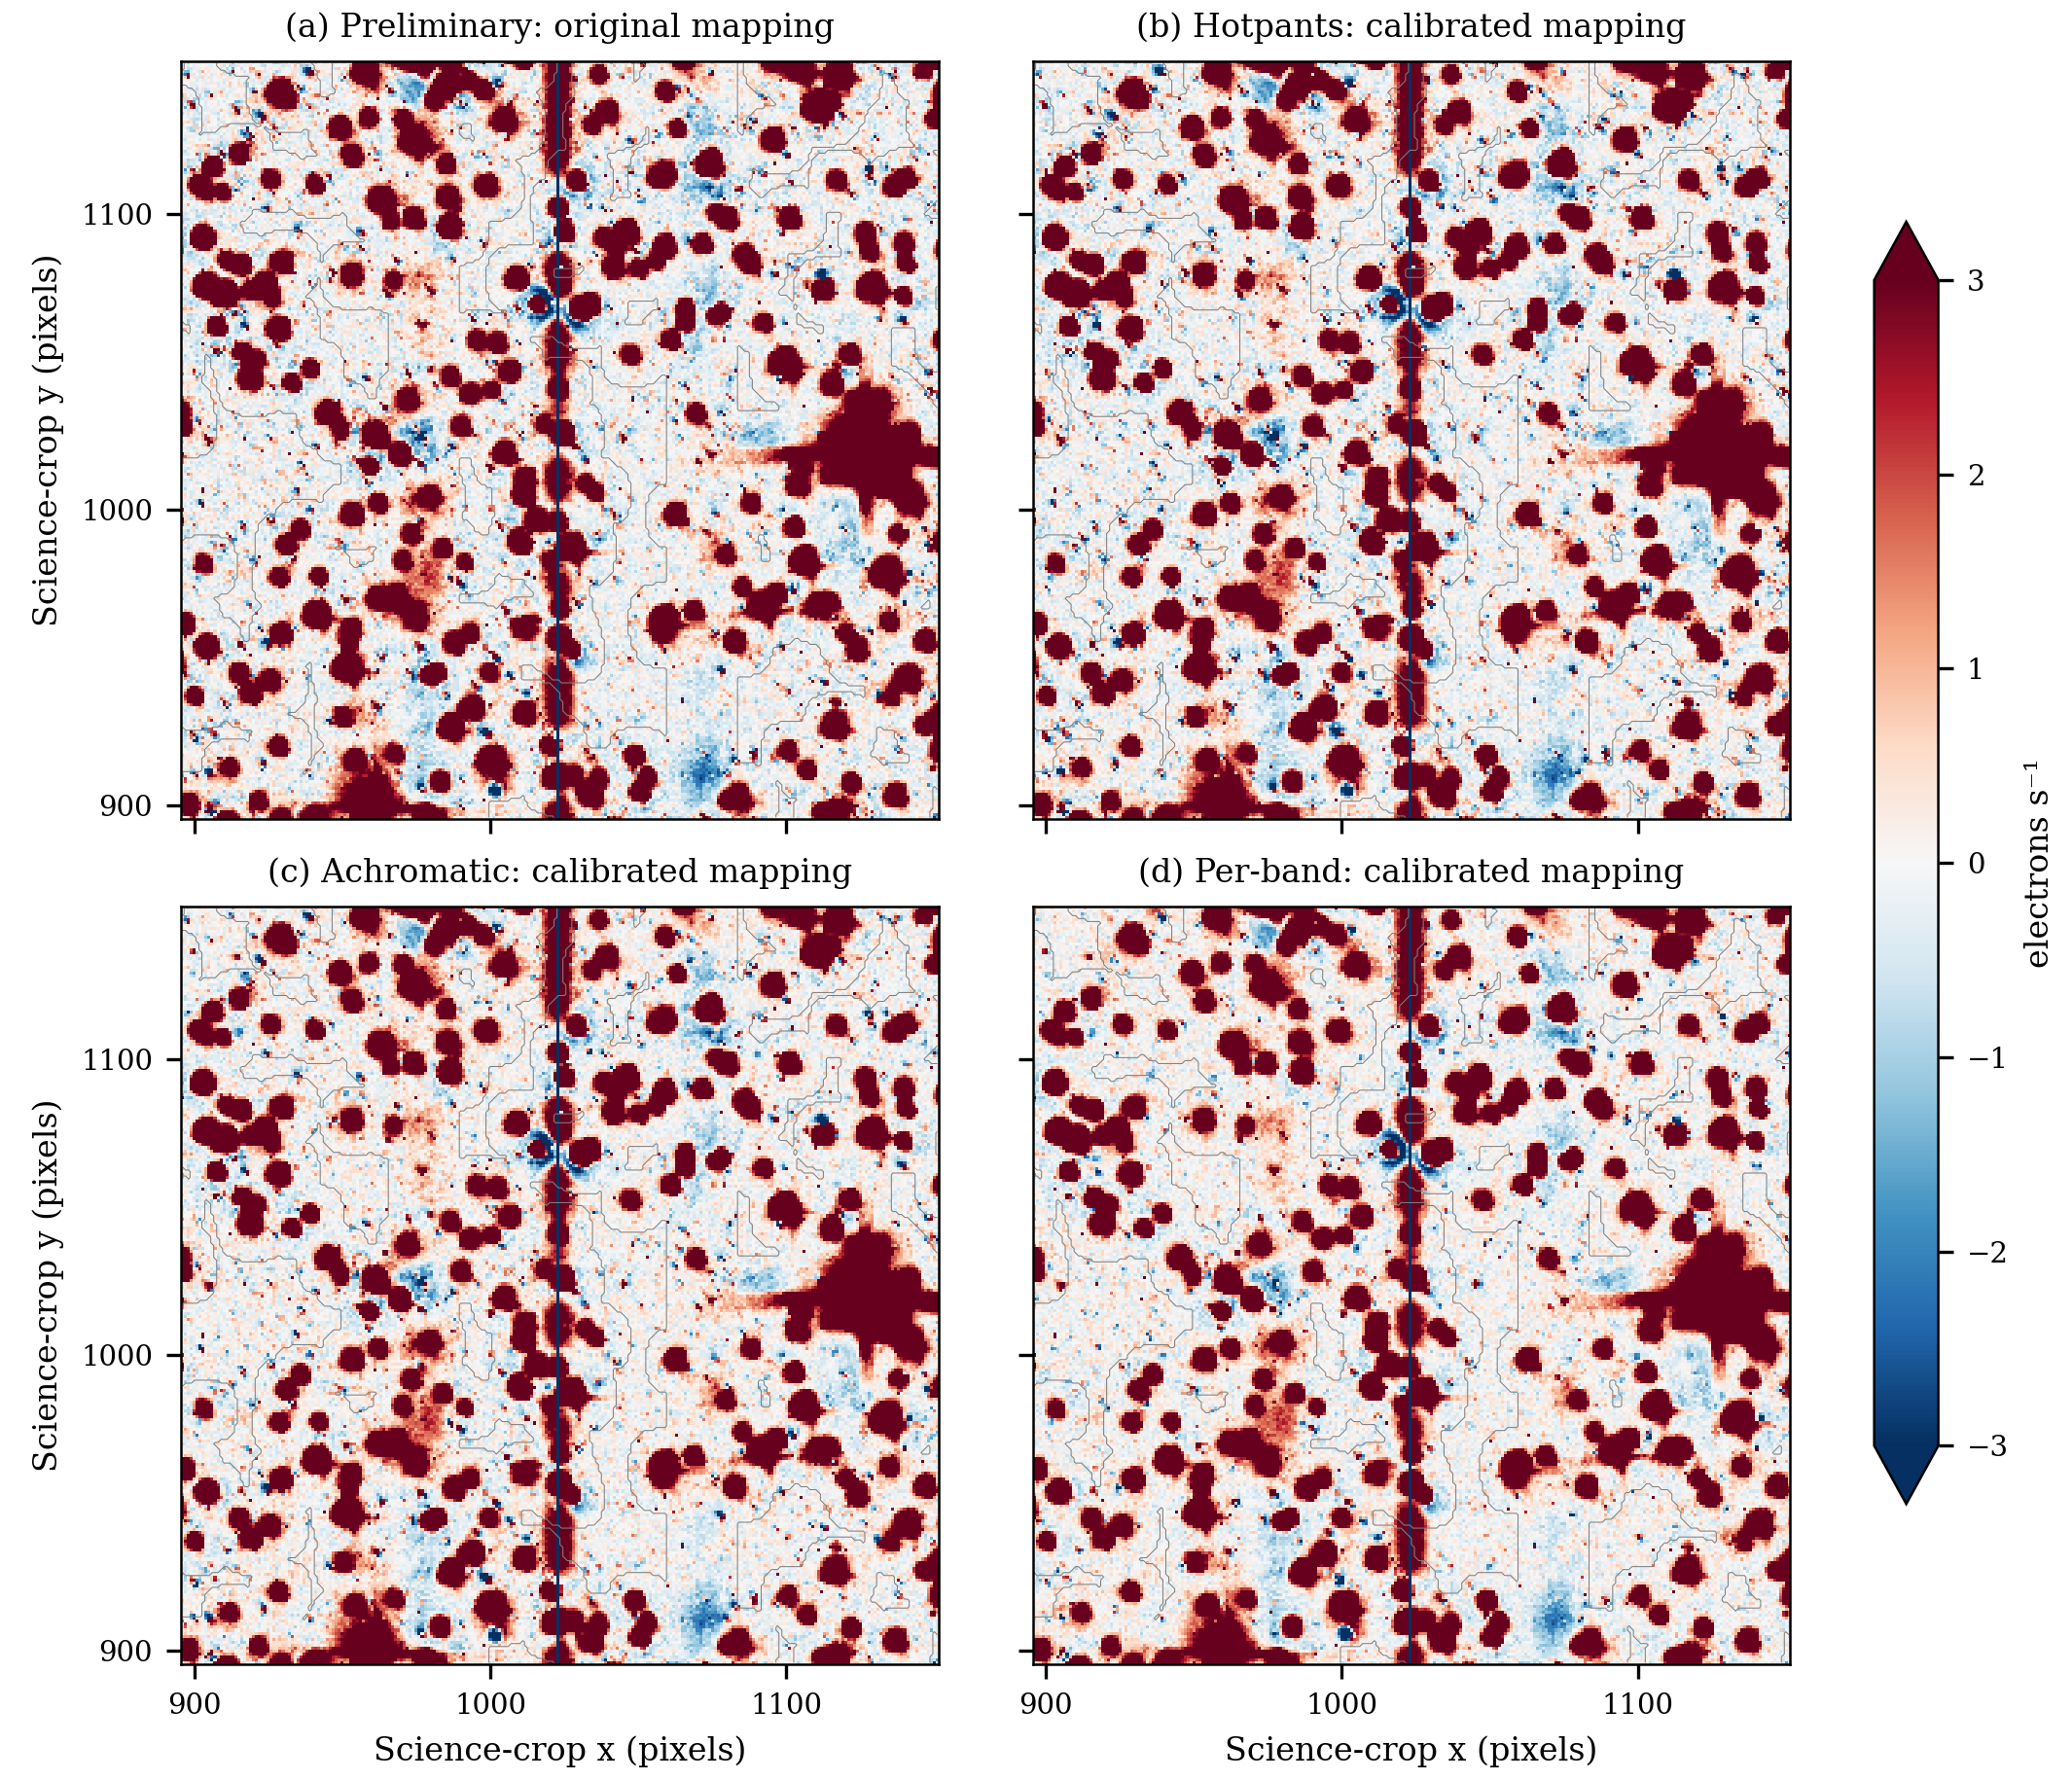
| F6 | Signed difference is useful; nearly identical cleaned full frames add little; legacy background recipe. | Harmonic output, mask, local blank-region residuals and validation; Appendix A. |
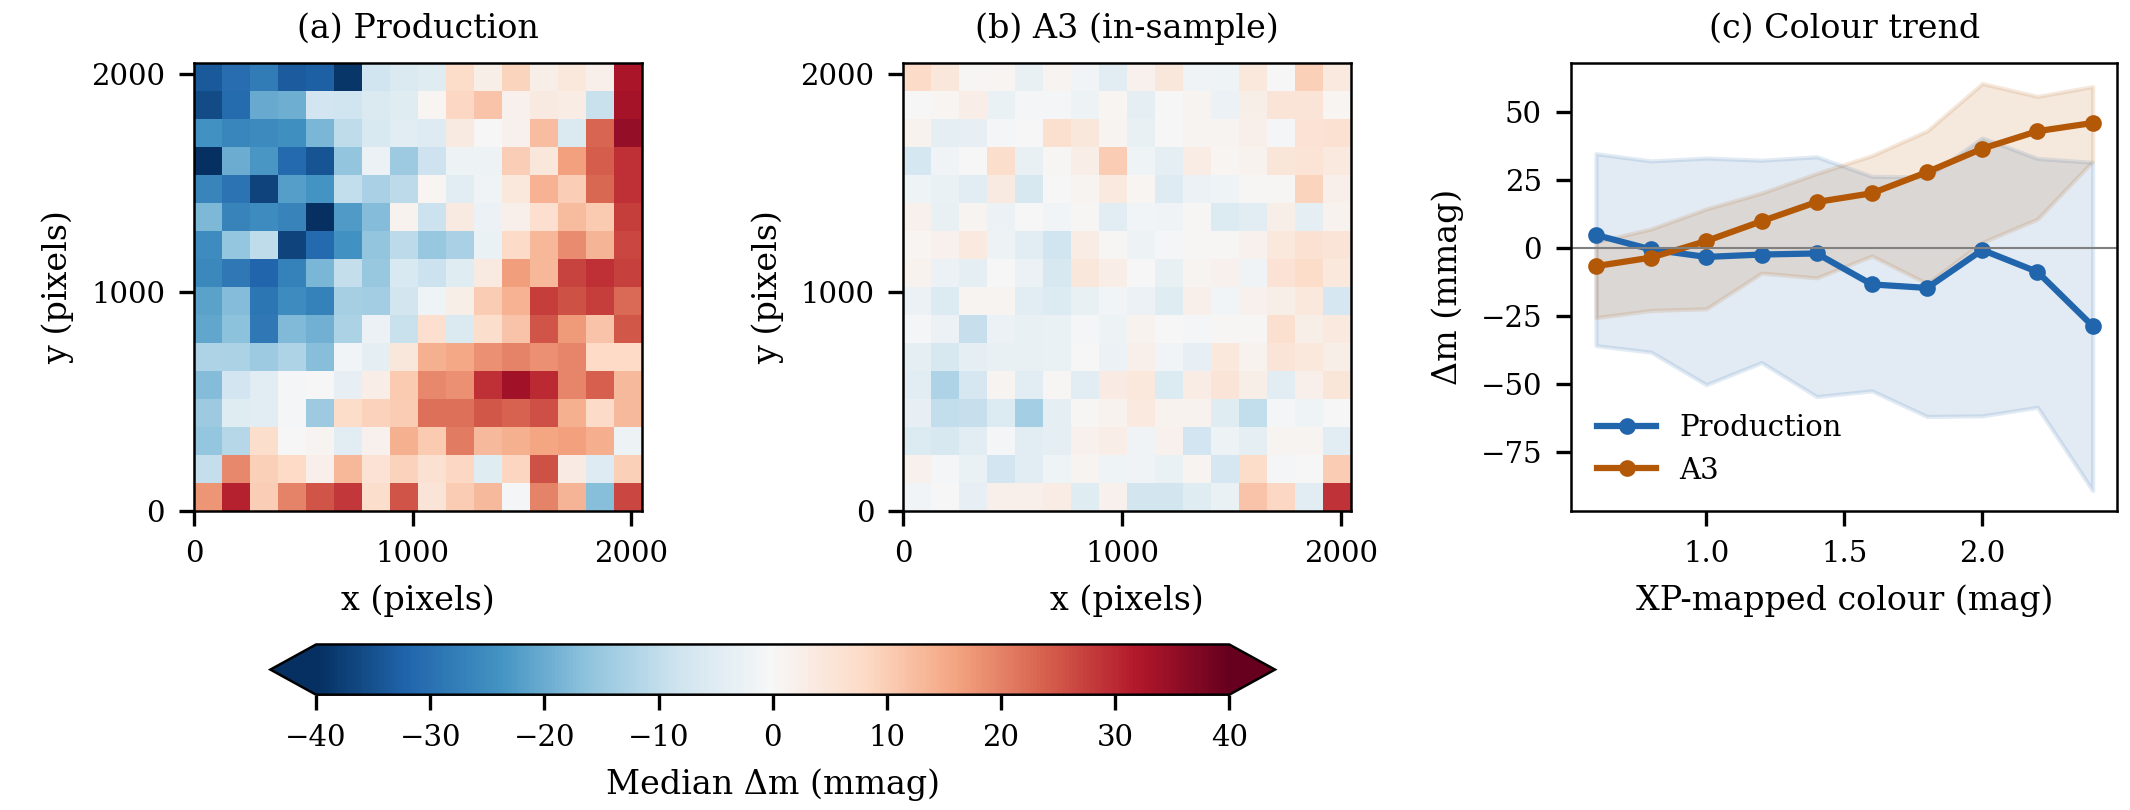
| F7 | Spatial maps flatten but A3 colour trend remains strong. Jointly clipped sample; separate zero points. | No blanket photometric-gain or absolute-calibration claim. Merge concept into held-out F17; archive this comparison. |
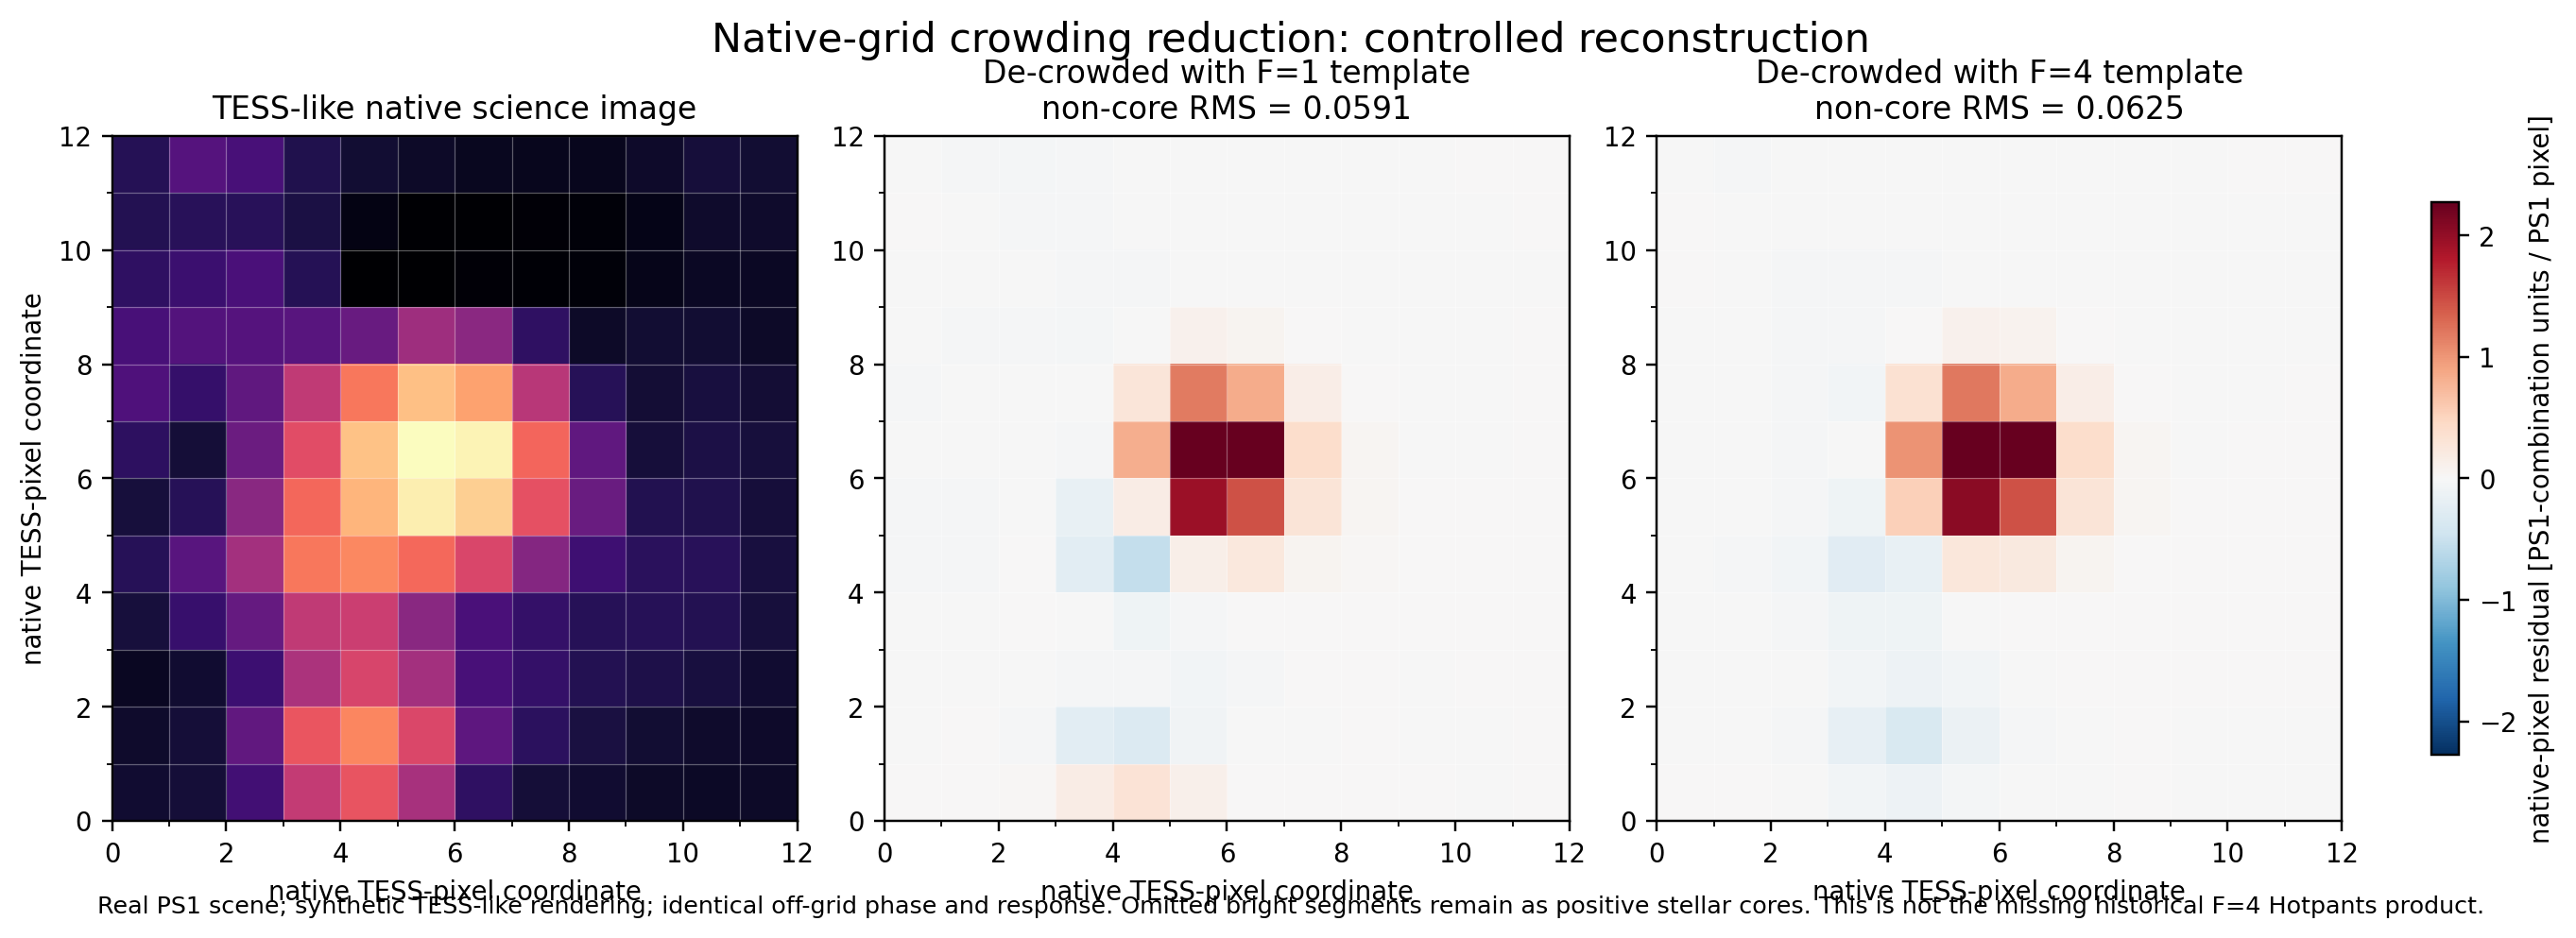
| F8 | Synthetic reconstruction, not observed performance. Bottom text is cramped; displayed F4 non-core RMS exceeds F1 here. | Not evidence of F4 superiority. Redesign controlled experiment/layout; Appendix A. |
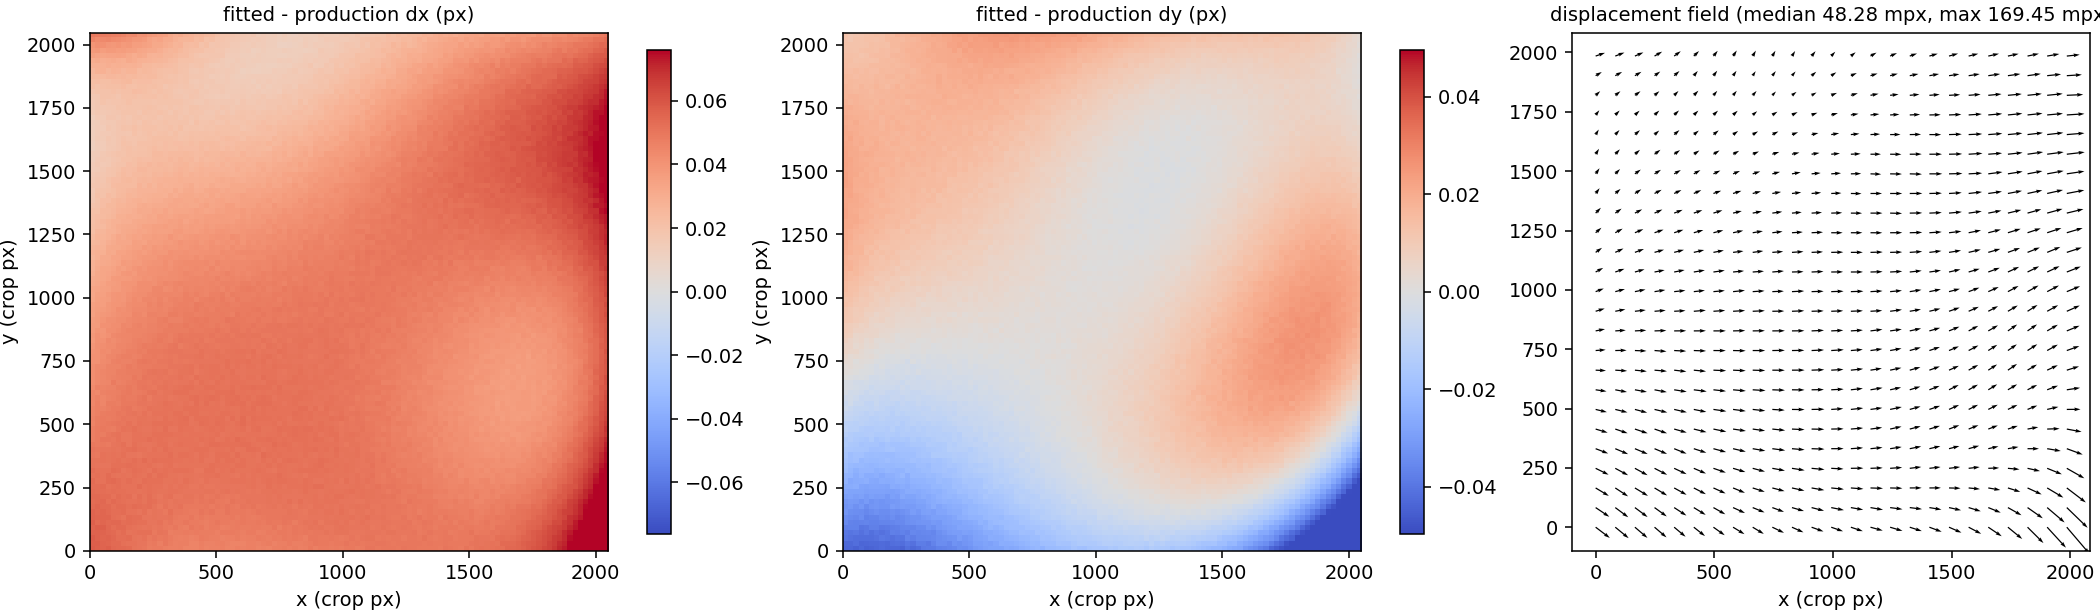
| F9 | Fitted-minus-production WCS measures solution change, not accuracy; component scales differ. | Held-out residual maps/CDF for M6; correction map only supporting context, with vector key. |
| F10 / F10F2 | Strong empirical-image layout: blue/red/difference, baseline/adopted, shuffle null. Dense lower mosaics; old #14 called adopted inside figure. | Final A3 heldouts, matched magnitude/crowding/phase, counts and uncertainty; selected stacks + F15 trend for M5, replication appendix. |
| F11, missing current evidence | Needed to show actual observed/model/residual pixels, not only summaries. | Preselected isolated/crowded and red/blue cases; same scale, masks, coordinates and IDs; compact M5 subset. |
| F12 | Useful spatial response, but smooth model fields can be mistaken for independent empirical estimates. | Model-only labels, calibrated colour/radius domain, empirical checks; A3 rebuild in Appendix B. |
| F13, optional | No active slot; model selection already has supporting diagnostics. | Do not add a redundant main plate; held-out ablation table/plot in Appendix B. |
| F14 / F14b | Tiled-coordinate axes obscure detector location; response units unspecified. The 72-stamp initial/final grid is too dense. | Small spatially located final examples/profiles with shared scale/support for M4; full node grid appendix; remove run-name titles. |
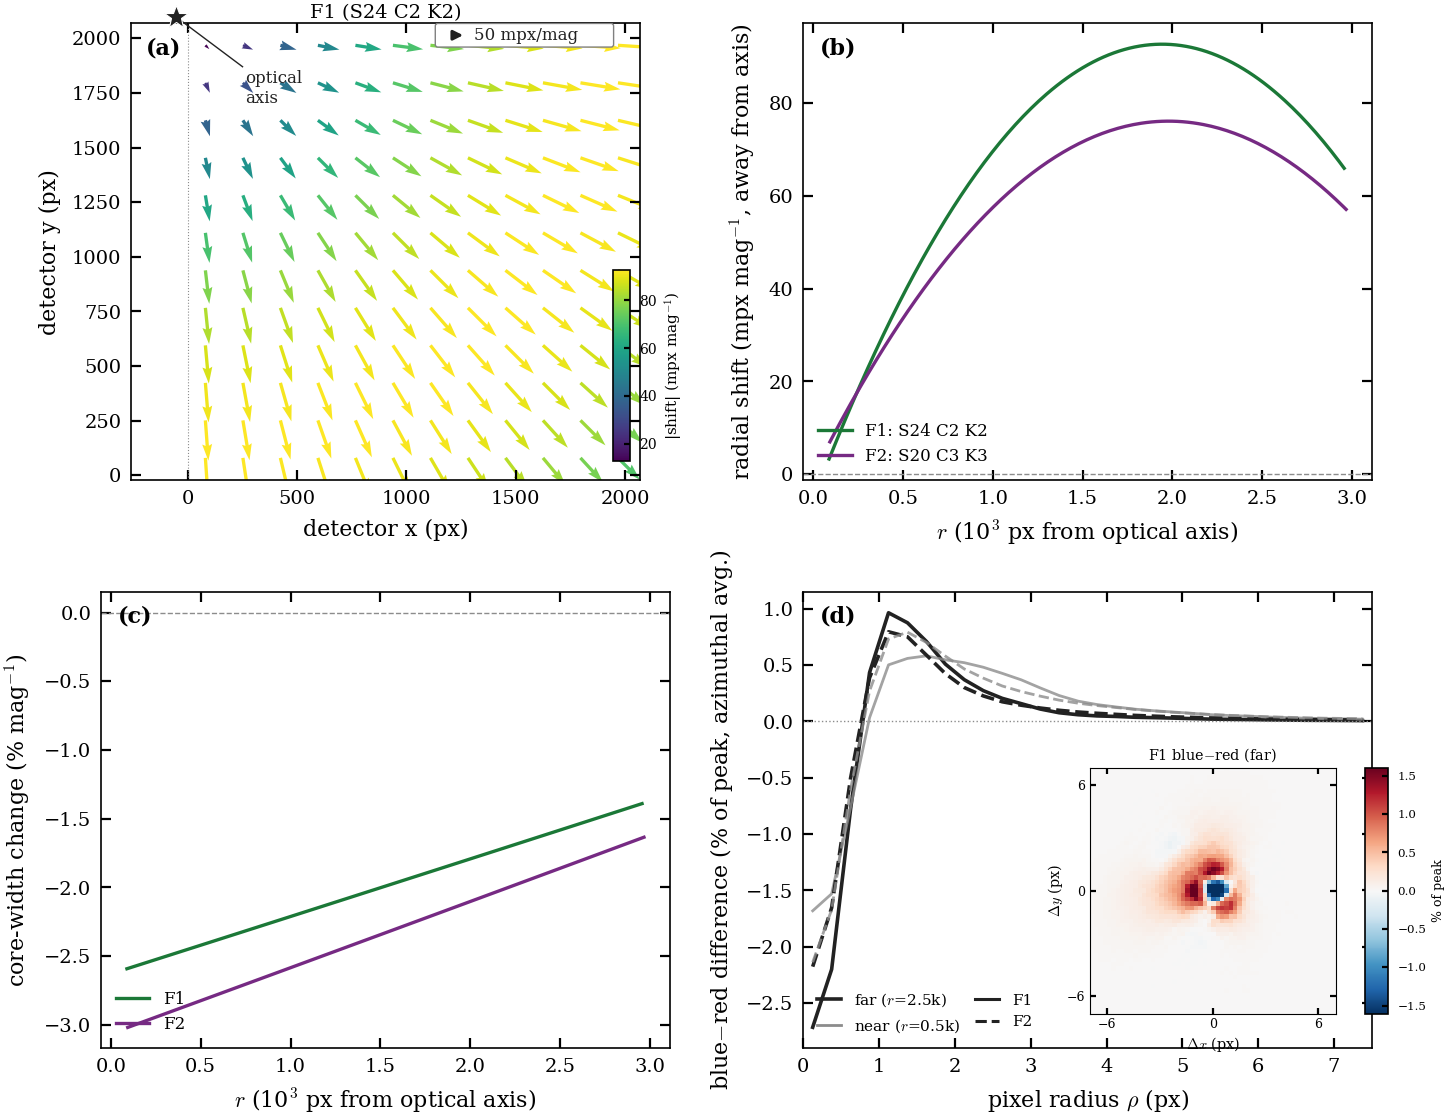
| F15 / F15F2 | Good radial/tangential null comparison; nine panels, role split and secondary axes dilute it. Baseline/corrected ranges differ. | Compact M5 trend; label zoomed range or add shared-scale context; role/null/replication appendix. |
| F16a / F16b | Stacks support the metrics; score plot has overlapping long titles, method IDs and overplotted points. Dry-run evidence. | Paired summaries, uncertainty/counts, common masks/noise, readable labels and matching stamps; M8. |
| F17 / F17pre | Older provisional held-out evidence exists, but not for final recipe; twelve panels and aperture decomposition overload it. | Final common-fold trends/map in M7; aperture decomposition appendix. Train zero points off test data or scope score explicitly to zero-point-removed consistency. |
| F18 | Honest fixed region/shared signed scale; retained-star saturation dominates, masks are busy, differences hard to see. | Context panel, retained-star markers, predetermined smaller zooms and paired differences; saturation/valid-pixel fractions; M8. No favourable-residual selection. |
| F19, missing | Target retention is distinct from a generic final-image comparison. | IDs, neighbours, unchanged controls and segment accounting; conditional M9. |
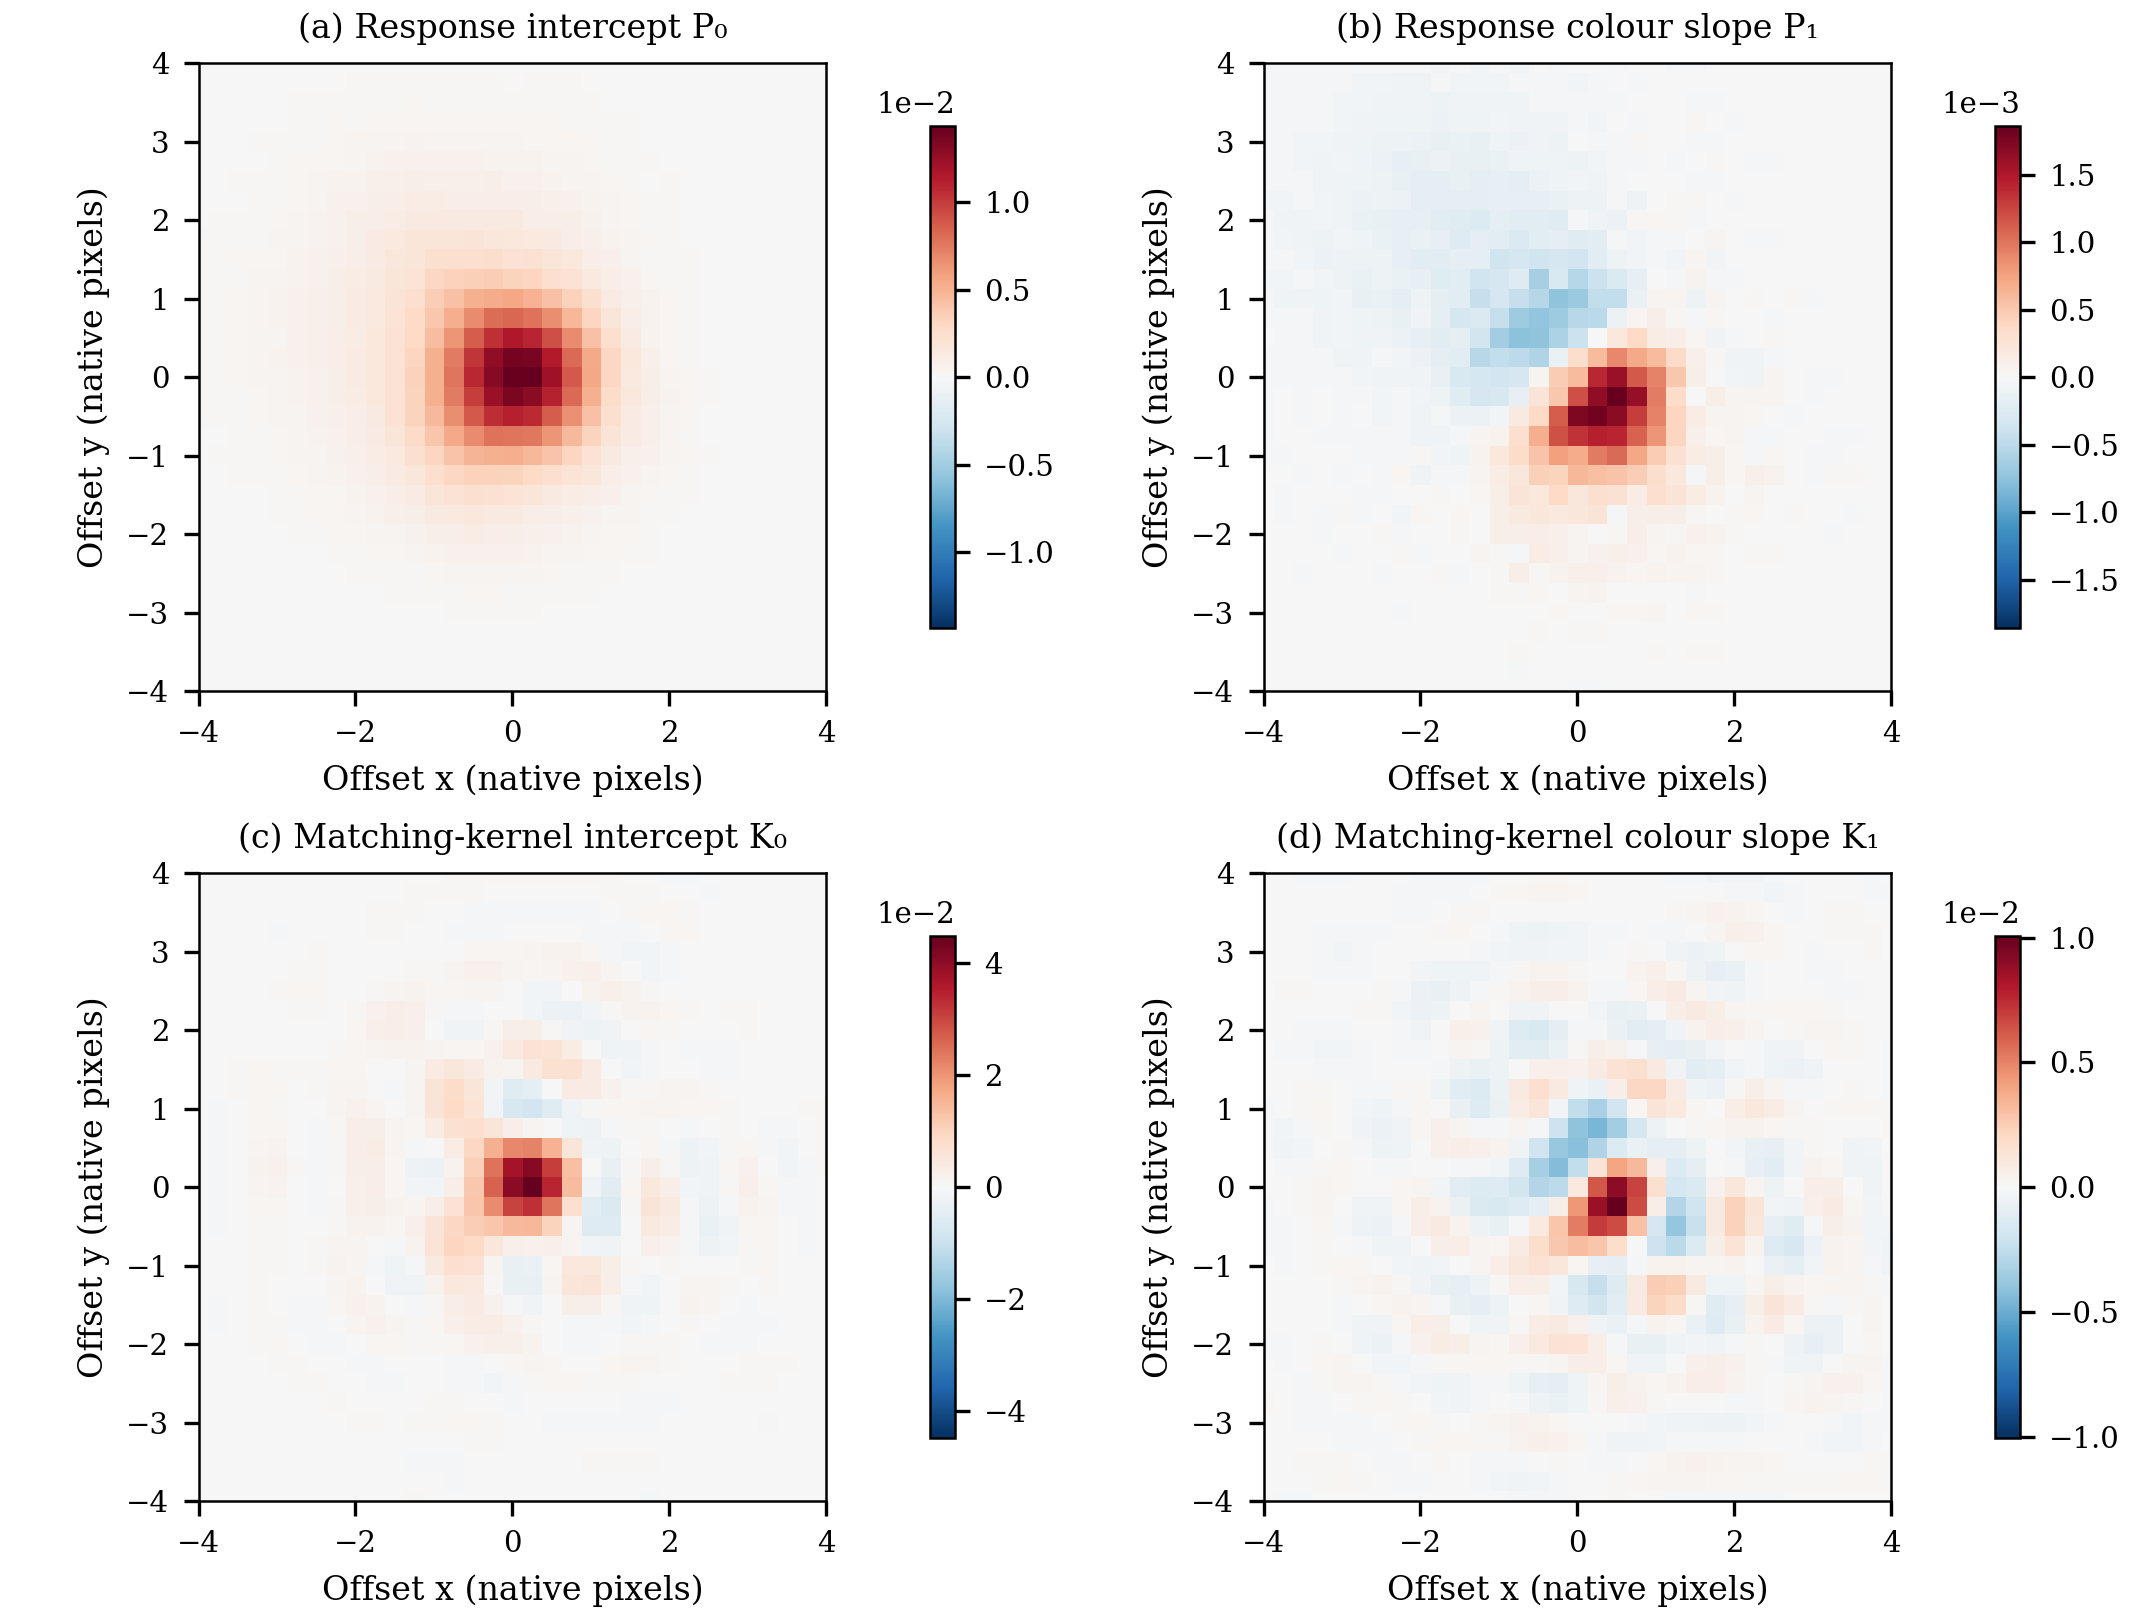
| F20 | Clear P-versus-K distinction. One node and ±4-pixel view cannot establish full-support ringing/reconstruction. | Explicit colour-bar units/normalization, full-support checks and reconstruction residuals at centre/edge; Appendix B. |
| F21, missing | No current product establishes extraction recovery/uncertainty calibration. | Real independent targets and scoped injection/recovery or repeats; conditional M9; no temporal-precision claim. |
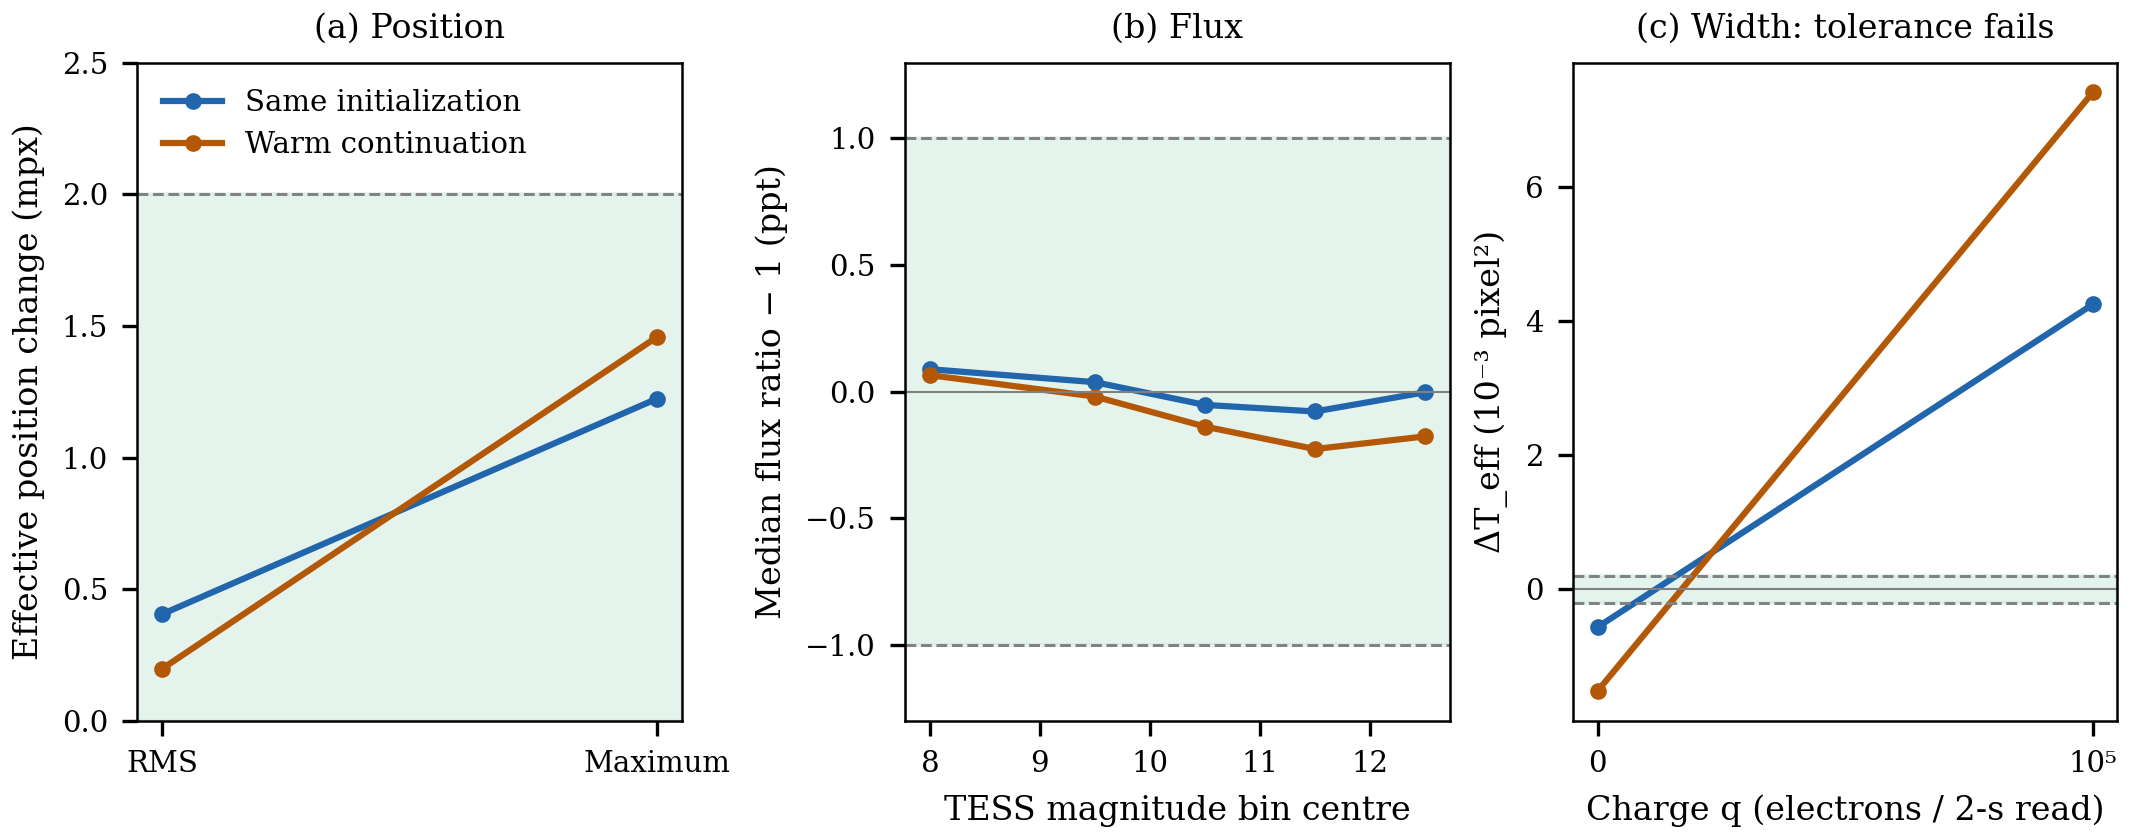
| G6 | Width failure is clear; flux medians hide tails; connecting RMS and maximum implies a continuous axis. | Separate categorical markers, tail/quantile checks and parameter maps; repeat final recipe; Appendix B plus limitations. |
| Assets | Finding / action |
|---|---|
fA_f1, fA_f4 |
Same region/scale, but WCS/recipe differ; prominent vertical seam. Matched experiment needed; Appendix A/history. |
fS_lcurve |
Important generalization warning; five thin panels and dense legend. Rebuild final-recipe curves in 2 × 3 layout; Appendix B. Old curves do not set new stopping point. |
fA1 |
Model selection, optical-axis scan and covariance answer three questions; tiny annotations. Split/trim; selection set is not a final test set. |
fA2 |
Useful ablation/checkpoint drift, but older model called adopted. Final matched held-out ablation; separate convergence panel. |
fA3 |
Relevant gauge/normalization sensitivity; too many tests. Split normalization from gauge/loss; show underlying residual images. |
fB4 |
Readable A3 development comparison, warm-started and in-sample. Historical rationale, not unbiased confirmation. |
fB5 |
Eleven-FFI development breadth is not the five-FFI adopted dataset; eight metrics are dense. Do not substitute for final Table 2. |
fB6 |
Heterogeneous coefficient units, colours-only detector key, little physical interpretation. Parameter table with uncertainty/induced response, not main text. |
fB7 |
Spatial width discrepancy remains visible: valuable negative evidence. Rebuild with final recipe, counts and residual stamps; discuss persistent failure. |
old f20, fG6 |
Too many tiny kernel/refit panels. Compact new plates are better starting points; full grids remain diagnostics. |
fS_bandpass |
Useful spectral-type/colour residuals; crowded legend and extrapolated tails. Identify training/independent spectra and supported domain; Appendix C. |
fS_response |
Eight panels mix image residuals and catalog photometry. Split by question; response attribution remains a hypothesis without controlled evidence. |
fS_weights |
Lower score coexists with aperture/colour discrepancy. Paired controls, uncertainty definitions and failure discussion; no blanket gain. |
648c0bcf4b559691177f7b4764f721ac54aebdc8 and chain pin e795e8e16ee8ed598e629cdfe950a7ad6a10b5f0; earlier mapping SHA c466fb2 is documented as mapping-code equivalent. Record stage × field provenance, not a fictitious single executed SHA.v1min exclusions, not v1; harmonic background with pad 2 in background estimation/kernel fitting. Later pin table/log supersede the README's older blocking/planned sections.6955ee77eed5b4f25e13cdf66c75b3aceed3f82baac572639e14766941cf9481; current at audit: 30926d499f4925c11bd192c559c39ef2090b53519c14bb67610bba8721778e10.export_status still requests visual review despite the prior screen review. Next release needs explicit review date/scope, distinct from final-size proofing.dev repository, not the parent pipeline repository.codex/paper1-publication; base commit 8ee5d57.dev/.worktrees/paper1-publication; original checkout and canvas remain unchanged.OUTLINE.md is the current editorial outline. The prior outline is preserved in archive/OUTLINE_20260930.md and Git./astro/armin/koji/syndiff/dev_runs/paper_dataset_20261001/README.md, read 2026-10-01. It supersedes older outline and freeze-log entries, not necessarily later owner updates.forward_epsf_wcs/epsf_model.py, render_stamps and render_physical_pixels_blocksum; the latter retains a legacy function name.e2e_f1_20260930/scripts/kernels/k02_band_epsf.py.figures/report_20260929/publication/manifest.json.syndiff environment, from this worktree: python paper/paper1_single_ffi/figures/publication/build_figures.py, then python paper/paper1_single_ffi/figures/publication/build_canvas.py.figures/report_20260929/publication/index.html; source bullets come directly from OUTLINE.md.