Measuring the TESS effective PSF in single full-frame images de-crowded with Pan-STARRS
Working draft of Paper 1: structure, text and figures in reading order. Equations are in LaTeX with every symbol defined under the equation that introduces it. Figure numbers are provisional.
Terminology: "preliminary de-crowded image" and "final de-crowded image", because the bright stars used for the fit are deliberately still in them. F1, F2, S22, C1, C4 label the five fields (Table 2). $O$ is the ePSF grid oversampling.
Status and decisions (2026-10-13)
- Main model: the joint fit on the preliminary de-crowded image, with no brightness term. The brightness dependence is reported as a measurement (§5.3, Appendix E).
- Colour model: radial shift plus ring and coma basis functions (§4.4). The physical-operator model is compared in Appendix D.
- PS1 template calibration (per-skycell zero point and per-CCD kept-wing factor) is applied to the final per-band templates only (§2.5, §6.3). The preliminary template is uncalibrated by design.
- Pipeline frozen. §4 and §5 report the fit on the preliminary image. The refit on the final image is the stability check of §6.4. The final §6 figures come from the final production run, which has not finished.
- Open items: colour figures 9, 12, 13 and Appendix D W3L regenerating on the preliminary-image fits; brightness figures 14 and E1 W3d; figures 18–24, F1 and the PS1 stack offset figure W4 / final run; native-grid comparison, Appendix A W1; all numbers in §5 and §6 marked "to update".
- Readiness tracker:
/astro/armin/koji/syndiff/dev_runs/paper1_figures_20261009/PAPER_READINESS.md
1 Introduction
TESS full-frame images have 21-arcsecond pixels, so stars blend, and the point spread function is undersampled, so its shape depends on where in a pixel a star falls. Measuring the effective PSF (ePSF) from such images is hard because every star is contaminated by its neighbours. Pan-STARRS (PS1) images resolve those neighbours at 0.25 arcsec per pixel.
This paper makes three contributions.
- PS1 de-crowding. We build a TESS-like template of the faint stars from four PS1 bands and subtract it, leaving the bright stars in the image (§2, §3).
- The ePSF and its dependences. In the de-crowded image we fit positions, fluxes and a spatially varying ePSF jointly, and measure how the ePSF changes across the detector, with star colour, and with brightness (§4, §5).
- A colour-correct template. We feed the fitted ePSF back, one kernel per PS1 band, to build a final de-crowded image, and test astrometry, photometry and stability (§6).
Table 1 gives the data flow.
Steps are numbered as in the text. Step 5a is the photometric calibration of the final per-band templates (§2.5).
| # | Step | What is done | Input → output | Sect. |
|---|---|---|---|---|
| PS1 reference scene | ||||
| 1 | Mapping | Find, for every TESS pixel (and its sub-pixels), the PS1 skycell pixel that covers it, using the initial TESS WCS. | TESS FFI WCS, PS1 skycell tessellation → TESS-pixel → PS1-pixel lookup table | 2.1, 2.4 |
| 2 | Combine filters | Convert $r,i,z,y$ stacks to counts s$^{-1}$ and add them with the fixed weights $w_{r,i,z,y}=(0.254, 0.437, 0.165, 0.144)$ into one TESS-like PS1 image per skycell. | PS1 $r,i,z,y$ skycells $\to$ combined skycell image $C_0=\sum_b w_bF_b$ | 2.2 |
| 3 | PS1 background and bright-star removal | On the combined image only, keep the pixels of detected sources and set the PS1 sky to zero; blank the whole source footprint of every saturated or $T<13$ star. | $C_0$ $\to$ combined image $C=Z\,C_0$ and a 0/1 keep mask $Z$, plus a record of what was removed | 2.3 |
| 4 | Convolve, per filter | Apply the same keep mask to each weighted band and smooth each with the common Gaussian ($\sigma=40$ PS1 pixels), across skycell boundaries and with seam corrections. | $Z\,w_bF_b$ for $b=r,i,z,y$ $\to$ smoothed band images $\mathcal G\circledast(Z\,w_bF_b)$ | 2.4 |
| 5 | Resample, per filter | Bin each smoothed band onto the TESS grid using the mapping, on a grid 4$\times$ finer than the TESS pixel (and, for comparison, at native sampling). | smoothed band images + lookup table $\to$ band templates $T_b$ in TESS-pixel coordinates | 2.4 |
| 5a | Calibrate templates | Per-skycell PS1 zero point × per-CCD kept-wing factor (final per-band templates only; the preliminary template stays uncalibrated). | $T_b$, isolated-star fluxes $\to$ calibrated band templates | 2.5, 6.3 |
| 6 | Combine again | Sum the band templates (weights already included) into the band-combined template. | $T_b$ $\to$ $T=\sum_bT_b$ | 2.4 |
| Preliminary de-crowded image and joint fit | ||||
| 7 | Hotpants subtraction of the PS1 stars | Fit one spatially varying matching kernel to the science frame (with an image-level background), convolve the fine template with it and subtract. Bright stars were removed from the template and stay in the image. | FFI, $T$ $\to$ preliminary de-crowded image $D_{\rm prel}$ | 3.1, 3.2 |
| 8 | Joint fit | Fit all bright Gaia stars in $D_{\rm prel}$ for the WCS, a chromatic and spatially varying ePSF, fluxes. | $D_{\rm prel}$, Gaia positions and colours $\to$ fitted WCS, ePSF with colour terms | 4 |
| Final de-crowded image and photometry | ||||
| 9 | Remap on the fitted WCS | Repeat the mapping with the fitted WCS and rebuild the band templates, so the template and the ePSF share one pointing. | fitted WCS, steps 4–5 $\to$ band templates $T_b'$ | 6.3 |
| 10 | Per-band kernels | For each PS1 band, evaluate the fitted ePSF at that band's colour and remove the smoothing already applied to the template, giving a matching kernel $K_b$ at every position. | ePSF with colour terms, Gaussian width $\to$ kernels $K_b(\mathbf r)$ | 6.3 |
| 11 | Final template | Convolve each band template with its own kernel and sum. | $T_b'$, $K_b$ $\to$ $\sum_bK_b\circledast T_b'$ | 6.3 |
| 12 | Final de-crowded image | Subtract the final template from the background-corrected FFI. | FFI, background, step 11 $\to$ $D_{\rm final}=(I-B)-\sum_bK_b\circledast T_b'$ | 6.3 |
| 13 | Retrain for bright-star photometry | Refit the WCS and ePSF on the final image to check that they do not move, and take the refitted model for photometry of the bright stars. | $D_{\rm final}$ (step 12) $\to$ refitted WCS and ePSF, convergence check | 6.4 |
| 14 | Reconstruct the faint-star light in the template | For a target star, take its own PS1 source segment in each band and push it through the same smoothing, resampling and kernels as the template. | target segment, $K_b$, step 4–5 chain $\to$ modelled target image $M_t$ | 6.5 |
| 15 | Photometry | Add $M_t$ back to the final image and fit the target flux together with its neighbours; bright stars are measured directly on $D_{\rm final}$. | $D_t=D_{\rm final}+M_t$ $\to$ fluxes | 6.5 |
2 Pan-Starrs reference scene
The product of this section is four band templates $T_b$ on the TESS grid. No ePSF enters here.
2.1 Inputs, coverage and mapping
- For every TESS pixel (and sub-pixel) we find the PS1 skycell pixels that cover it, using the initial TESS WCS. Candidate skycells come from a polygon-point query; overlaps are resolved by the nearest PS1 projection centre.
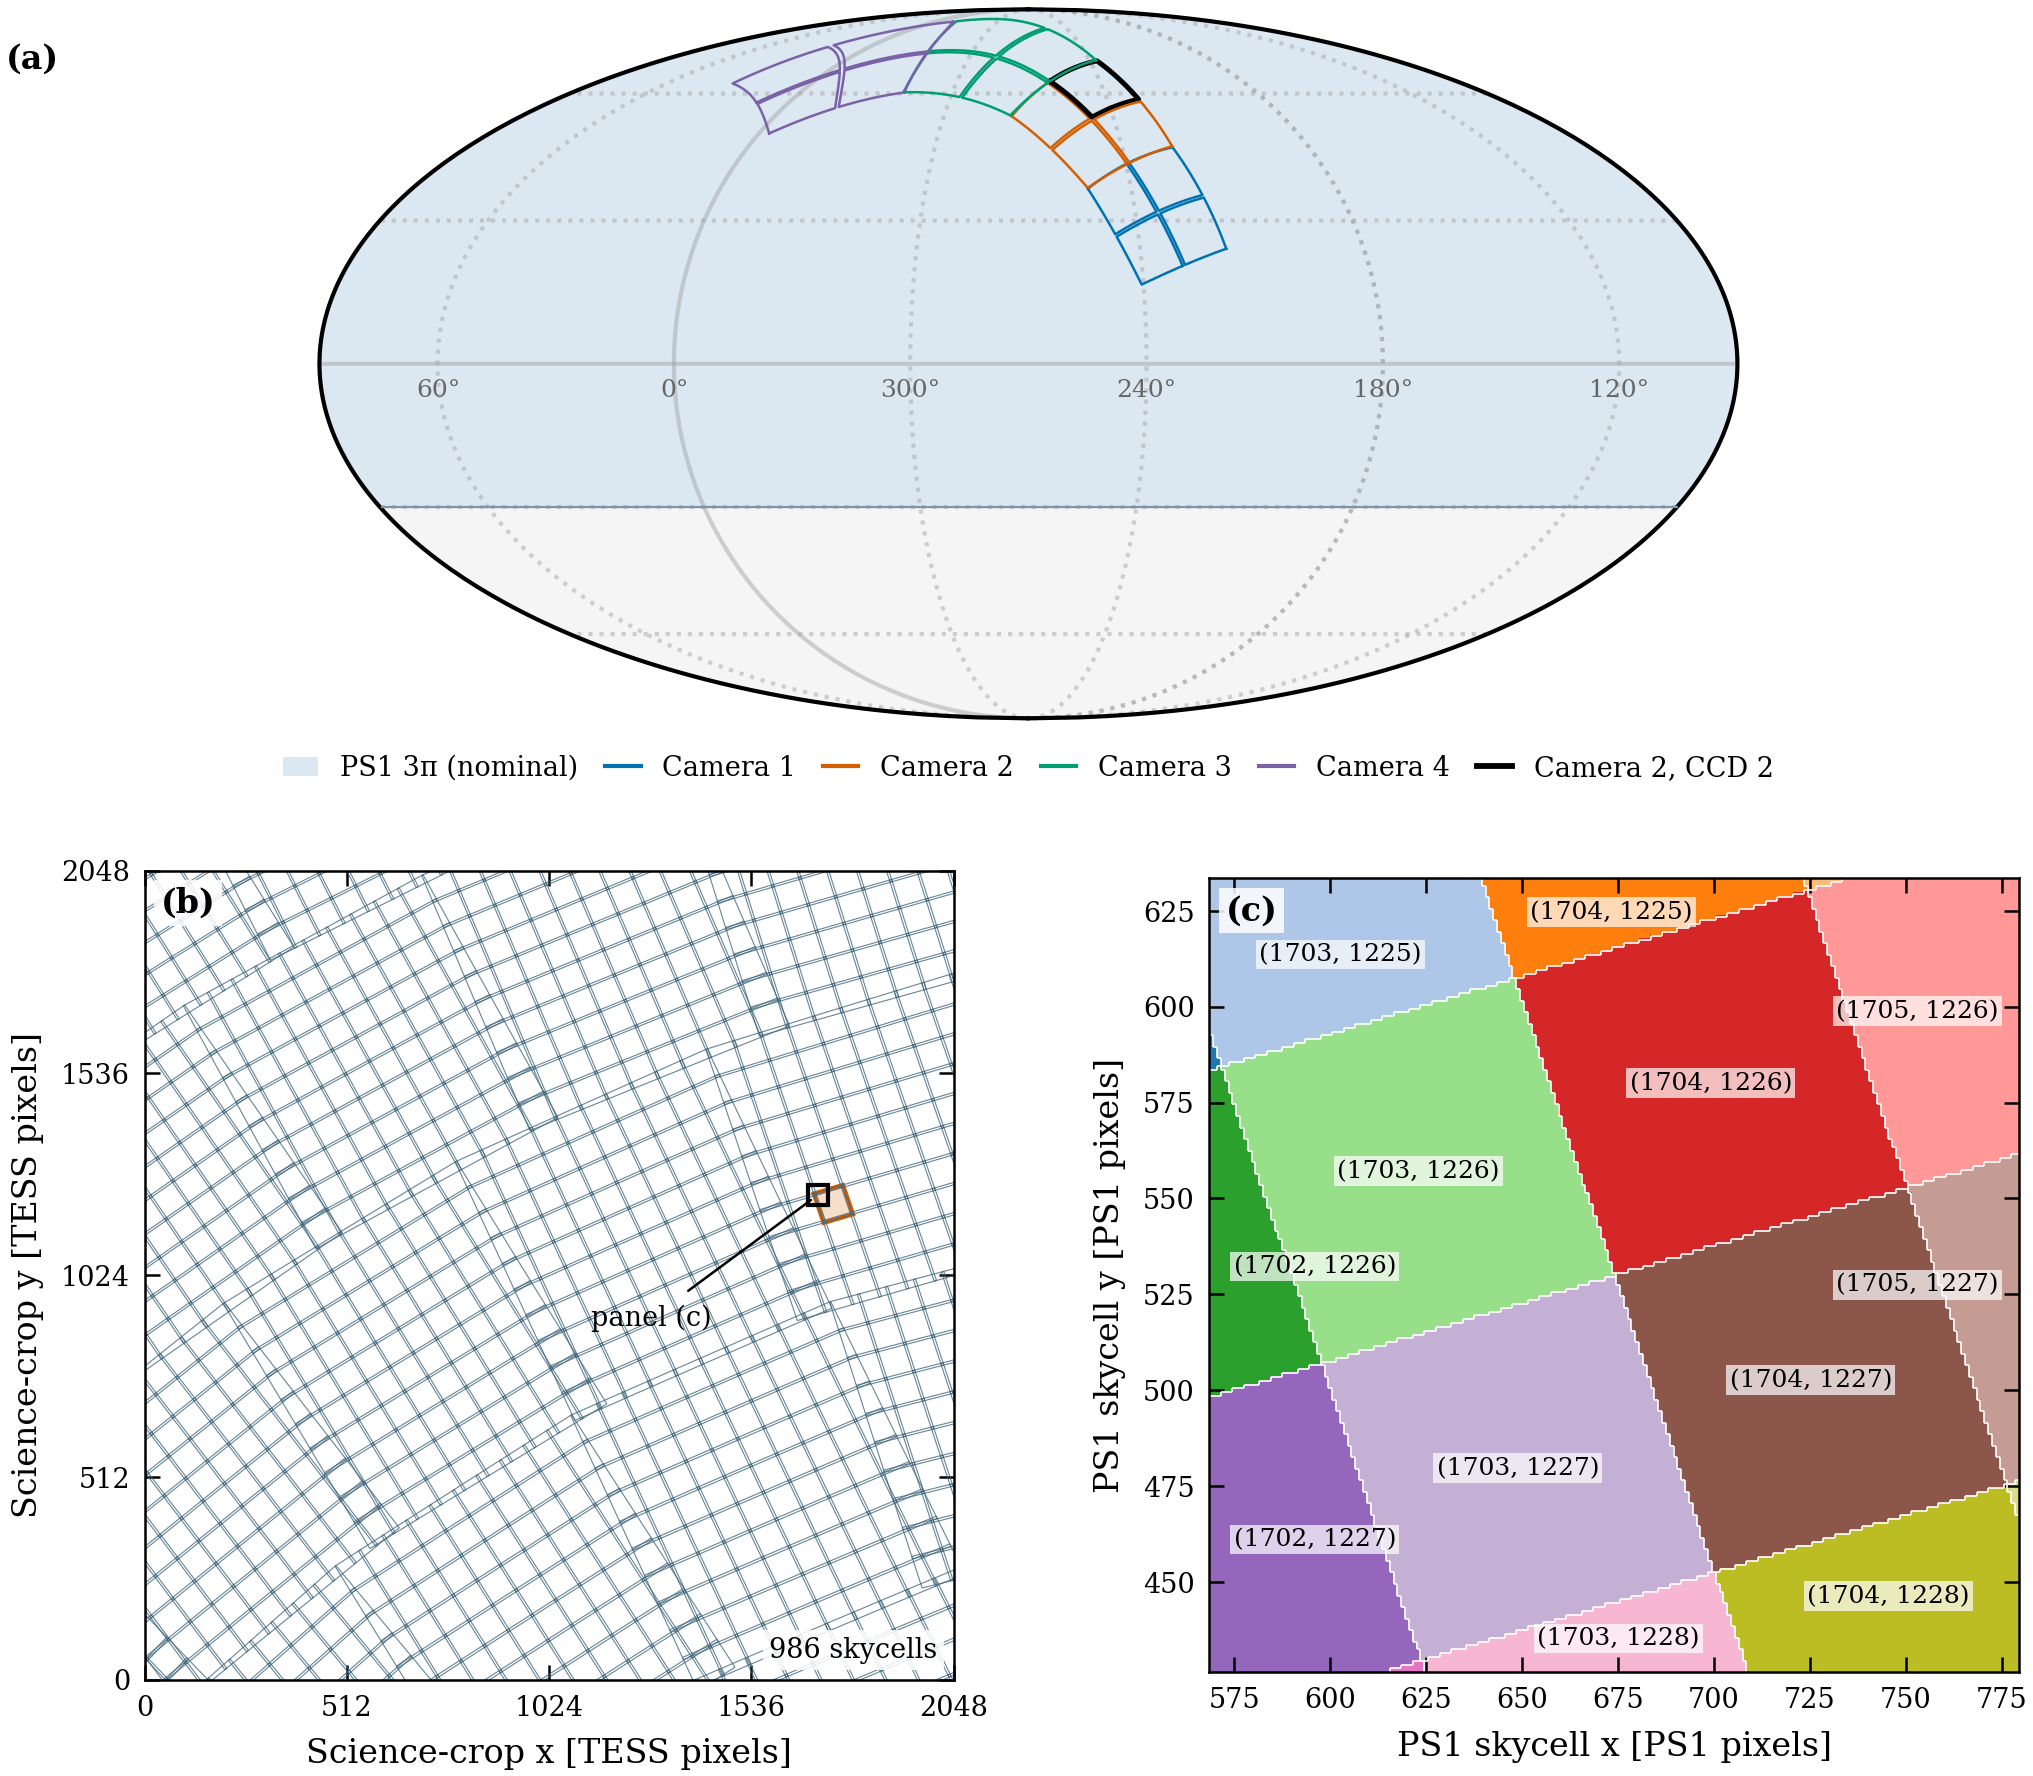
- Each owned TESS pixel's corners are transformed through both WCS solutions, and the enclosed PS1 pixel centres receive its index. The inverse map is stored. A map value of $-1$ means no assignment in that skycell, not necessarily a gap in TESS coverage.
- PS1 values are converted to counts s$^{-1}$ and flux-per-pixel and pixel-area conventions are tracked. The nominal survey footprint is distinguished from valid observed pixels.
(a) Nominal PS1 3π footprint with the Sector 24 camera and CCD outlines; the black outline is camera 2, CCD 2. (b) The 986 skycells that overlap that CCD's 2048×2048-pixel science crop; the orange skycell supplies panel (c). (c) A 211×207 PS1-pixel cutout of that skycell (43,677 pixels, all assigned), each pixel coloured by the TESS pixel it falls in. The PS1 pixel scale is 0.25 arcsec and the TESS pixel scale is 21 arcsec.
2.2 Band synthesis
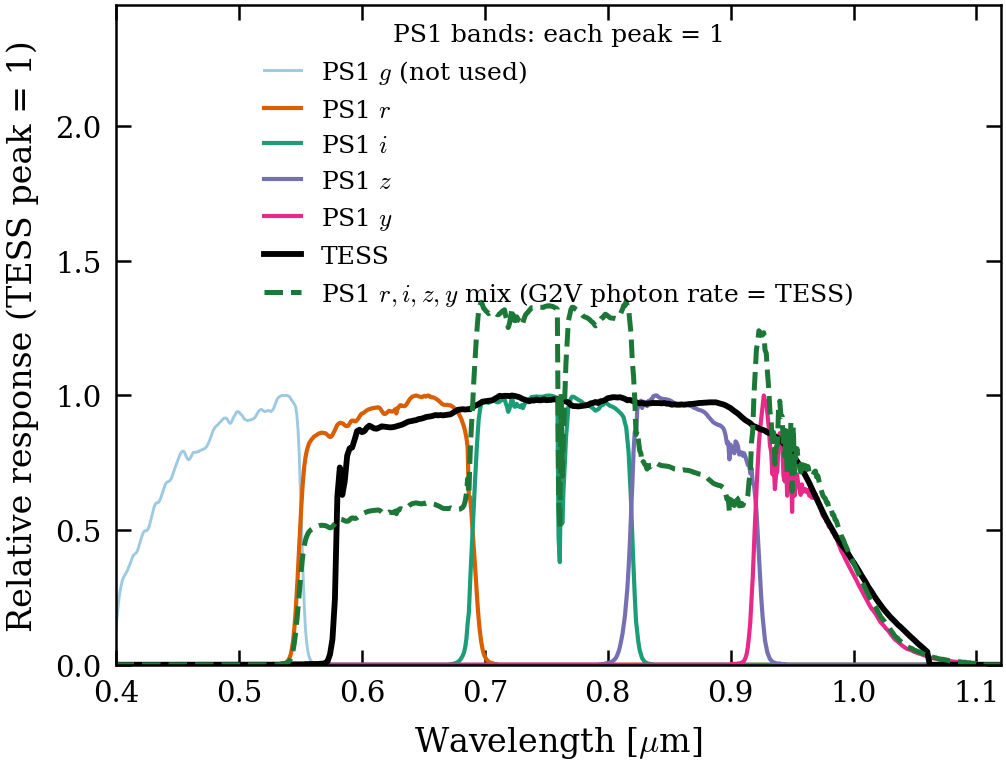
The four PS1 bands are added with fixed weights into one TESS-like image per skycell, $$C_0=\sum_{b\in\{r,i,z,y\}} w_b F_b,\qquad (w_r,w_i,w_z,w_y)=(0.254,\,0.4368,\,0.1654,\,0.1438),$$ where $F_b$ is the PS1 band-$b$ image (counts s$^{-1}$ per pixel) and $w_b$ are dimensionless weights fitted so that the mix reproduces the TESS count rate predicted from Gaia XP spectra. The mix matches TESS only after integration over smooth stellar spectra, not wavelength by wavelength. Residual synthesis errors are listed in Appendix C.
PS1 $r,i,z,y$ response curves (unit peak, including 1.2 airmasses), PS1 $g$ (unused), the TESS response (version 2.0) and the weighted mix (dashed), scaled to the same G2V photon count. The mix is 0.65 of TESS at 600–672 nm, 1.33 at 717–800 nm and 0.65 at 900–910 nm. It is a linear combination of the four PS1 curves, as checked against the stored weights.
2.3 Source removal
- On the combined image only, we keep the pixels of detected sources and set the PS1 sky to zero, because sky left in would spread under smoothing and rebinning. Invalid chip-gap coverage is treated separately.
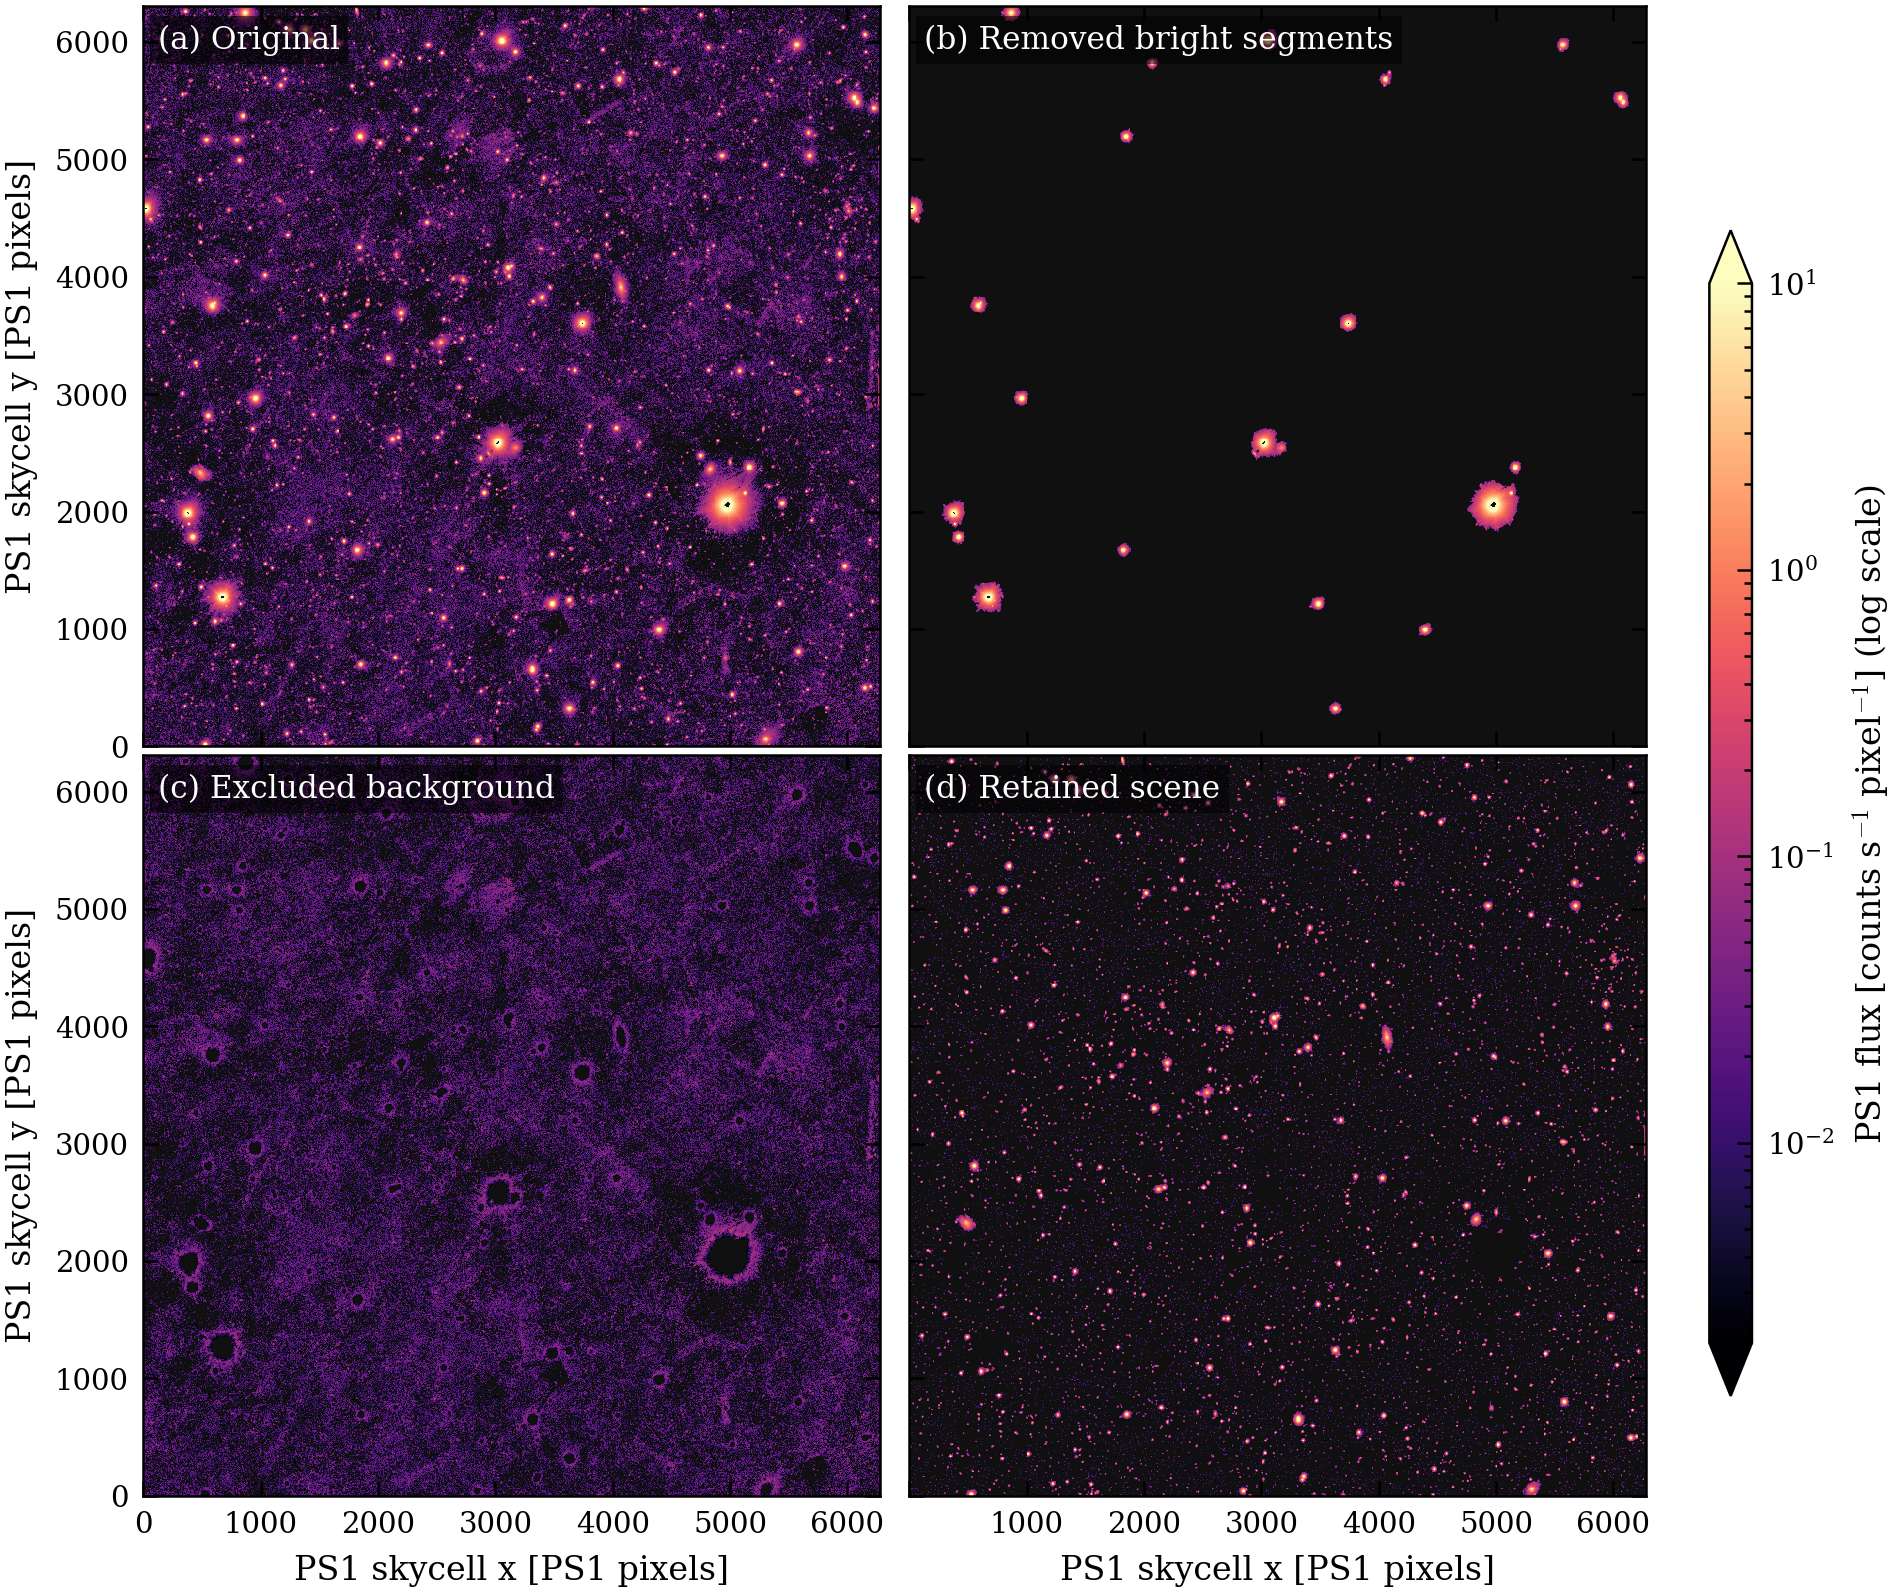
- The whole footprint of every saturated or $T<13$ star is blanked, so that these stars stay in the TESS image and can be fitted.
- On valid pixels, original = removed sources + excluded PS1 background + retained scene.
Skycell 2436.091 (6283×6302 pixels, shown as 8×8 means) with the adopted band weights: (a) the original combination, (b) the bright-source segments removed from the template, (c) pixels excluded as background, (d) the retained scene that becomes the template. The four images sum to the original in every valid pixel, on one logarithmic scale. Against the previous weights the retained flux changes by −1.74 %.
2.4 Smoothing, seams and sampling
- Each weighted band is multiplied by the keep mask and smoothed with one Gaussian ($\sigma=40$ PS1 pixels, 10.3 arcsec), across skycell boundaries with seam corrections, so the single-skycell edge never shows.
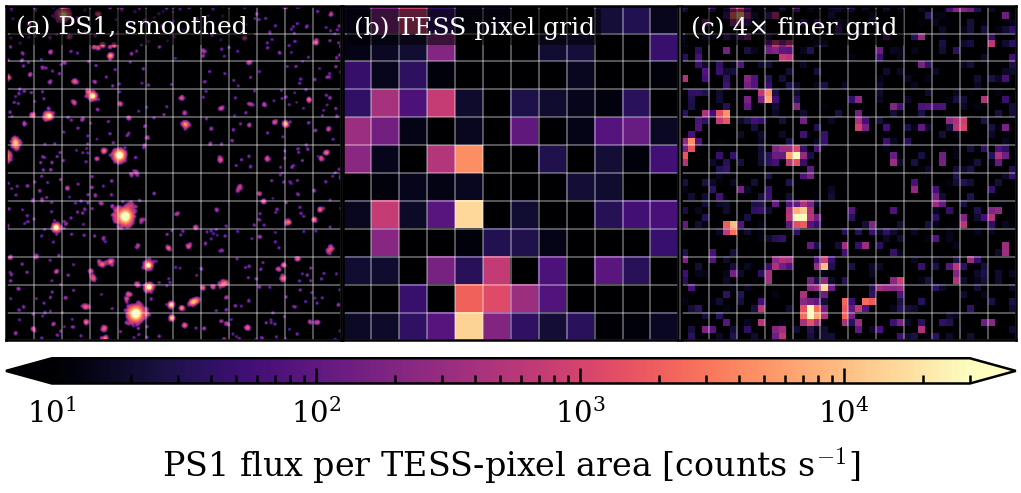
- Each smoothed band is binned onto the TESS grid through the mapping, on a grid four times finer than the TESS pixel and at native sampling. The $4\times4$ block sum of the fine grid reproduces the native grid to $10^{-15}$.
- The band templates $T_b$ are summed with their weights already included into $T=\sum_b T_b$.
One smoothed PS1 scene (a 1008×1008-pixel cutout, smoothed with $\sigma=2.5$ PS1 pixels for display) at (a) PS1 resolution, (b) integrated onto the TESS pixel grid and (c) integrated onto a grid four times finer. All panels show surface brightness per TESS-pixel area, so cells of different size compare directly; white lines mark TESS pixel boundaries. The block sum of (c) reproduces (b) to a relative $8\times10^{-16}$.
2.5 Photometric calibration of the band templates
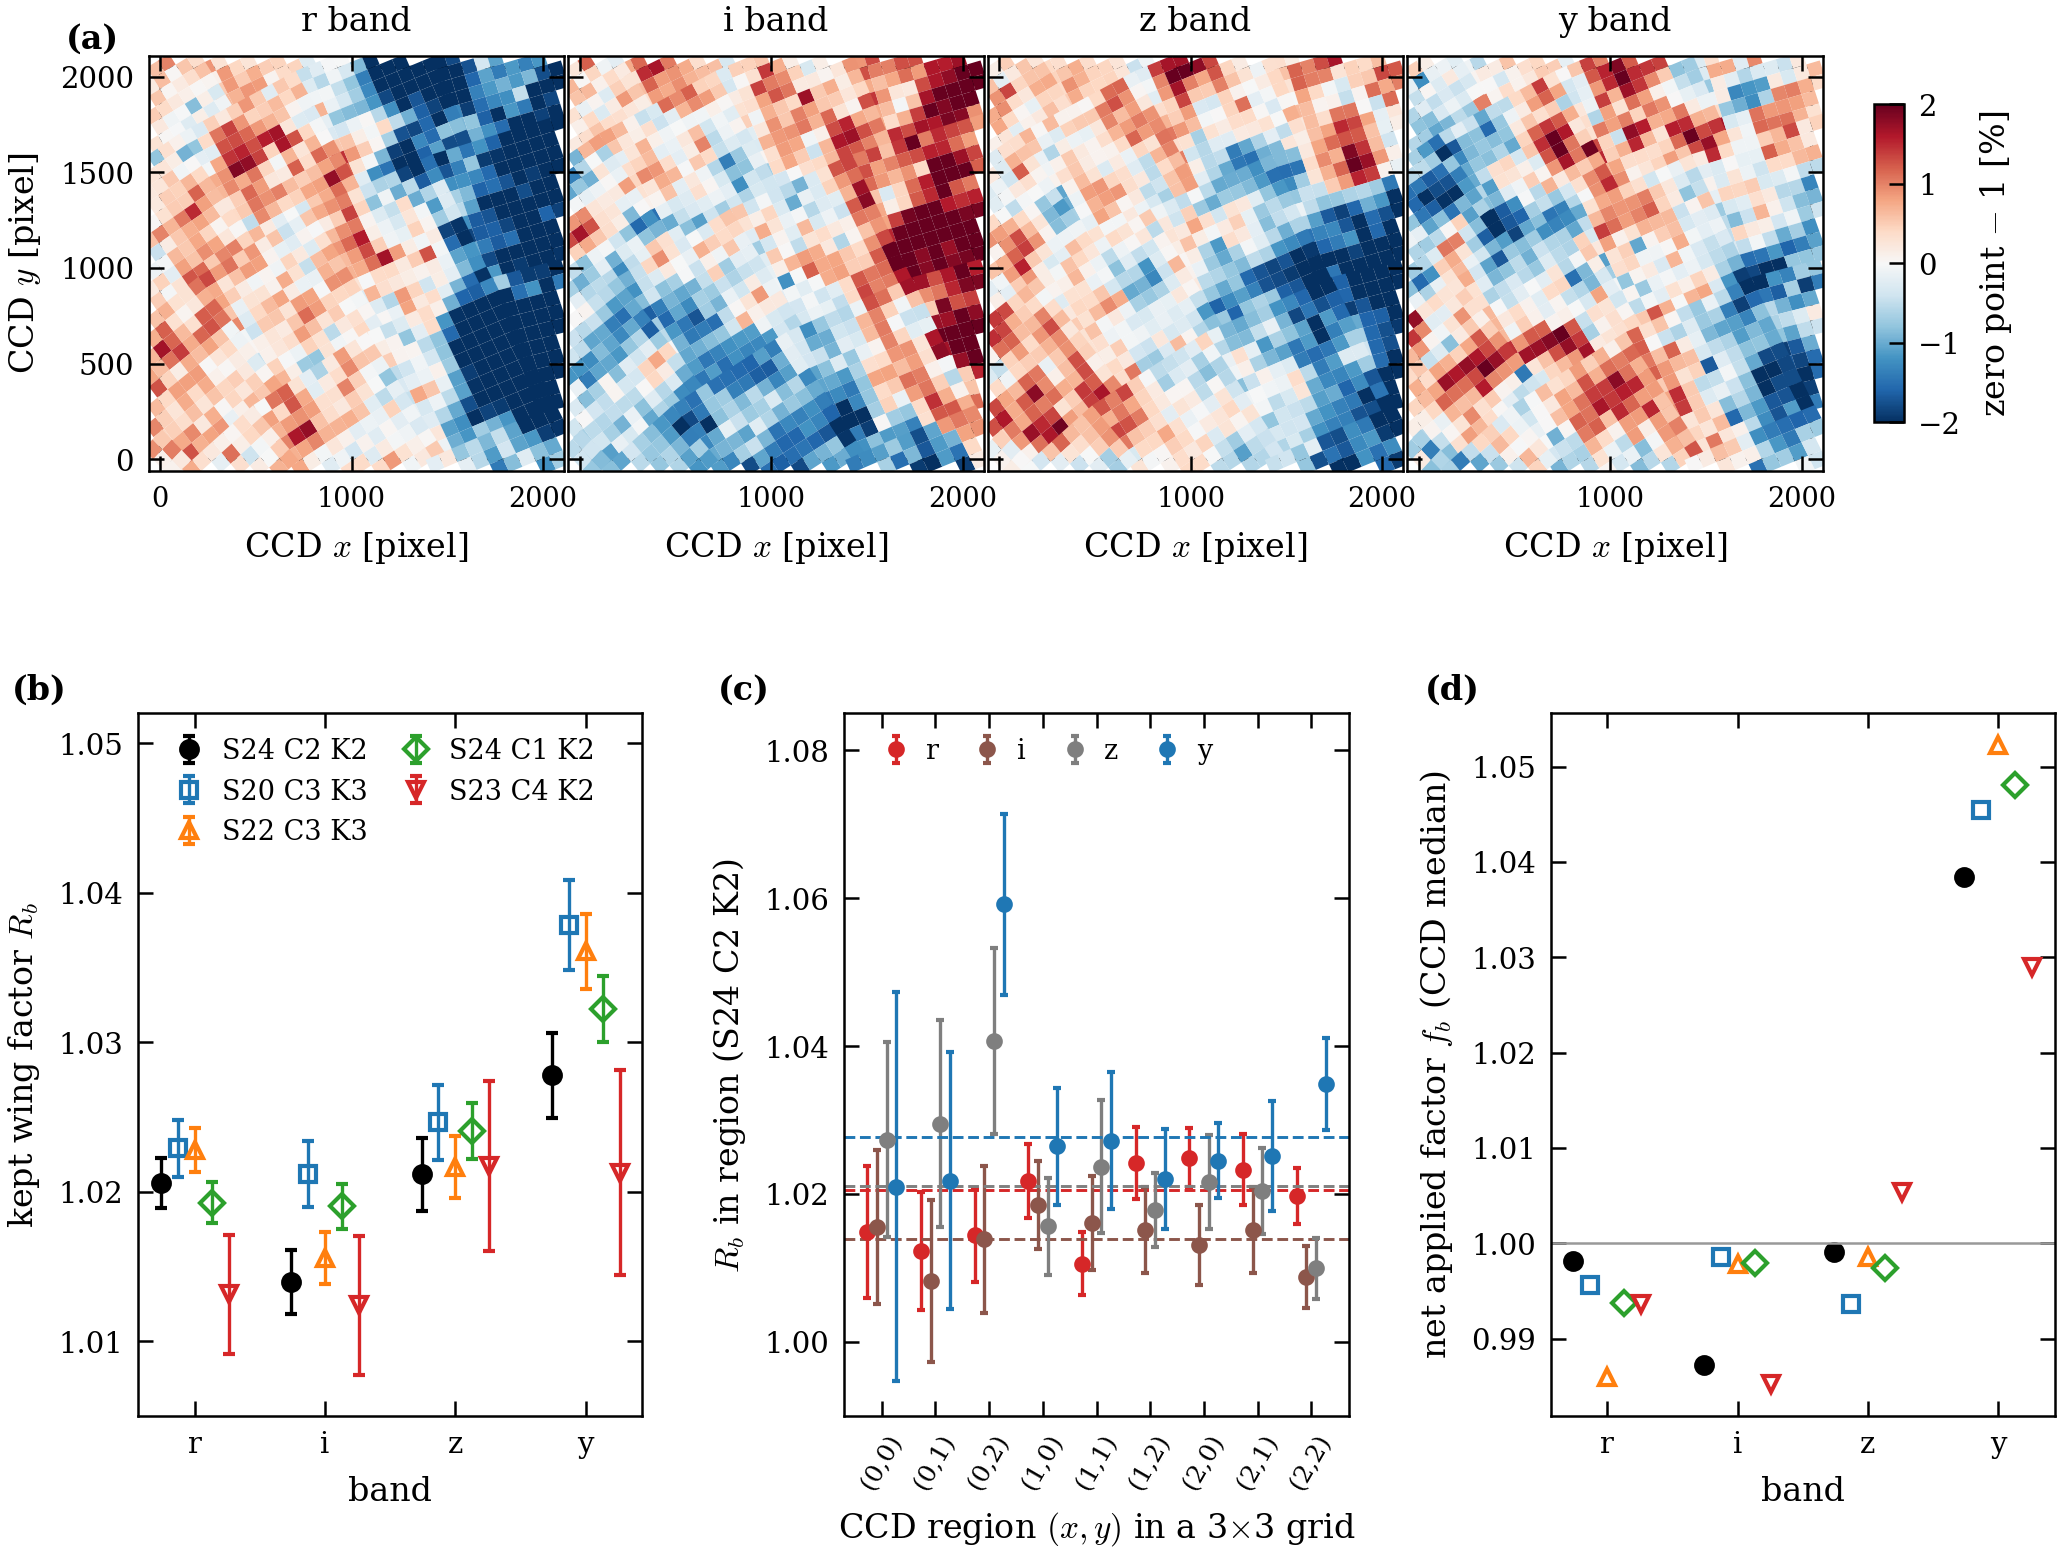
The PS1 stack images carry a per-skycell flux-scale error of 0.6–1.7 % per band, coherent over tens of skycells, and the template keeps a small fraction of each star's wing light beyond its segment that catalogue PSF magnitudes do not include. We rescale each band of each skycell by a factor measured on isolated stars. For skycell $s$ and band $b\in\{r,i,z,y\}$, $$\rho_{k,b}=\frac{F^{\rm seg}_{k,b}}{F^{\rm ref}_{k,b}},\qquad M_{s,b}=\operatorname*{med}_{k\in s}\rho_{k,b},$$ where $F^{\rm seg}_{k,b}$ is the flux of star $k$ summed over its own segment in the band template before smoothing (counts s$^{-1}$), and $F^{\rm ref}_{k,b}=10^{-0.4(m_{k,b}-25)}$ is its reference flux from the PS1 DR2 mean PSF magnitude $m_{k,b}$. Stars are isolated Gaia sources with $15\le G\le17.5$ and $0.3\lt G_{\rm BP}-G_{\rm RP}\lt 3.2$, about 50 per skycell. Each $M_{s,b}$ is shrunk toward the median of its neighbouring skycells by the ratio of the intrinsic variance $\tau^2$ (estimated from two independent halves of the star sample) to the total variance, giving $\hat M_{s,b}$; this changes individual skycells by less than 0.3 %.
The kept wing fraction is one number per band and CCD, $$R_b=\operatorname*{med}_{k}\frac{S_{k,b}}{F^{\rm ref}_{k,b}\,\hat M_{s(k),b}},$$ where $S_{k,b}$ is the star's flux within 42 arcsec in the smoothed band template minus the local annulus level (84–126 arcsec), measured on template stars with $13.6\le T<15.5$. Here the reference flux is the Gaia $(G,\,G_{\rm BP}-G_{\rm RP})\rightarrow$ PS1 transform, which has twice as many template stars as the PS1 catalogue: the per-skycell structure comes from PS1 and the per-band level from Gaia. We find $R_b=1.012$–$1.025$ for $r,i,z$ and $1.021$–$1.038$ for $y$, uniform across each CCD within noise.
Each band template is rebuilt as $T'_b=\sum_s C_{s,b}/f_{s,b}$ with $f_{s,b}=\hat M_{s,b}R_b/g$, where $C_{s,b}$ is skycell $s$'s contribution to band $b$ and $g$ is the median of $\hat M R$ over skycells and bands, so the overall scale of each field is unchanged. The net per-CCD effect is a factor $1.029$–$1.052$ in $y$ and $0.985$–$1.005$ in $r,i,z$. The calibration brings the template band ratios to within 0.5 % of the Gaia-XP colours and removes the $y$ excess at every colour. It is applied to the per-band templates of the final de-crowded image and to their sum in the final Hotpants comparison. The preliminary image keeps the uncalibrated template: it enters the fit of §4 only through faint neighbours, because stars brighter than $T=13$ are removed from the template. The calibration changes the total template flux of red relative to blue stars by only −0.6 %, so it does not explain the red total-flux deficit of §7. It halves the achromatic dipole of mid-colour stars (from 7–9 to 3–6 mpx).
Numbers marked here come from the hybrid factors and are to be refreshed from the final production run.
(a) Per-skycell zero point of the $r,i,z,y$ templates for S24 camera 2 CCD 2, relative to its CCD median, coherent over tens of skycells with an rms of 0.9–1.2 % per band. (b) Kept wing factor $R_b$ for five CCDs: 1.013–1.025 in $r,i,z$ and 1.021–1.038 in $y$, with 0.14–0.7 % uncertainties. (c) $R_b$ in nine CCD regions of S24 C2 K2; regions agree with one value per CCD (reduced $\chi^2$ 0.3–1.2), the largest deviation (about 2$\sigma$) is common to all bands. (d) Net factor $f_{s,b}$ per band as the CCD median: 0.986–1.005 in $r,i,z$ and 1.029–1.052 in $y$.
Supplement: per-skycell maps for all fields
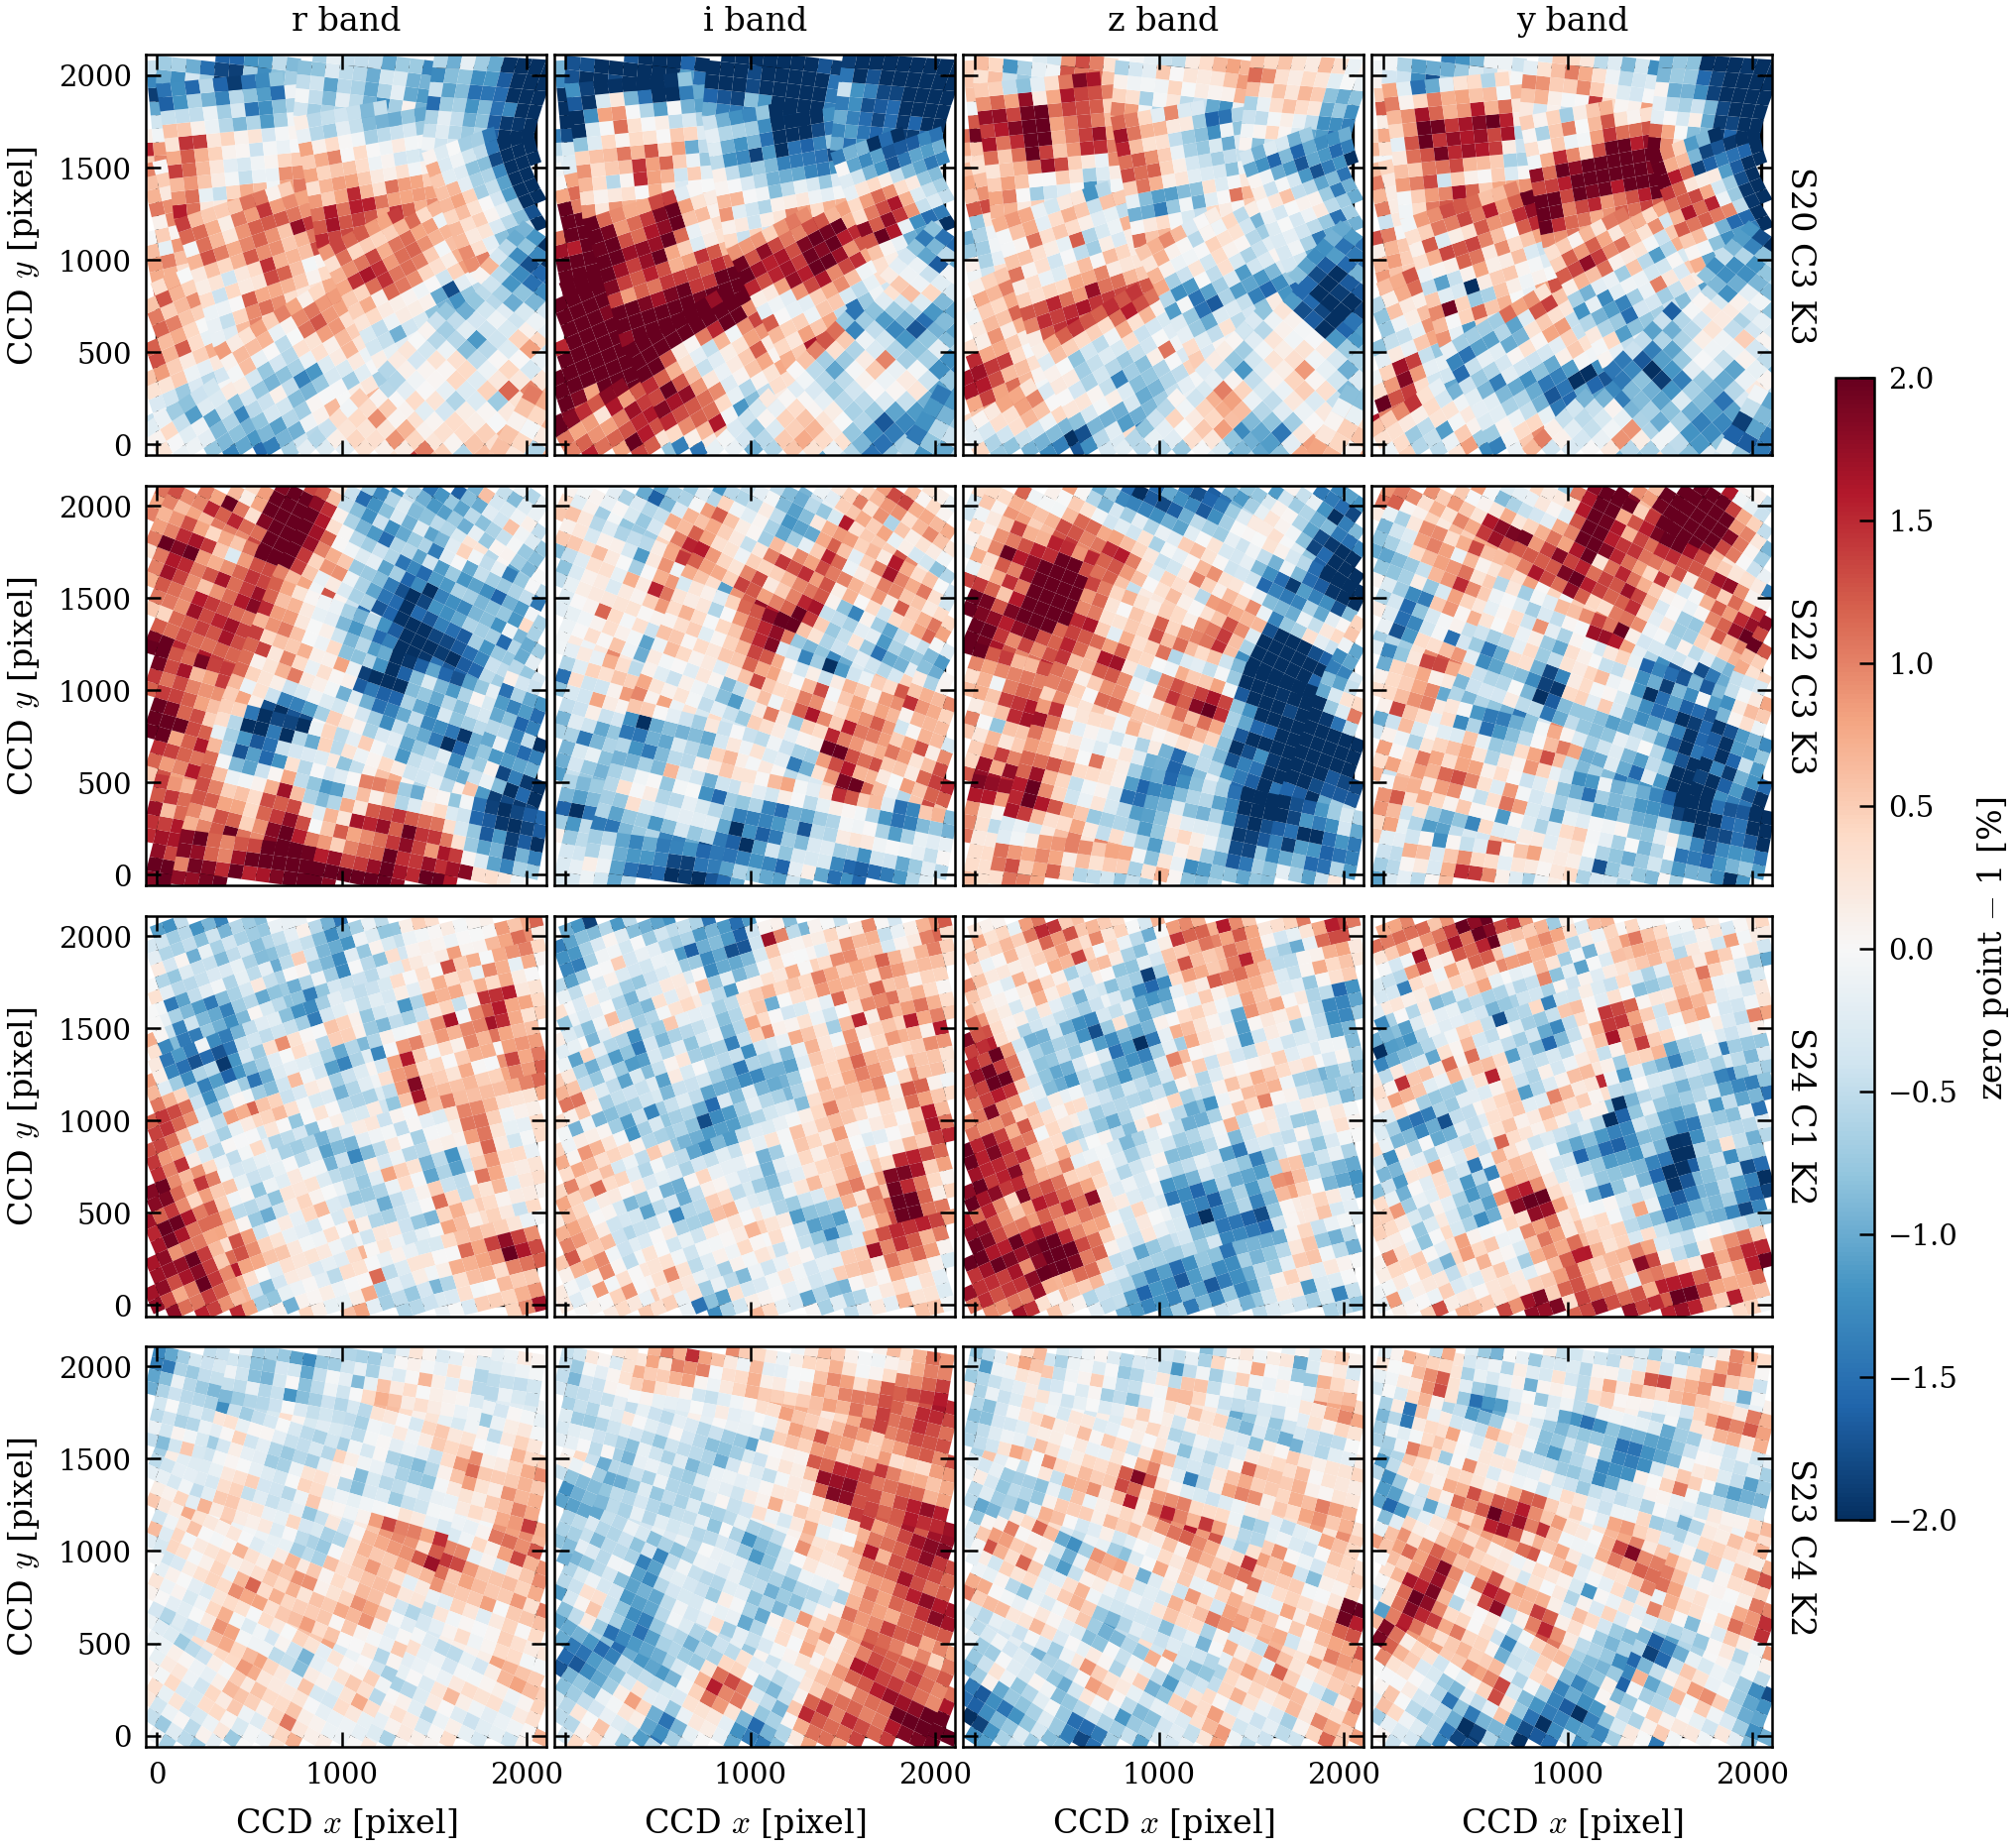
The five fields and the recipe used throughout. The calibration of §2.5 is applied to the final per-band templates only; the fit on the preliminary image (§4, §5) is uncalibrated by design.
Part 1: data
| Image | FFI file | UTC start | Exposure start (TSTART, BTJD) | Camera/CCD | Crop origin (x,y), size | PS1 skycells | Stars fitted (T≤13) | Held-out cores | Colour $u-u_{\rm ref}$ 5-95% | Median image-level background (e-/s) |
|---|---|---|---|---|---|---|---|---|---|---|
| F1: S24 C2 K2 | tess2020120182919-s0024-2-2-0180-s_ffic.fits.fz | 2020-04-29T18:30:52.206 | 1969.2722 | 2/2 | (44,0), 2048x2048 | 986 | 14,733 | 10,536 | -0.31 … +0.49 | 65.6 |
| F2: S20 C3 K3 | tess2020013215923-s0020-3-3-0165-s_ffic.fits.fz | 2020-01-13T22:01:56.377 | 1862.4188 | 3/3 | (44,0), 2048x2048 | 999 | 15,521 | 8,767 | -0.31 … +0.51 | 70.9 |
| S22 C3 K3 | tess2020071012921-s0022-3-3-0174-s_ffic.fits.fz | 2020-03-11T01:31:54.518 | 1919.5646 | 3/3 | (44,0), 2048x2048 | 976 | 12,543 | 8,491 | -0.30 … +0.49 | 72.7 |
| C1: S24 C1 K2 | tess2020118235919-s0024-1-2-0180-s_ffic.fits.fz | 2020-04-28T00:04:03.780 | 1967.5036 | 1/2 | (44,0), 2048x2048 | 944 | 10,984 | 8,224 | -0.31 … +0.53 | 84.5 |
| C4: S23 C4 K2 | tess2020087042920-s0023-4-2-0177-s_ffic.fits.fz | 2020-03-27T04:30:06.872 | 1935.6884 | 4/2 | (44,0), 2048x2048 | 975 | 19,120 | 13,528 | -0.32 … +0.47 | 80.8 |
Part 2: recipe
| Setting | Value |
|---|---|
| Background-estimate template | Template on the TESS-pixel grid (native sampling) |
| Preliminary and final images: template | Template on a grid 4 times finer than TESS pixels |
| Band weights (r,i,z,y) | 0.254, 0.4368, 0.1654, 0.1438 |
| PS1 Gaussian pre-smoothing sigma | 40 PS1 pixels (10.3 arcsec) |
| Bright-star removal limit | T<13 (removed from the PS1 template) |
| PS1 calibration | per-skycell zero point x per-CCD kept-wing factor, applied to the final per-band templates only |
| Background method | Magnitude-sized wing exclusion (30 px at T<6.15 down to 6 px at T<13); harmonic gap fill |
| Preliminary image (Hotpants) | kernel spatial order 4; no background term (background order -1); 3 Gaussians, sigma = 0.752, 1.88, 3.76 px |
| ePSF grid | 6x6 nodes, 4x oversampled, pixel-integrated |
| WCS model | Tangent plane + degree-5 Chebyshev (21 terms per axis, 42 coefficients) |
| Colour model | Radial shift (knots 0, 0.7, 1.5, 3.0, 5.5 px) and coma (knots 0.4, 0.8, 2.2, 5.0 px) basis, tapered to zero at 7 px; 53 coefficients |
| Regularisation | Local-polynomial prior weight $3\times10^{8}$, window 7x7 pixels (orders 4,2,1; radii 3,5); Laplacian weights 0.01 |
| Brightness-width term | None |
| Folds | K=5 spatial folds (128-px tiles, diagonal pattern) |
| Stopping rule | A stage ends when the 50-step mean loss has fallen by less than $10^{-4}$ (relative) over the last 500 steps, the largest star-position change over those steps is below 0.5 mpx and the median relative flux change is below $10^{-4}$ (checked every 100 steps, after at least two learning-rate decays); at most 3000, 20000 and 20000 steps in the three stages |
Note: time is TSTART; the PS1 calibration is applied to the final per-band templates only, and the fit on the preliminary image (Secs. 4-5, Table 3) is uncalibrated by design.
3 Preliminary de-crowded image
3.1 Template match
Hotpants matches the band-combined template to the science frame with a spatially varying kernel, and the matched template is subtracted: $$D_{\rm prel}=(I-B)-K\ast T,\qquad T=\sum_b T_b .$$
- $D_{\rm prel}$: preliminary de-crowded image (native pixels, e$^-$ s$^{-1}$).
- $I$: the FFI (e$^-$ s$^{-1}$); $B$: the image-level background of §3.2.
- $T$: band-combined template on the grid four times finer than the TESS pixel, integrated onto native pixels, with the band weights included (§2.4). It is not calibrated (§2.5).
- $K$: the fitted kernel, which also sets the flux scale. Basis of three Gaussians ($\sigma=0.752,\,1.88,\,3.76$ px) each times a polynomial; spatial order 4; no polynomial background term; stamps built from connected unmasked regions.
Stars brighter than $T=13$ were removed from the template and so remain in $D_{\rm prel}$; they are the stars we fit in §4.
3.2 Image-level background
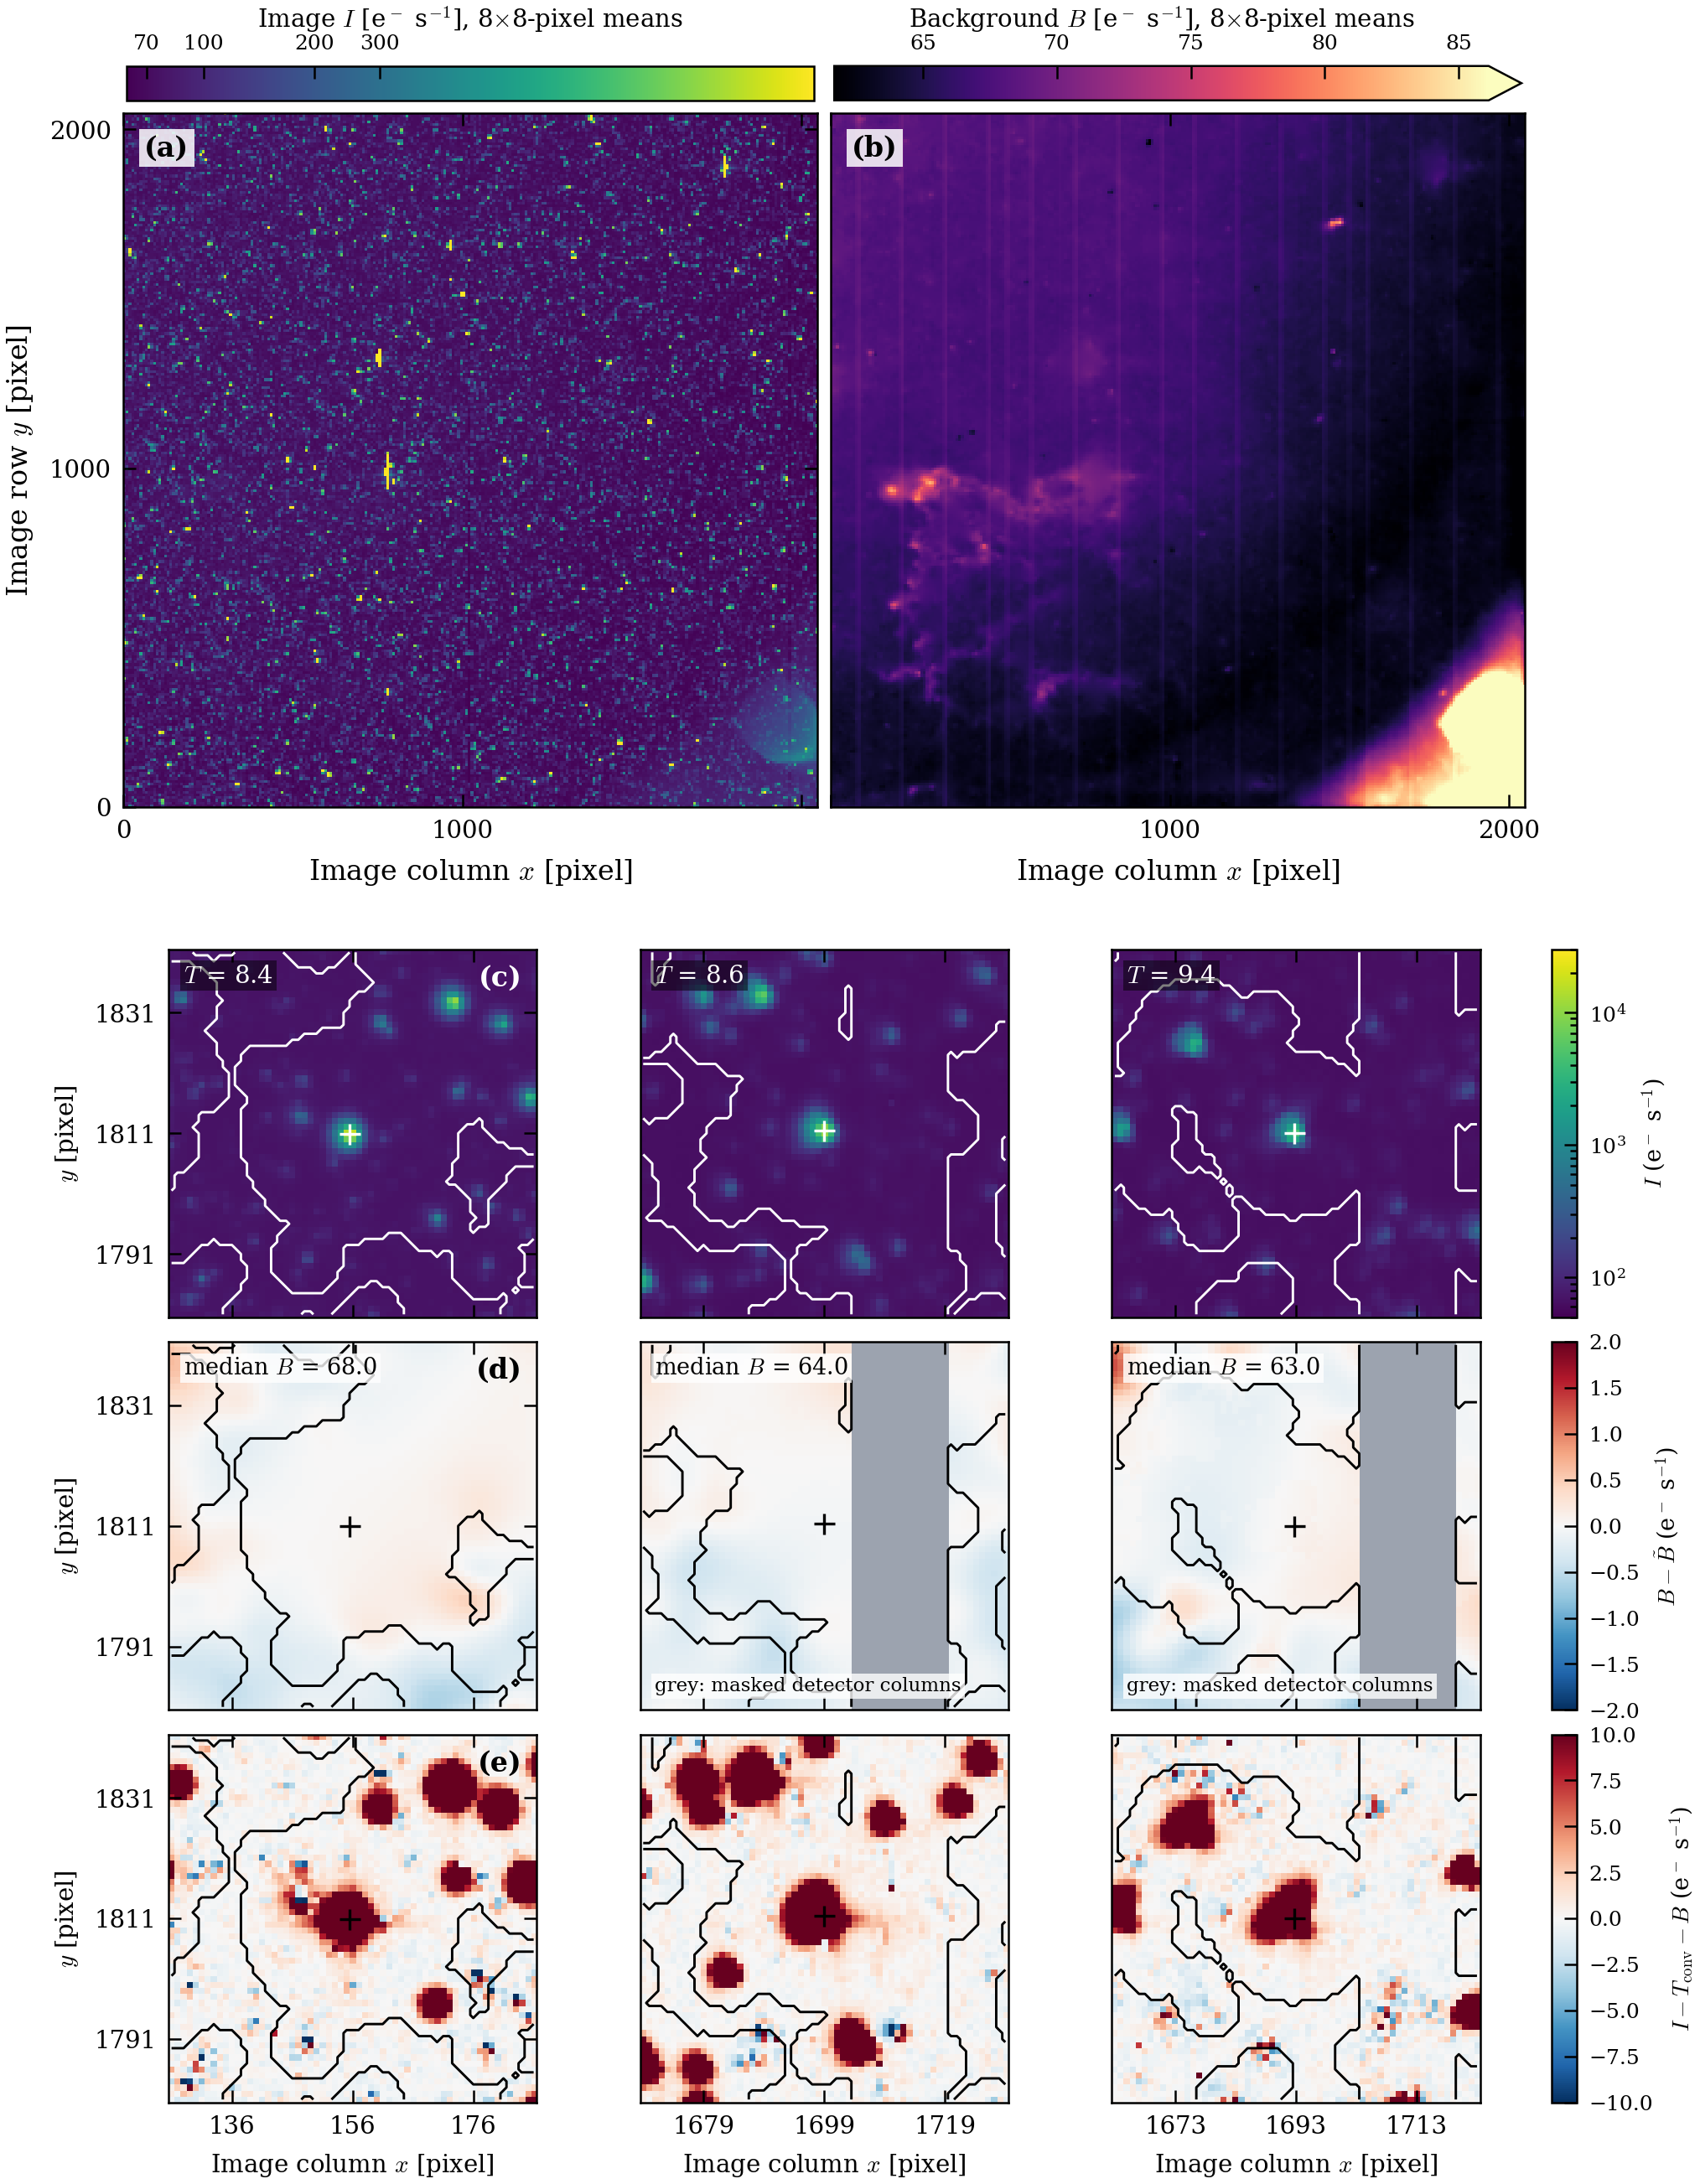
The science frame carries a smooth additive background (scattered light, sky) and the wings of bright stars. We alternate between fitting a kernel and estimating an image-level background $B(x,y)$ on the star-subtracted residual, and subtract $B$ before the final Hotpants run.
- Kernel fit, round 1. Hotpants matches the template $T$ to the science frame $I$ with a kernel $K$ and a third-order polynomial background $b_0(x,y)$: $$I \simeq K\otimes T + b_0 .$$ Only $K\otimes T$ is kept; $K$ is fitted and $b_0$ is discarded. The frame used is the sector's lowest-background exposure.
- Residual and fit pixels. The residual is $D_1=I-K\otimes T$ (e$^-$ s$^{-1}$). Background-fit pixels are those with no mask flag other than the faint-star flag (strap columns, bright-star crosses and saturation, catalogue-star circles, transients and asteroids are excluded), minus magnitude-sized disks centred on every catalogue star with $T_{\rm mag}<13$. The disk radius falls from 30 native pixels at $T_{\rm mag}<6.15$ to 6 pixels at $T_{\rm mag}<13$: it is the radius at which the fitted azimuthal wing of the star falls below $\tau=0.1$ e$^-$ s$^{-1}$ ($\tau$ is a fixed constant). The disks affect only the background fit, never the Hotpants fit.
- Background on the residual. Fit pixels that border a masked region and deviate from their 15 nearest valid neighbours by more than $3\sigma$ (robust MAD) are also dropped. Masked pixels are filled by solving Laplace's equation, $$\nabla^2 B_{\rm fill}=0 \ \ \text{in masked regions},\qquad B_{\rm fill}=D \ \ \text{on the fit pixels},$$ where $D$ is the residual and $B_{\rm fill}$ the filled map (e$^-$ s$^{-1}$). The maximum principle bounds the fill by its rim values, so it cannot overshoot. The map is smoothed with a Gaussian ($\sigma=2$ px, widened by a factor 4 on low, flat residuals), isolated anomalies are repaired against a 16-pixel-box median background, and a per-column quantum-efficiency spline is applied in strap columns. The result is $B_1$.
- Alternate. The kernel is refitted on $I-B_1$ with the Hotpants background switched off, giving $D_2=I-K_2\otimes T$ and $B_2$ by the same estimator. A third kernel fit on $I-B_2$ (background off) gives the final kernel $K$: three kernel fits and two background estimates in all.
- Science-frame background. $K$ is applied to the template and the same estimator gives $$B=\mathcal{E}\left[I-K\otimes T\right],$$ where $\mathcal{E}$ is the estimator of step 3.
- Final Hotpants. Hotpants matches the finer-grid template to $I-B$, integrating it onto native pixels, with kernel spatial order 4, no polynomial background, and stamps from connected unmasked regions. The output is $D_{\rm prel}$ of §3.1.
(a) Image $I$ over the full CCD (2048×2048 pixels, 8×8 area means, logarithmic). (b) Background $B$ on the same grid (61.7 to about 85 e$^-$ s$^{-1}$; the lower-right corner reaches 155 from scattered light). (c–e) 61×61-pixel zooms around three isolated stars of $T=8.4$, 8.6 and 9.4: the image, $B$ minus its median (shared scale $\pm2$ e$^-$ s$^{-1}$), and $I-T_{\rm conv}-B$ ($\pm10$). Contours enclose the fit pixels: stars and wings are excluded and $B$ is smooth through them, with no dip or bump at the star positions.
3.3 Before and after
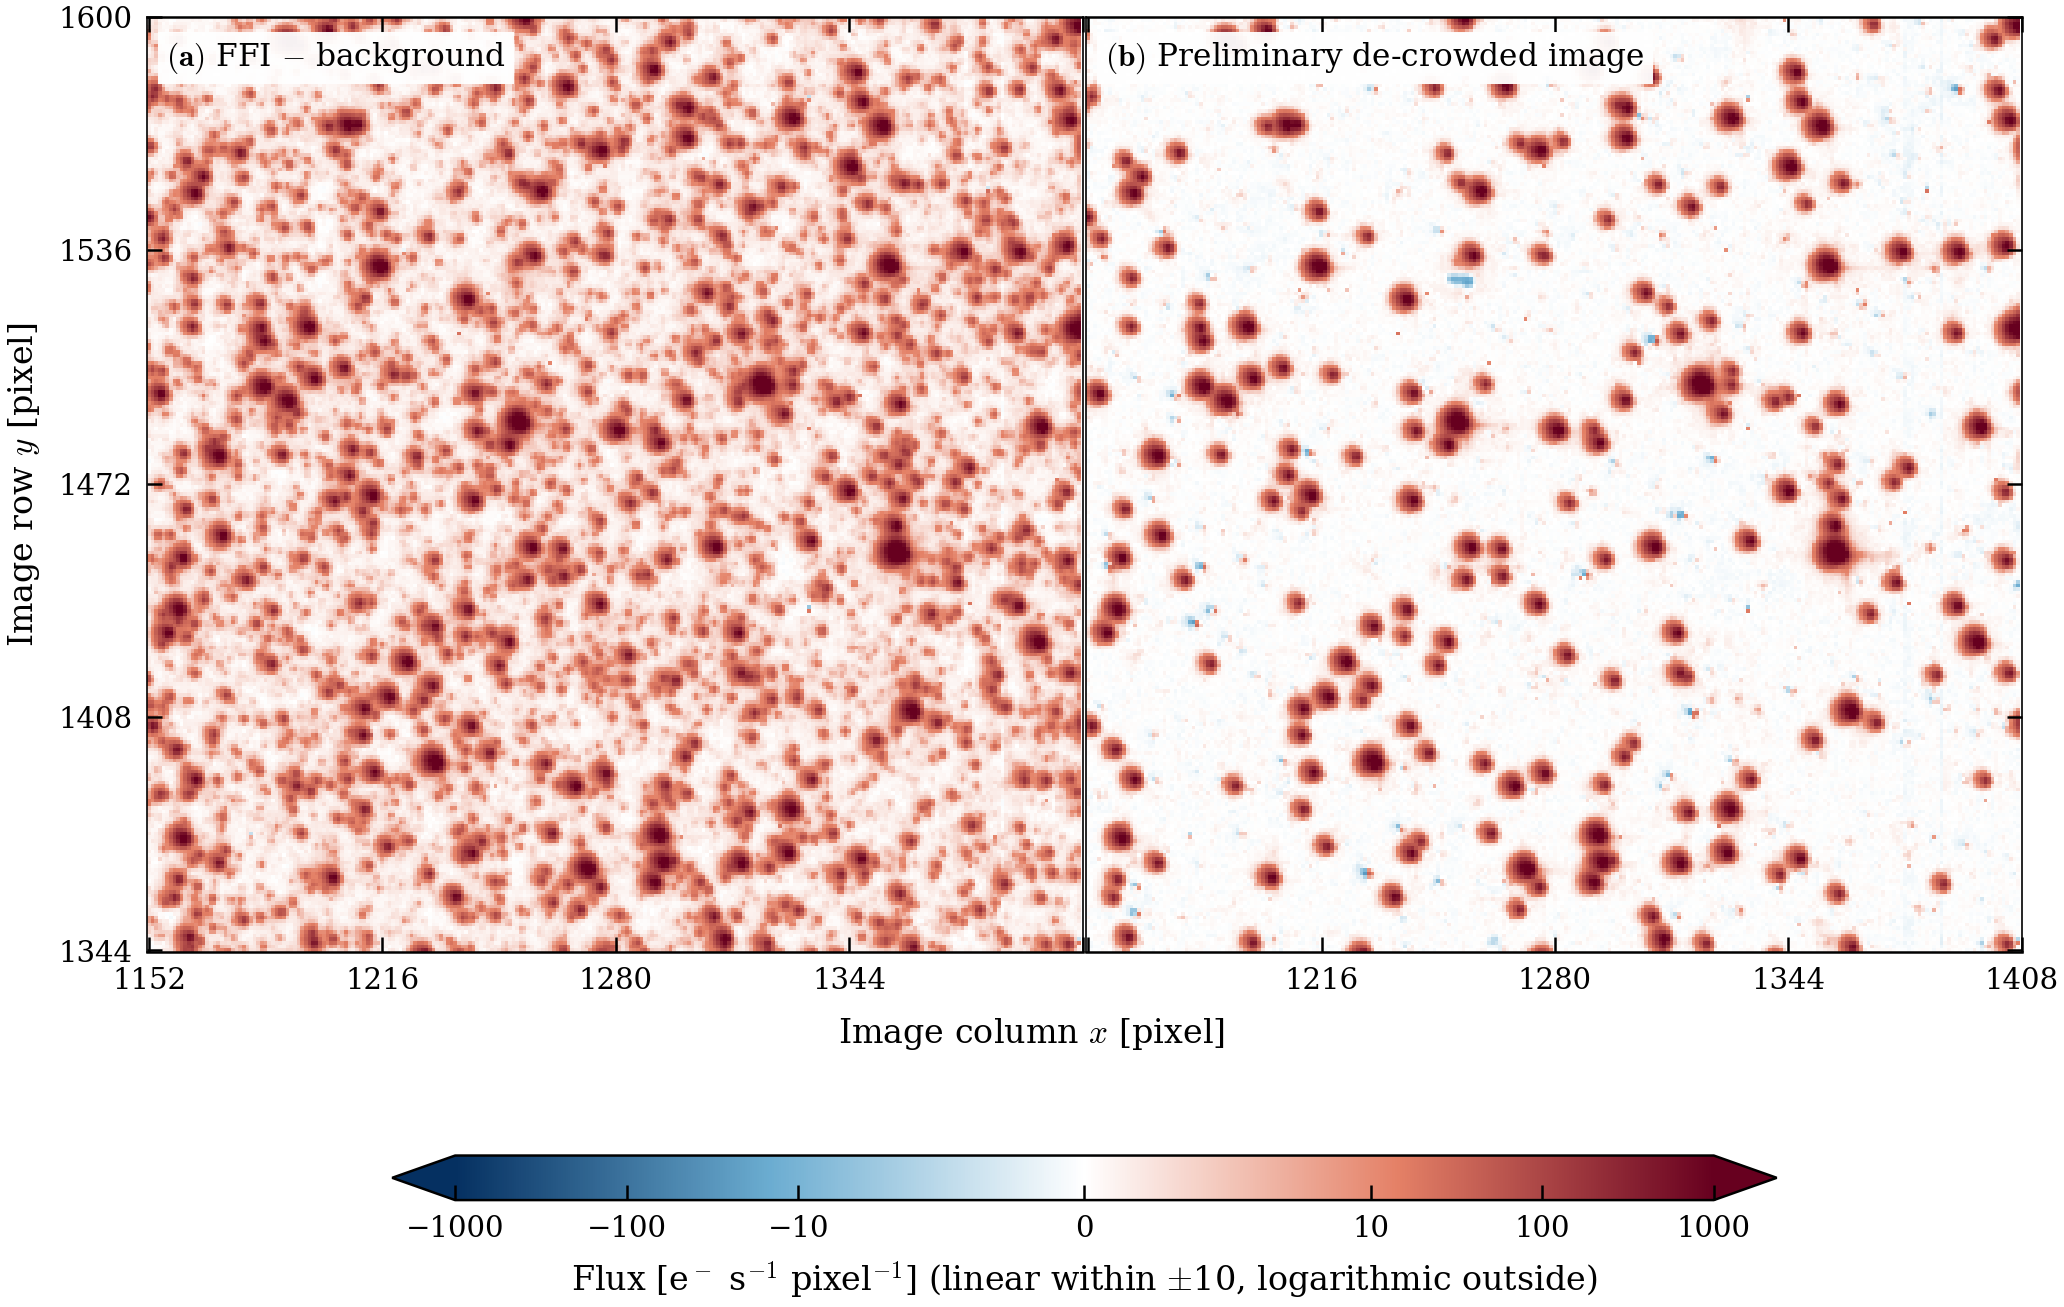
- The background-subtracted FFI and its preliminary de-crowded image are shown at identical coordinates and display limits.
- Reduced crowding motivates the scene fit. A cleaner picture alone does not establish unbiased flux or astrometry; those are tested in §5 and §6.
Single-frame crop (256×256 pixels) of the S24 camera 2 CCD 2 frame. (a) The full-frame image minus the background $B$. (b) The preliminary de-crowded image, on the same colour scale: linear within $\pm10$ e$^-$ s$^{-1}$ per pixel, logarithmic outside, clipped at $\pm10^3$. Stars that were removed ($T\gtrsim13$ in PS1) leave only noise, and the brightest stars, which are not subtracted, remain unchanged.
4 Joint fit (method)
All bright Gaia stars in $D_{\rm prel}$ are fitted together for the WCS, a spatially and colour-dependent ePSF, and fluxes. There is no fitted background.
4.1 Scene likelihood
$$m_p=\sum_i f_i\,R_{ip},\qquad \mathcal L=\sum_{p}\frac{(D_p-m_p)^2}{\sigma_p^2},\qquad \boldsymbol x_i=W\!\left(\boldsymbol s_i(t_{\rm exp});\boldsymbol a\right)+\Delta\boldsymbol x_i(\delta_i,\boldsymbol r_i)$$
- $m_p$: model value of native pixel $p$ (e$^-$ s$^{-1}$); $D_p$ the data in the preliminary image; $\sigma_p$ the pixel noise from the image's noise plane; $\mathcal L$ the weighted squared residual summed over unmasked pixels; the ePSF smoothness prior of §4.4 is added to it.
- $f_i$: flux of star $i$ (e$^-$ s$^{-1}$), solved by linear least squares at fixed shared parameters.
- $R_{ip}$: response of pixel $p$ to star $i$ (§4.3), zero outside the star's finite support.
- $\boldsymbol x_i$: crop-local pixel position; $\boldsymbol s_i(t_{\rm exp})$: Gaia DR3 position propagated to the exposure epoch.
- $W$: reference-colour WCS (§4.2) with fitted coefficients $\boldsymbol a$.
- $\Delta\boldsymbol x_i$: colour-dependent displacement (§4.4), a function of the colour offset $\delta_i$ and detector position $\boldsymbol r_i$.
Stars to $T\le13$ are fitted. Straps are masked, and there is no data-dependent rejection inside the fit.
4.2 WCS and centroid gauge
- The WCS is a tangent plane plus a degree-5 Chebyshev correction (21 terms per axis, 42 coefficients), fitted to Gaia positions propagated to the observation epoch.
- A WCS shift and a shift of the ePSF core centroid are degenerate. The ePSF core centroid is therefore constrained (a gauge condition), and what we report as star-position accuracy is the effective position, the WCS position plus the ePSF centroid.
- The WCS field itself is not an accuracy measurement. Accuracy is measured on held-out stars against Gaia (§6.1).
4.3 Spatial ePSF and rendering
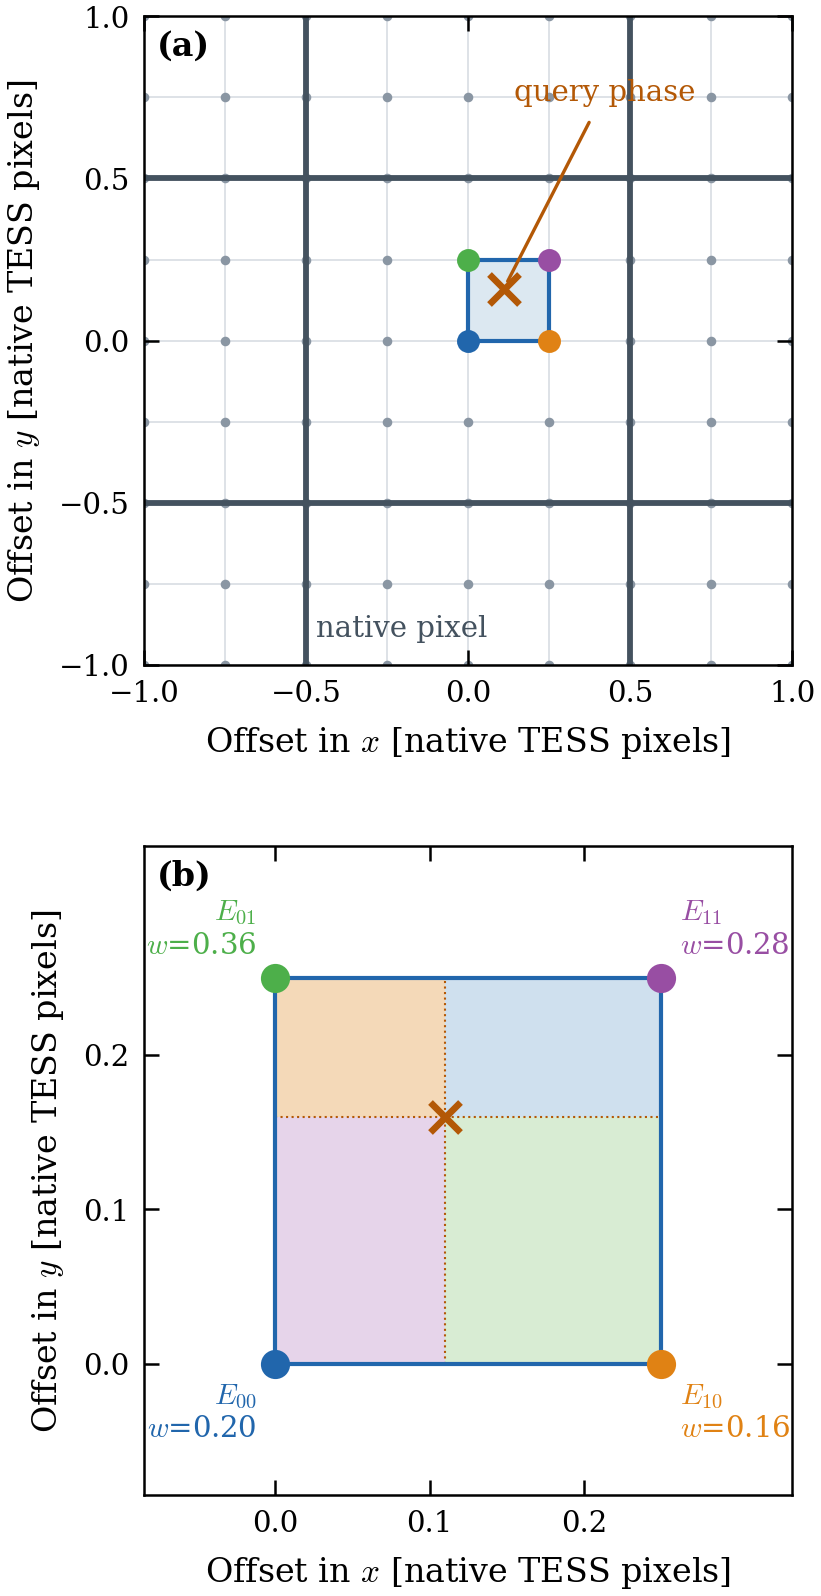
The ePSF is stored on a $6\times6$ grid of nodes across the CCD, sampled at $O=4$ samples per native pixel and already integrated over pixel area. A star's ePSF is the bilinear blend of the four nearest nodes with the colour terms of §4.4 applied. The pixel value is $$\boldsymbol g_{ip}=\boldsymbol c_E+O\,(\boldsymbol x_p-\boldsymbol x_i),\qquad R_{ip}=O^2\,\mathcal{B}\!\left(E_i,\boldsymbol g_{ip}\right).$$
- $\boldsymbol g_{ip}$: position, in ePSF grid samples, at which star $i$'s ePSF is read for pixel $p$; $\boldsymbol c_E$: grid index of the ePSF centre.
- $\boldsymbol x_p$: centre of native pixel $p$; $\boldsymbol x_i$: star position (§4.1), in crop-local pixels.
- $E_i$: the pixel-integrated ePSF at star $i$'s position and colour; $\mathcal B$: bilinear interpolation from the four nearest samples, zero outside the support.
Stellar centres stay continuous: they are never rounded to quarter-pixel phases. There is no second sub-pixel sum, because $E$ already includes pixel integration. The ePSF grid factor $O$ is independent of the template sampling.
Schematic of how one pixel value of a star is rendered from the stored ePSF $E$. (a) Grey dots are the stored samples relative to the star, with native pixel boundaries as thick lines; the cross is one continuous-phase query, between four samples. (b) The four samples and their bilinear weights $w$ (illustrative values); the rendered value is $R_{ip}=O^2\sum_{jk}w_{jk}E_{jk}=16\sum_{jk}w_{jk}E_{jk}$.
4.4 Colour model
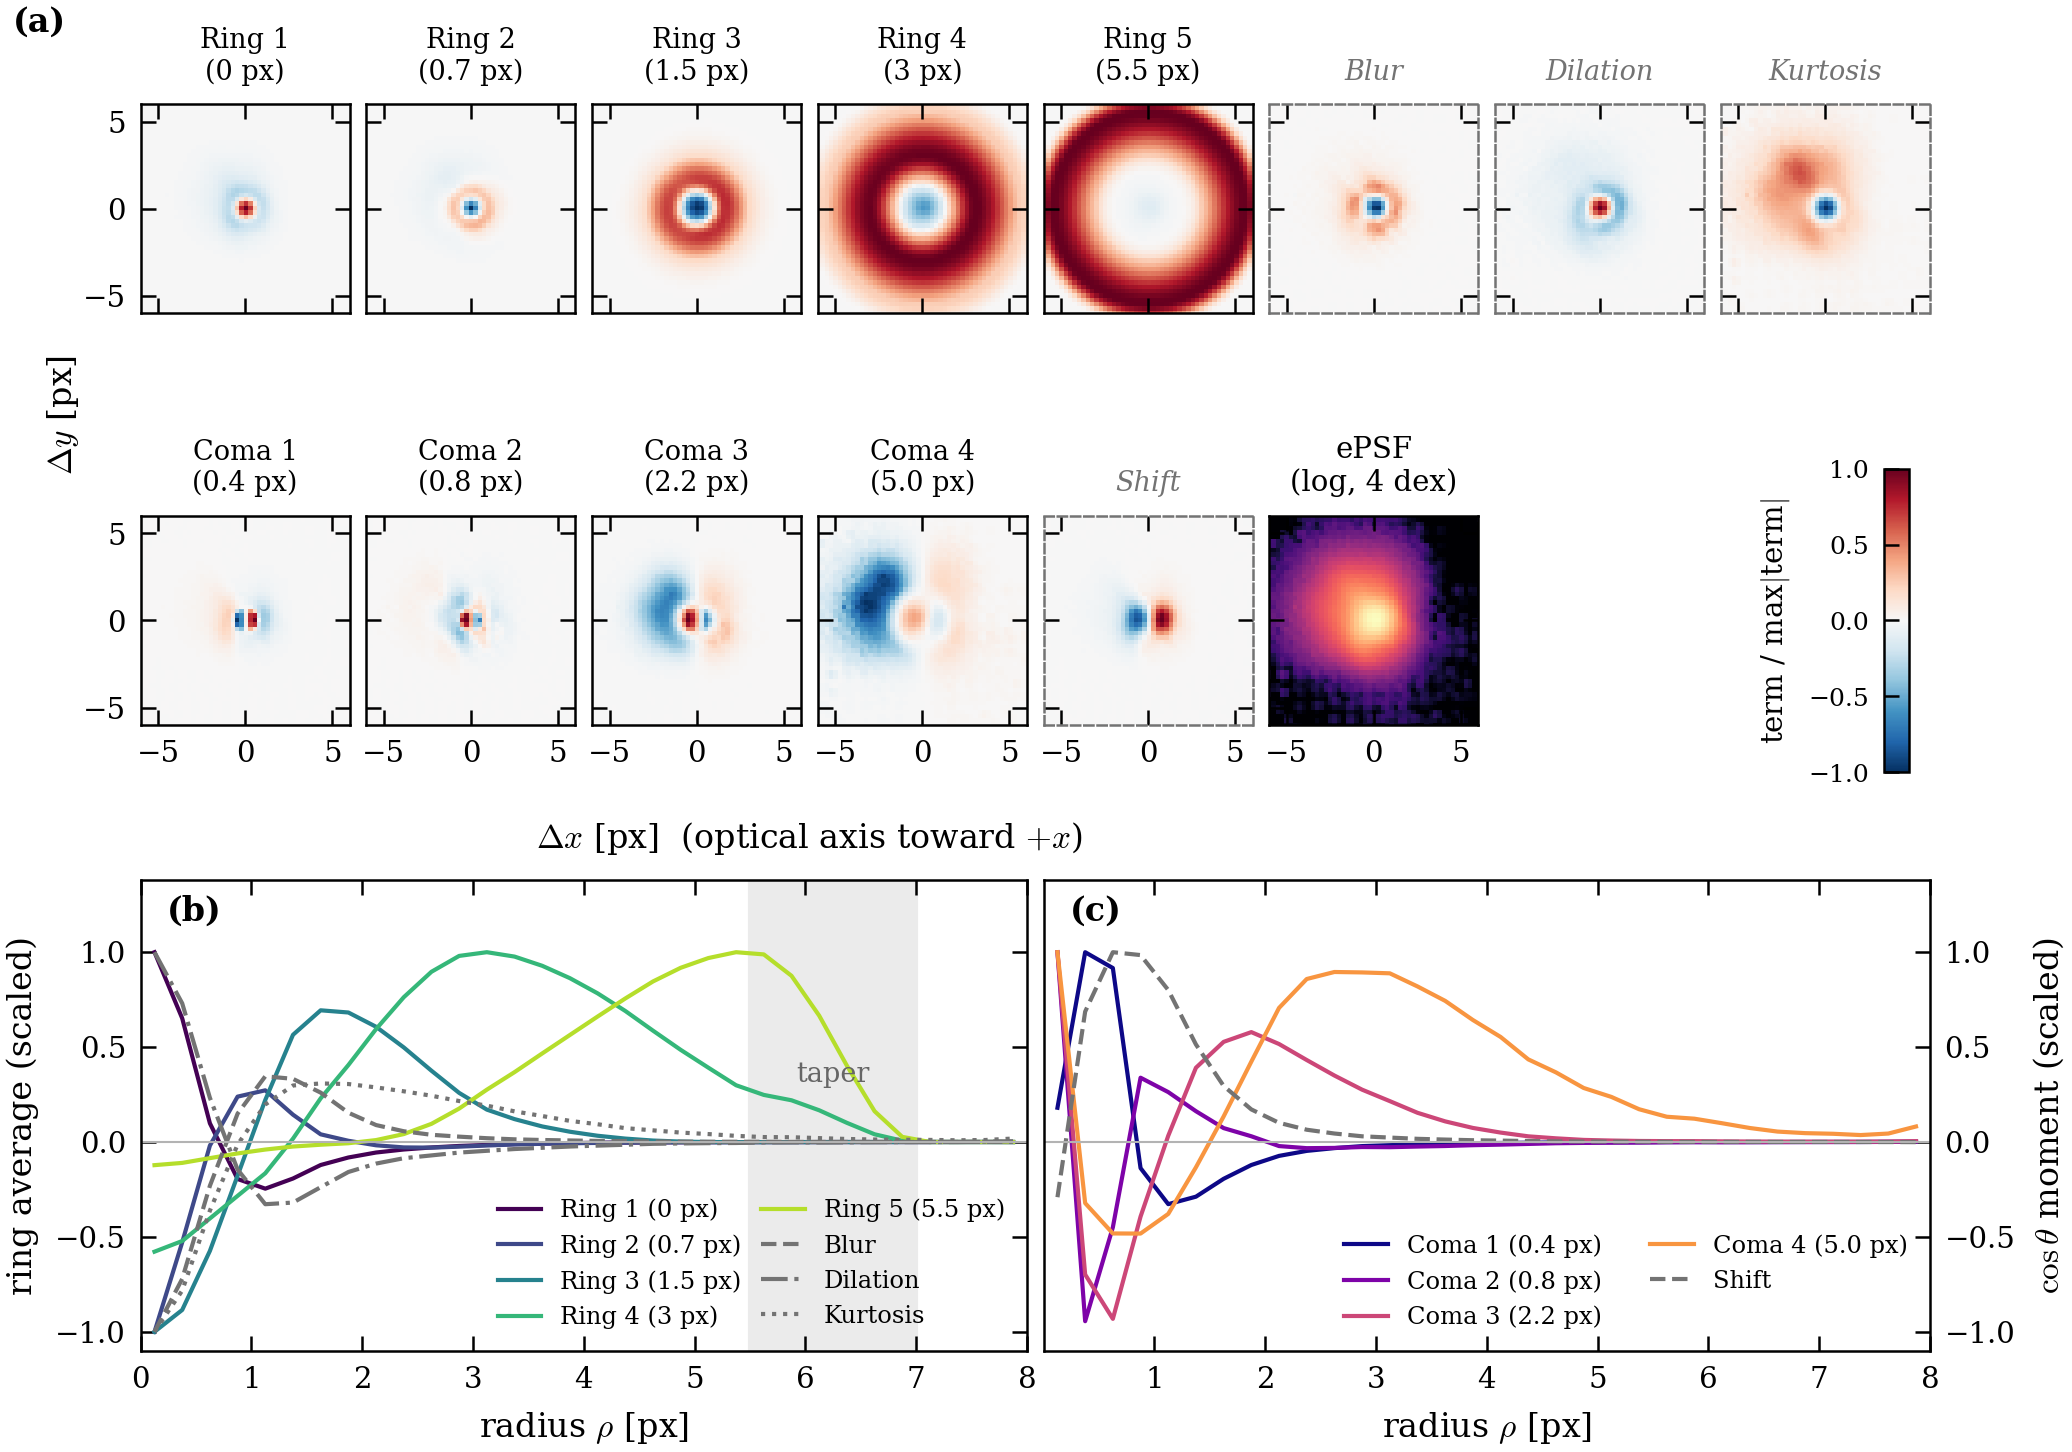
The colour offset is $\delta=u-u_{\rm ref}$, where $u$ is the Gaia XP band-mix colour on the Gaia $G_{\rm BP}-G_{\rm RP}$ scale (the catalogue colour where no XP spectrum exists) and $u_{\rm ref}$ one global reference. The colour-dependent change of the ePSF is a radial shift plus a sum of basis functions: $$P_i(\boldsymbol u)=P_0\!\left(\boldsymbol u-\Delta\boldsymbol x_i\right)+\Delta P_i(\boldsymbol u),\qquad \Delta P=\sum_{j=1}^{5} a_j\,G^{\rm rad}_j+\sum_{k=1}^{4} c_k\left(n_x\,G^{\rm com}_{k,x}+n_y\,G^{\rm com}_{k,y}\right),$$ $$\Delta\boldsymbol x=\delta\,s(r)\,\hat{\boldsymbol n}.$$
- $P_0$: the ePSF at the reference colour (§4.3); $\boldsymbol u$: coordinate on the ePSF grid.
- $\Delta\boldsymbol x$: lateral colour shift of the star's light, along $\hat{\boldsymbol n}=(n_x,n_y)$, the unit vector from the star toward the optical axis; $r$ is the distance to the optical axis (px) and $s(r)$ a fitted smooth function of it (px per unit colour).
- $G^{\rm rad}_j$: five rotationally symmetric ring functions, localised at 0, 0.7, 1.5, 3.0 and 5.5 px from the star centre, tapered to zero at 7 px.
- $G^{\rm com}_{k,x}$, $G^{\rm com}_{k,y}$: four coma-like functions at 0.4, 0.8, 2.2 and 5.0 px; the combination $n_xG_x+n_yG_y$ points them along the axis direction.
- $a_j$, $c_k$: amplitudes, each a fitted law in colour offset $\delta$ and axis distance $r$ (53 fitted coefficients in all). The law reduction is still pending.
The fit is regularised by a local-polynomial prior (weight $3\times10^{8}$, $7\times7$-pixel window) that penalises small-scale departures of the ePSF from a smooth model; its strength is validated on held-out stars. A physical-operator version of the colour model, and why we replaced it, is in Appendix D.
4.5 Brightness
The adopted model has one ePSF for all brightnesses and no brightness term. The brightness dependence is not fitted but measured, from the held-out residuals of the fit (§5.3). A linear peak-charge width term that we tested, and why it is not adopted, is in Appendix E.
4.6 Evaluation design
- Every accuracy we quote is held out: $K=5$ spatial folds (128-pixel tiles in a diagonal pattern); each star is scored with the fit of the four folds that did not contain it. Delivered calibrations use all stars.
- Stopping rule: a stage ends when the 50-step mean loss has fallen by less than $10^{-4}$ (relative) over the last 500 steps, the largest star-position change over those steps is below 0.5 mpx and the median relative flux change is below $10^{-4}$ (checked every 100 steps, after at least two learning-rate decays), or at the step cap (3000, 20000 and 20000 steps in the three stages).
- Baselines are external: the FFI header WCS and Gaia-XP synthetic photometry.
5 Results: the TESS ePSF
Numbers in this section come from fits made before the last background and recipe updates and are marked "to update".
5.1 Spatial dependence
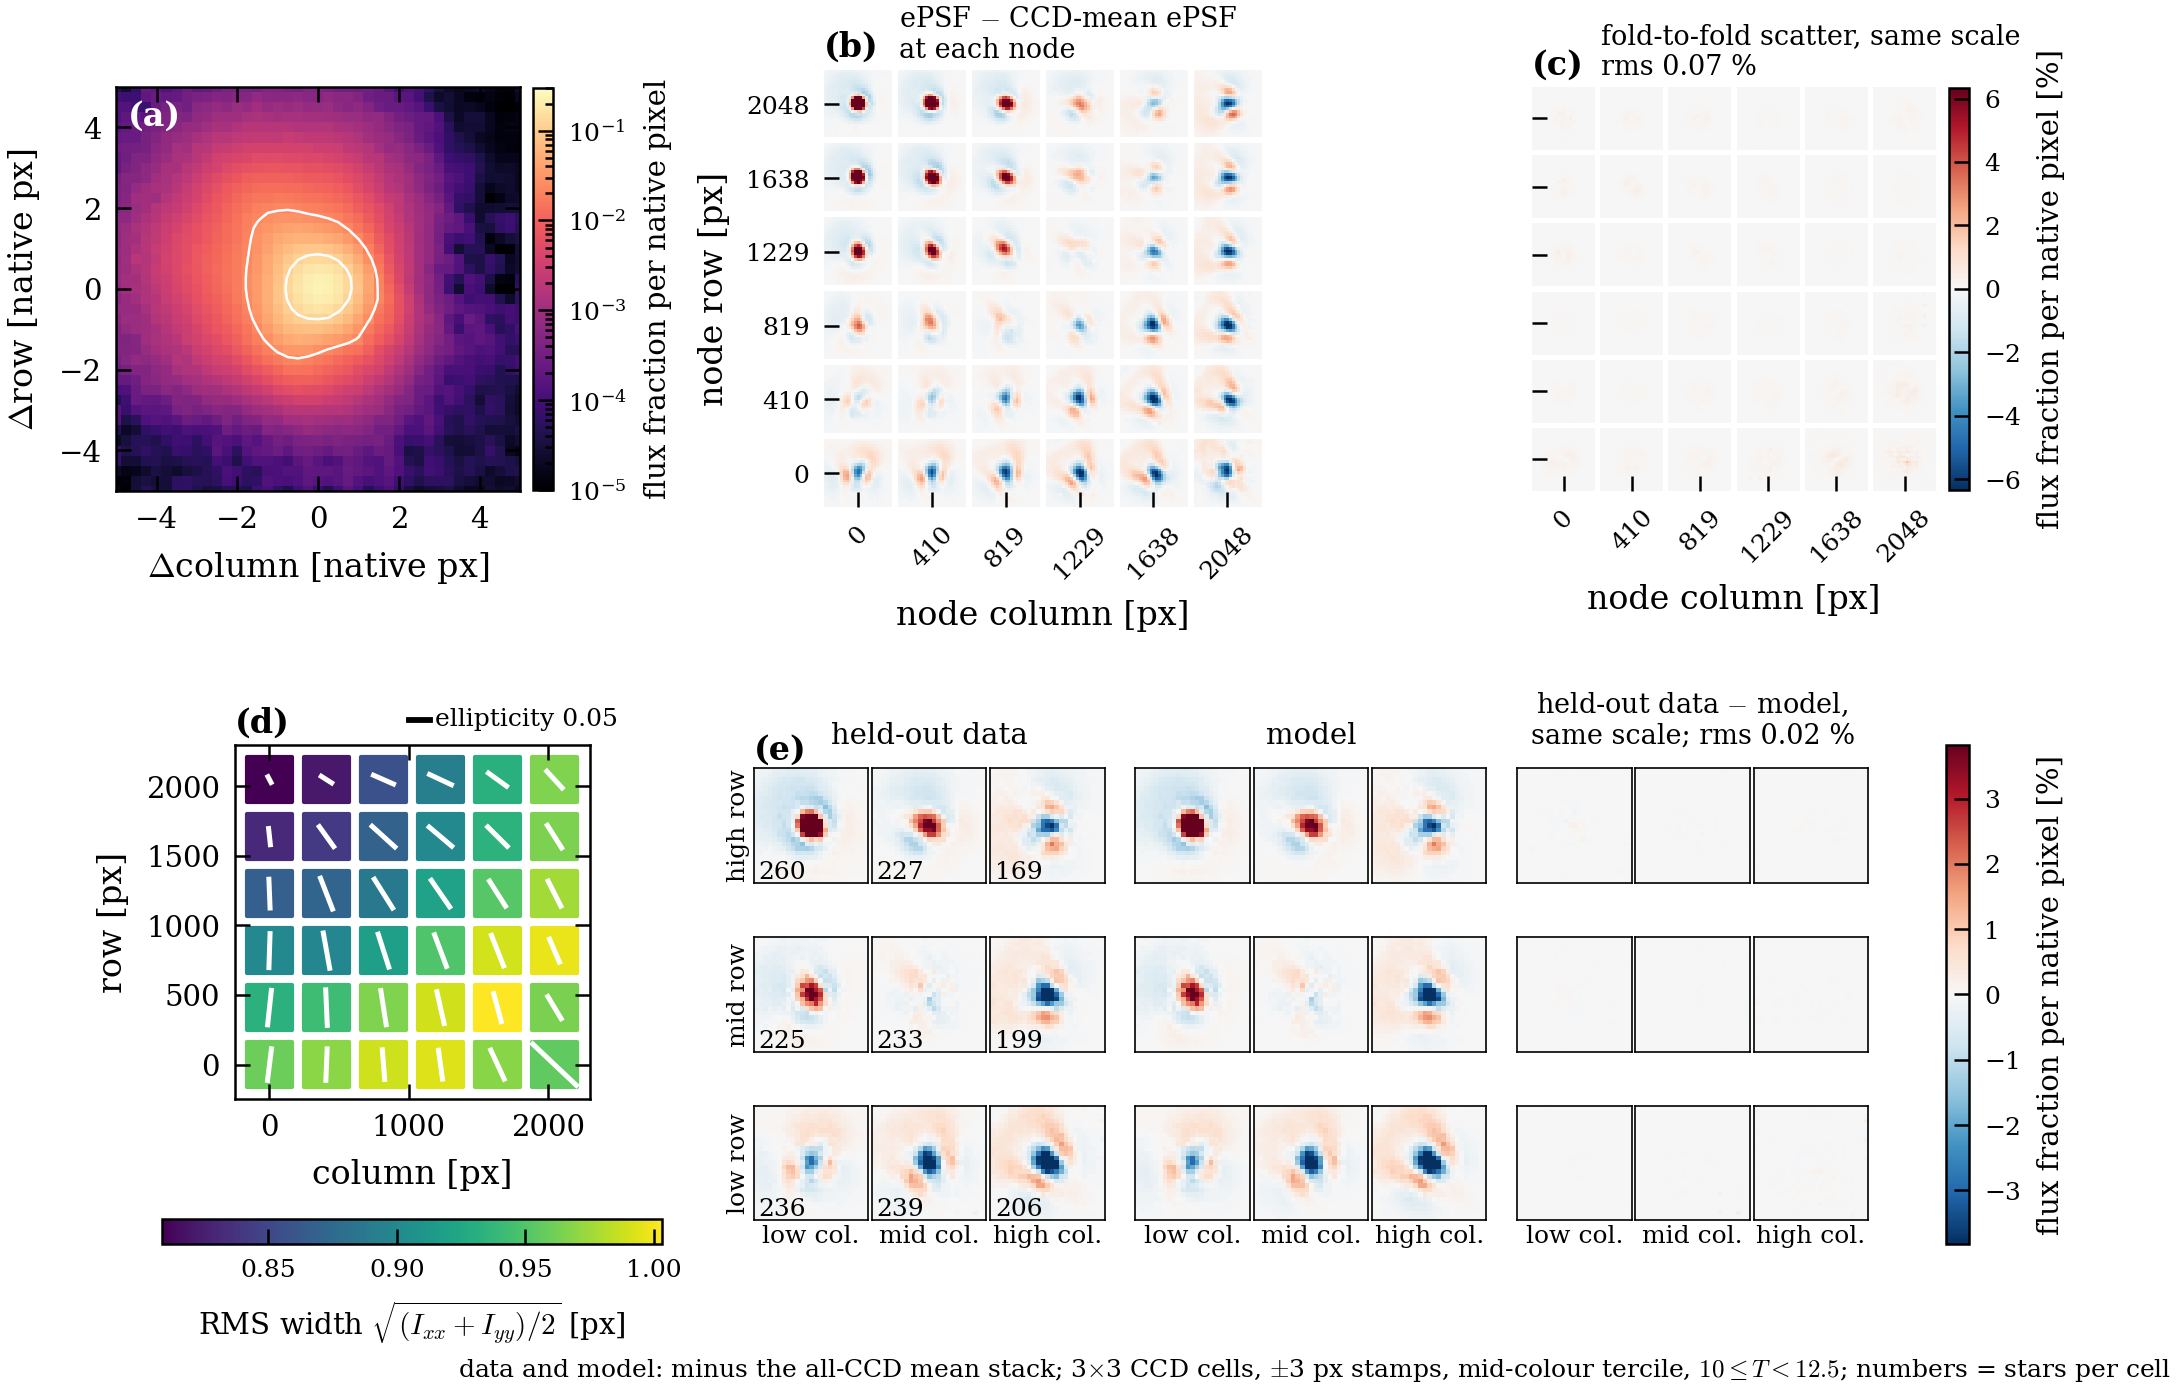
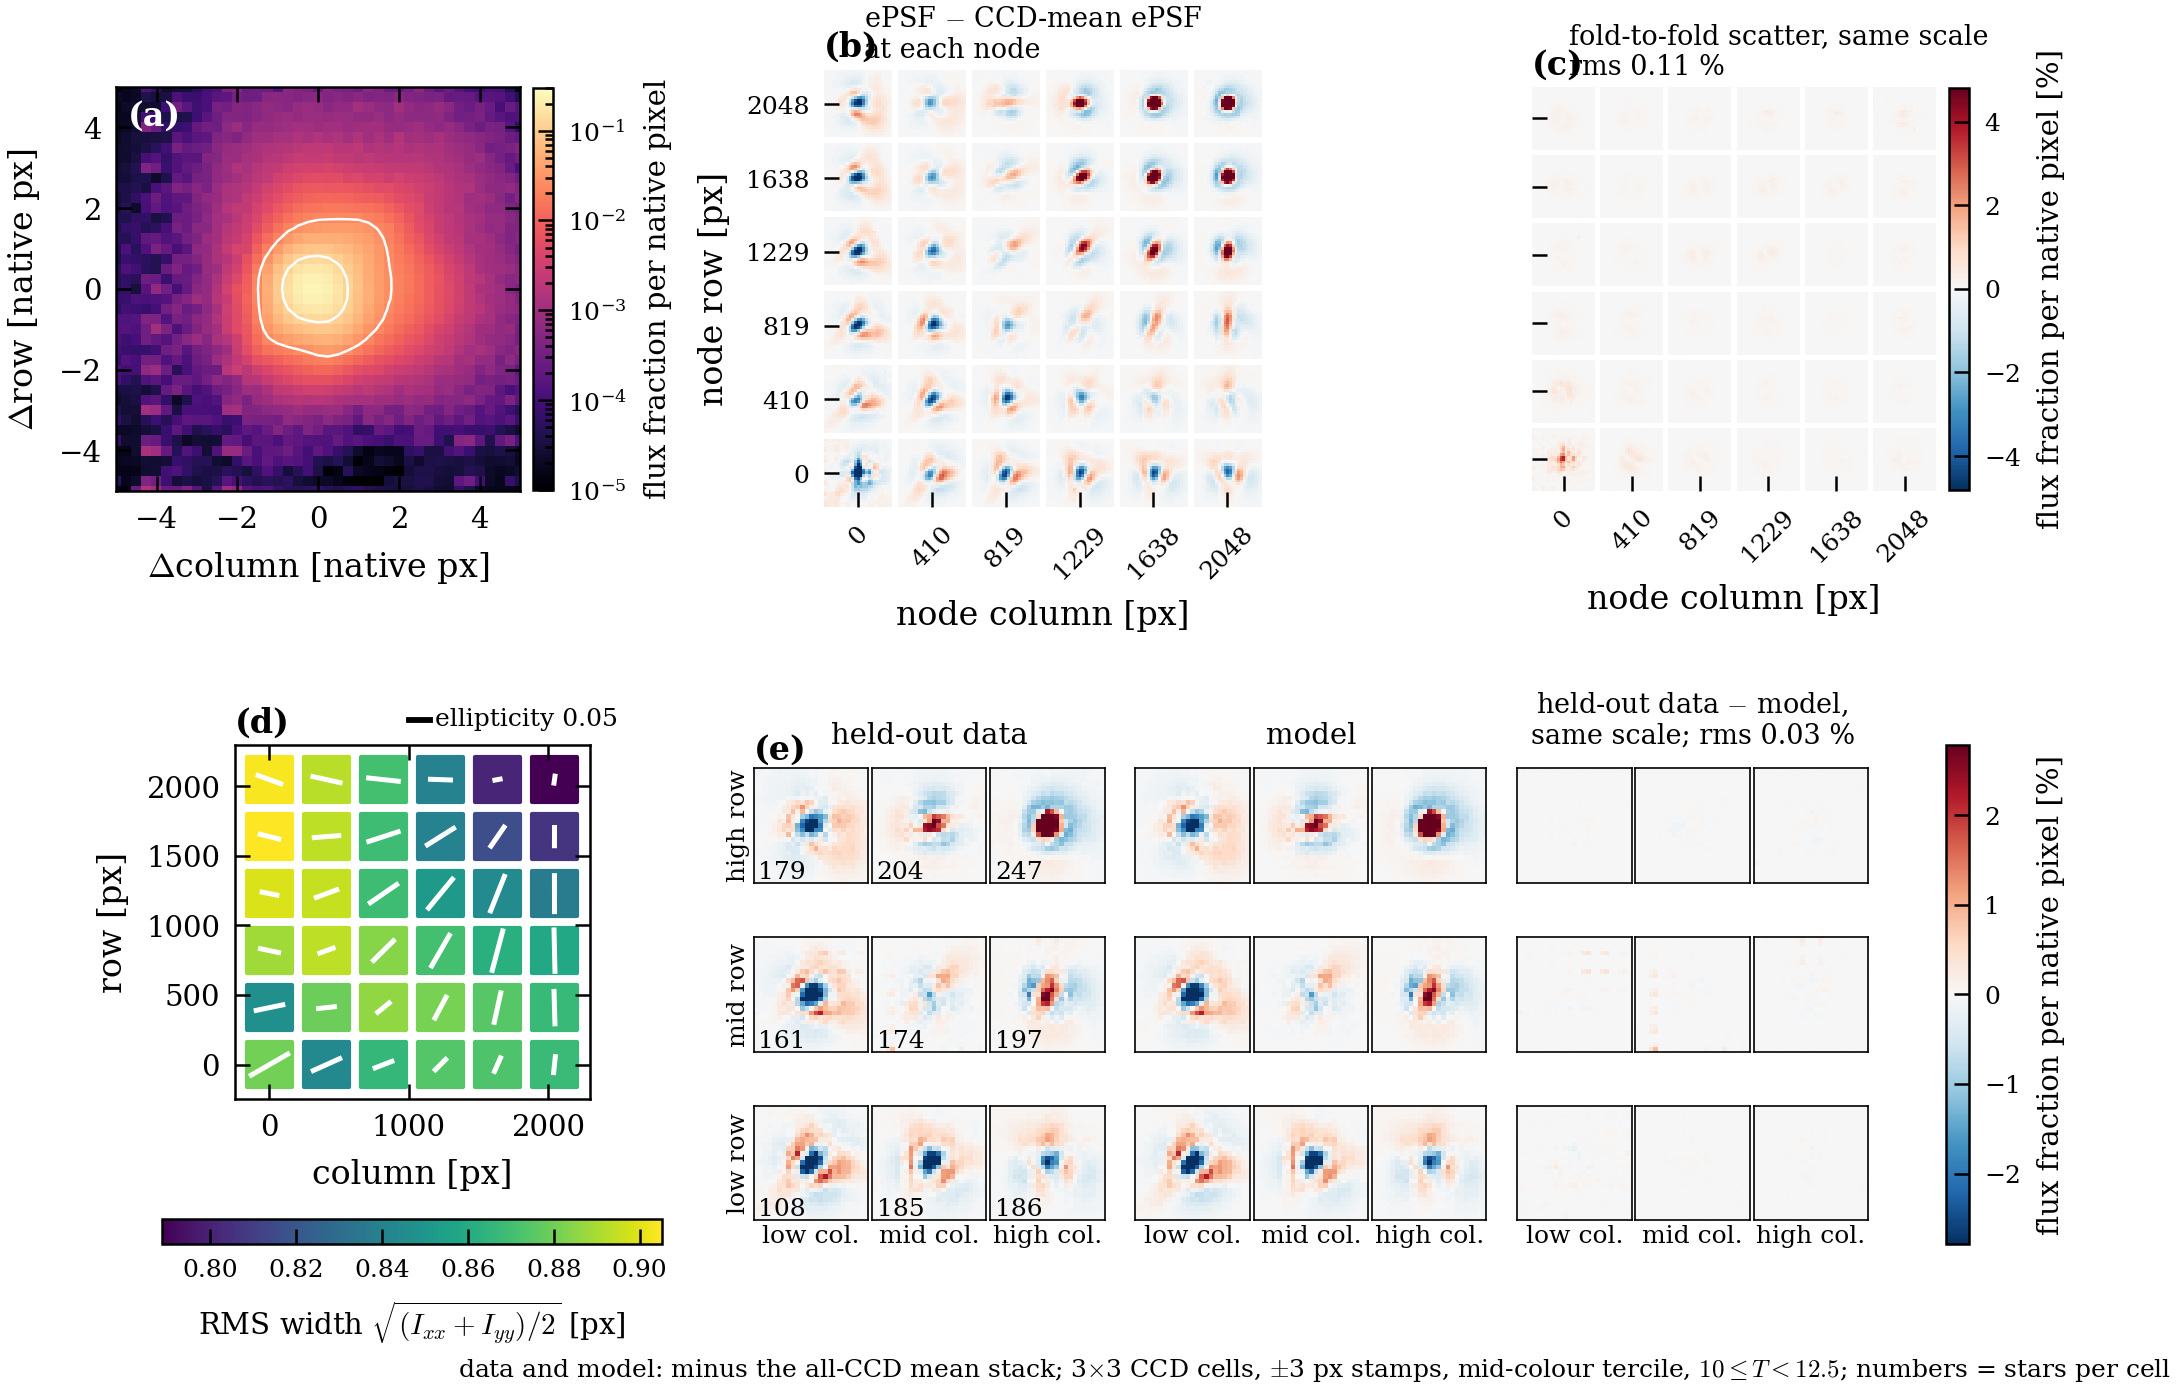
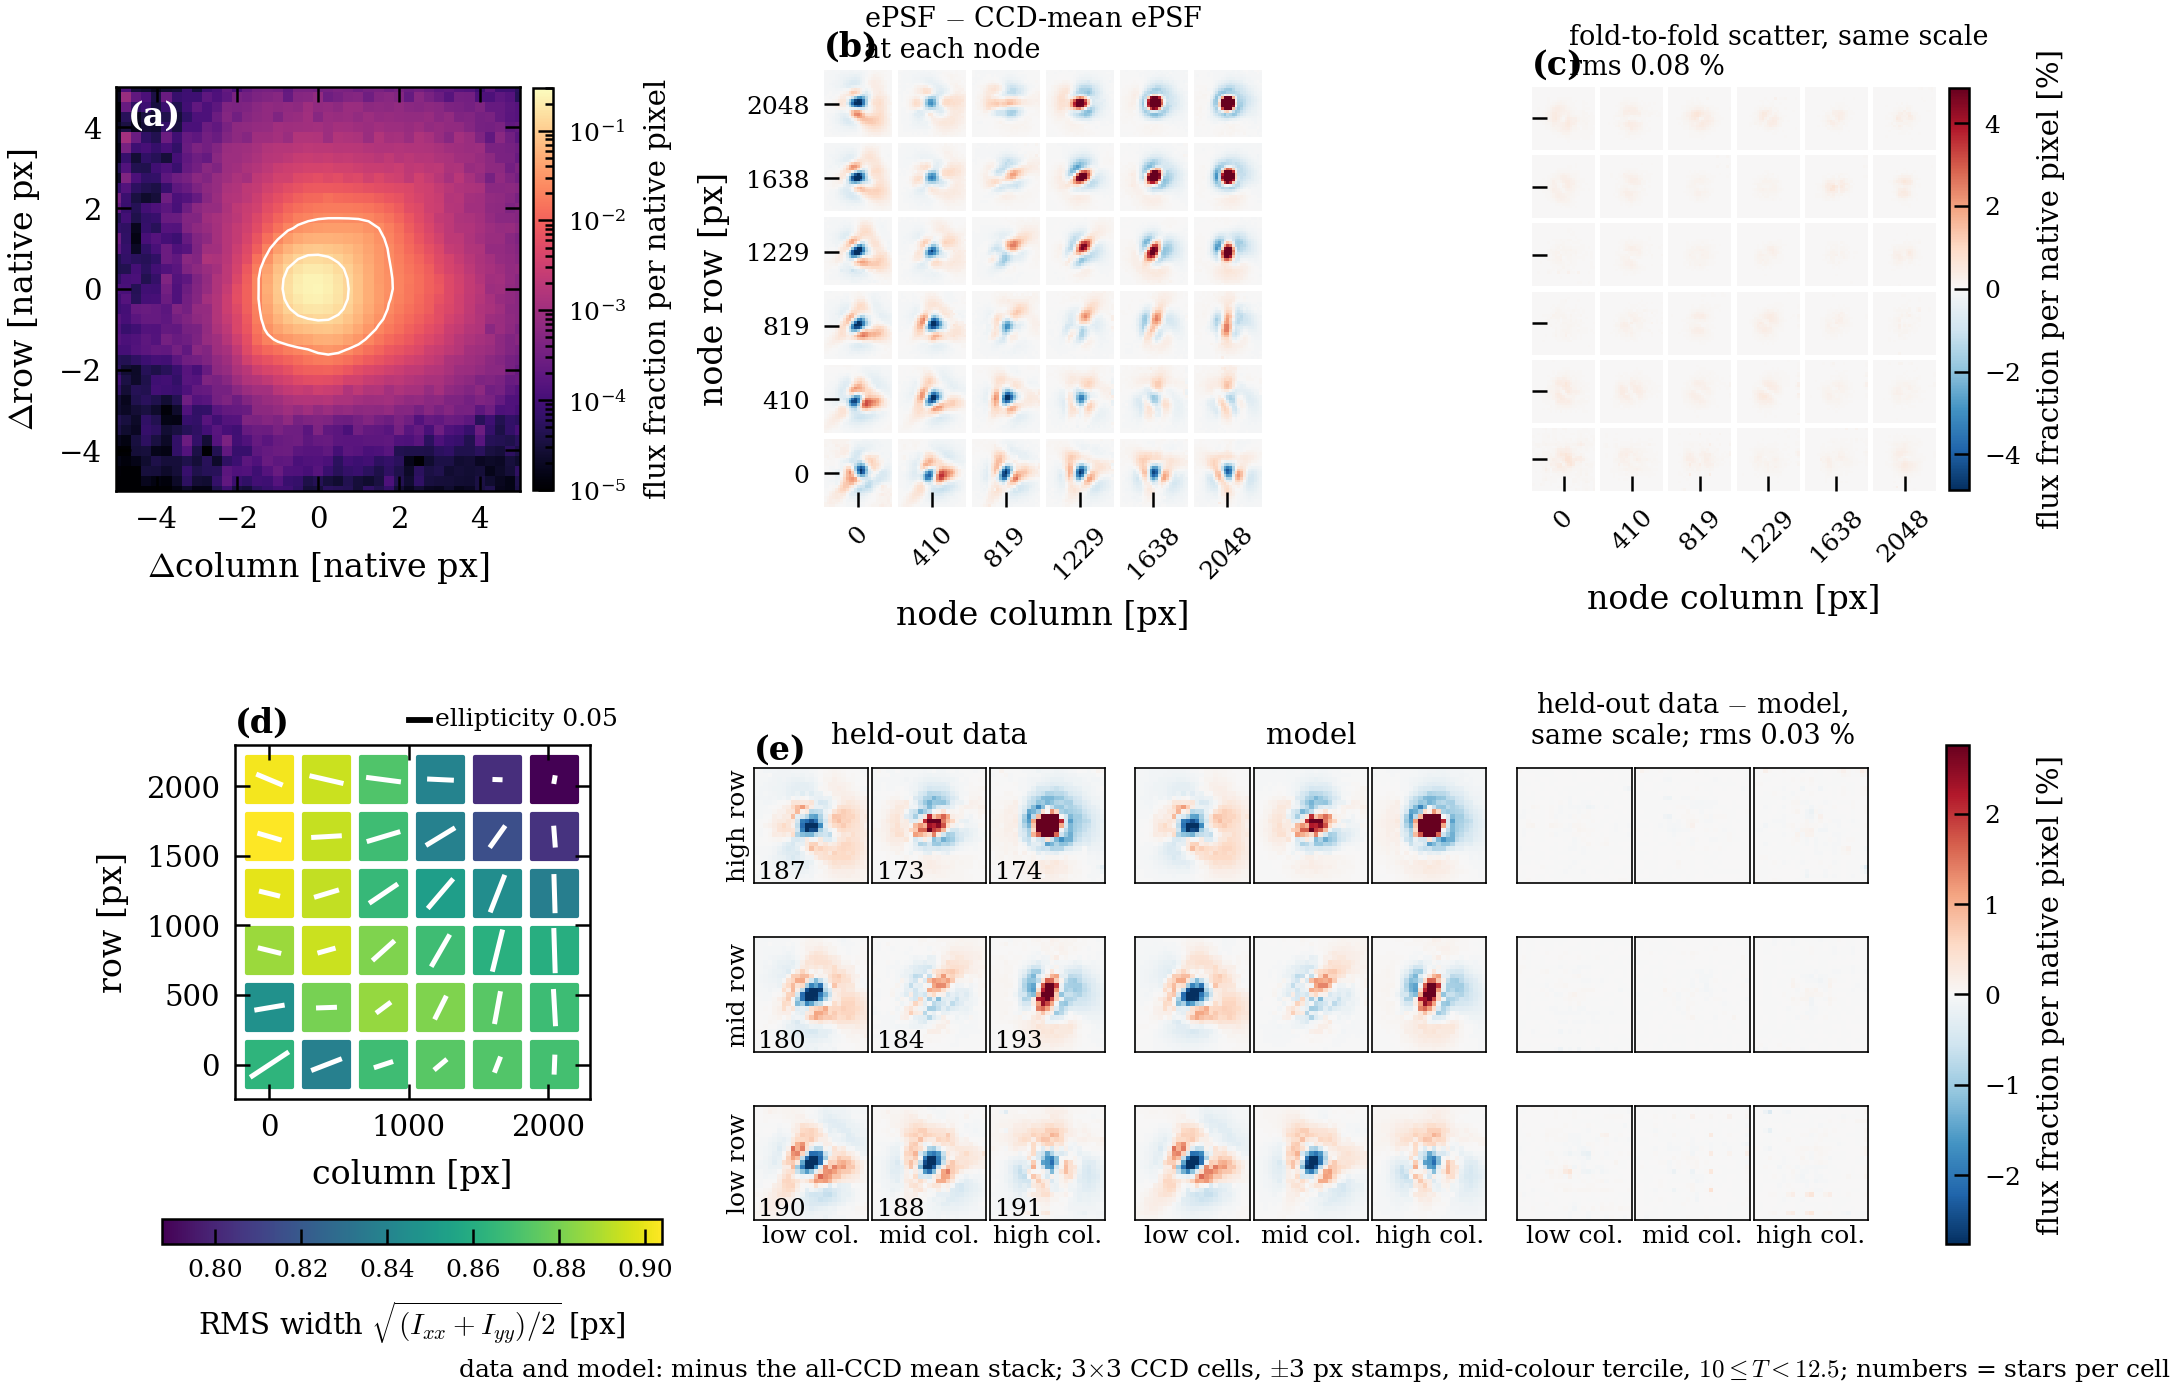
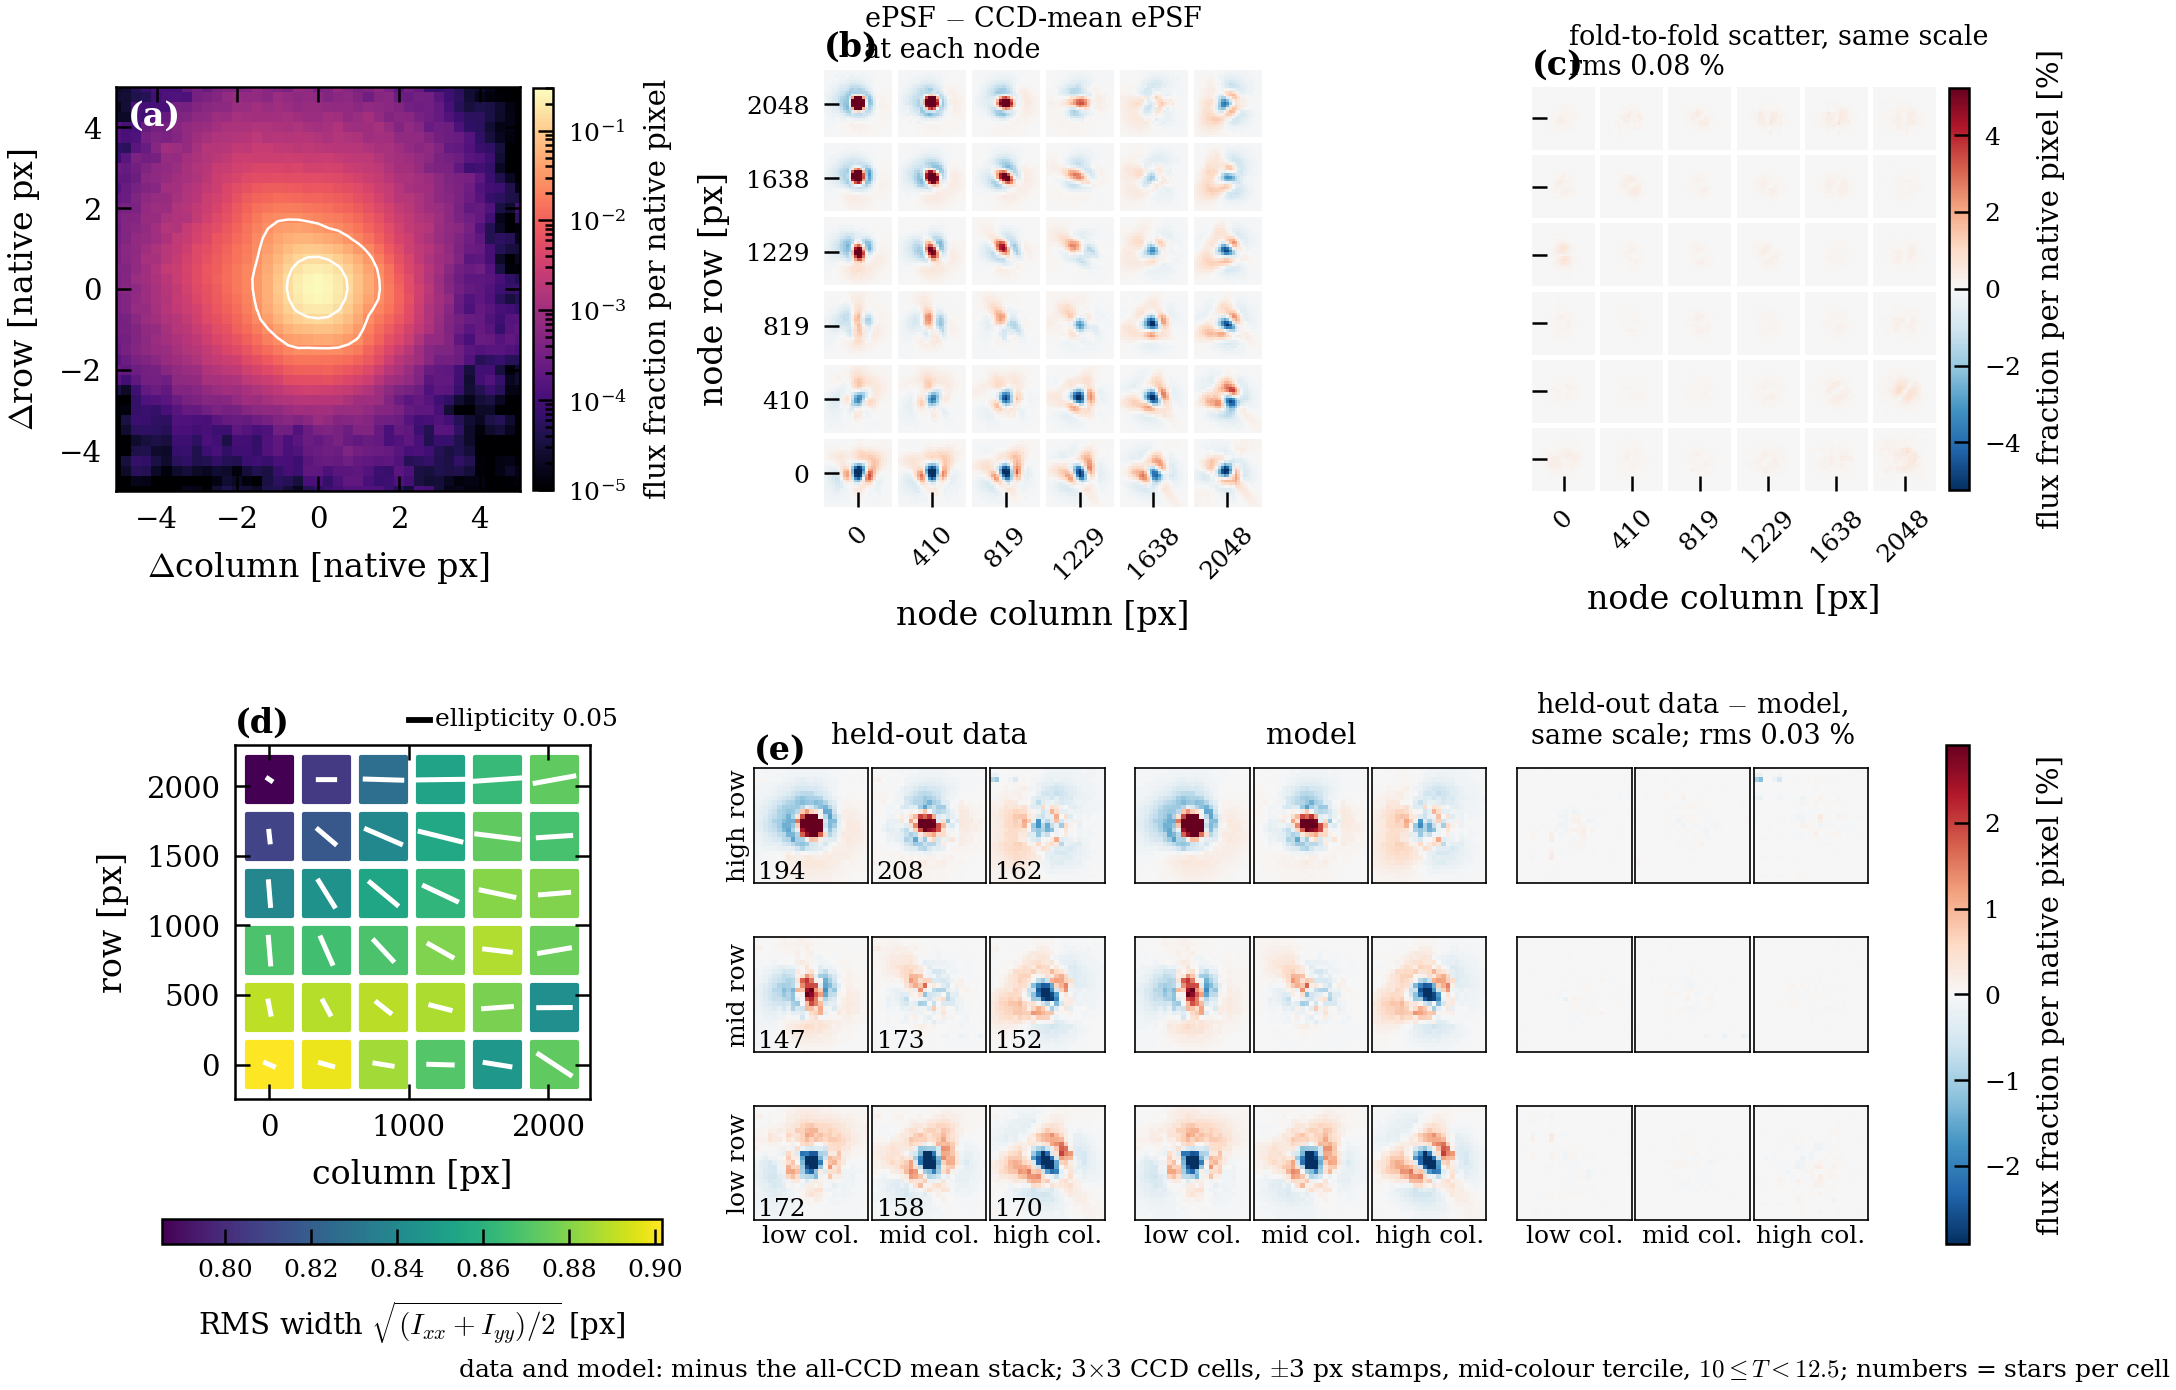
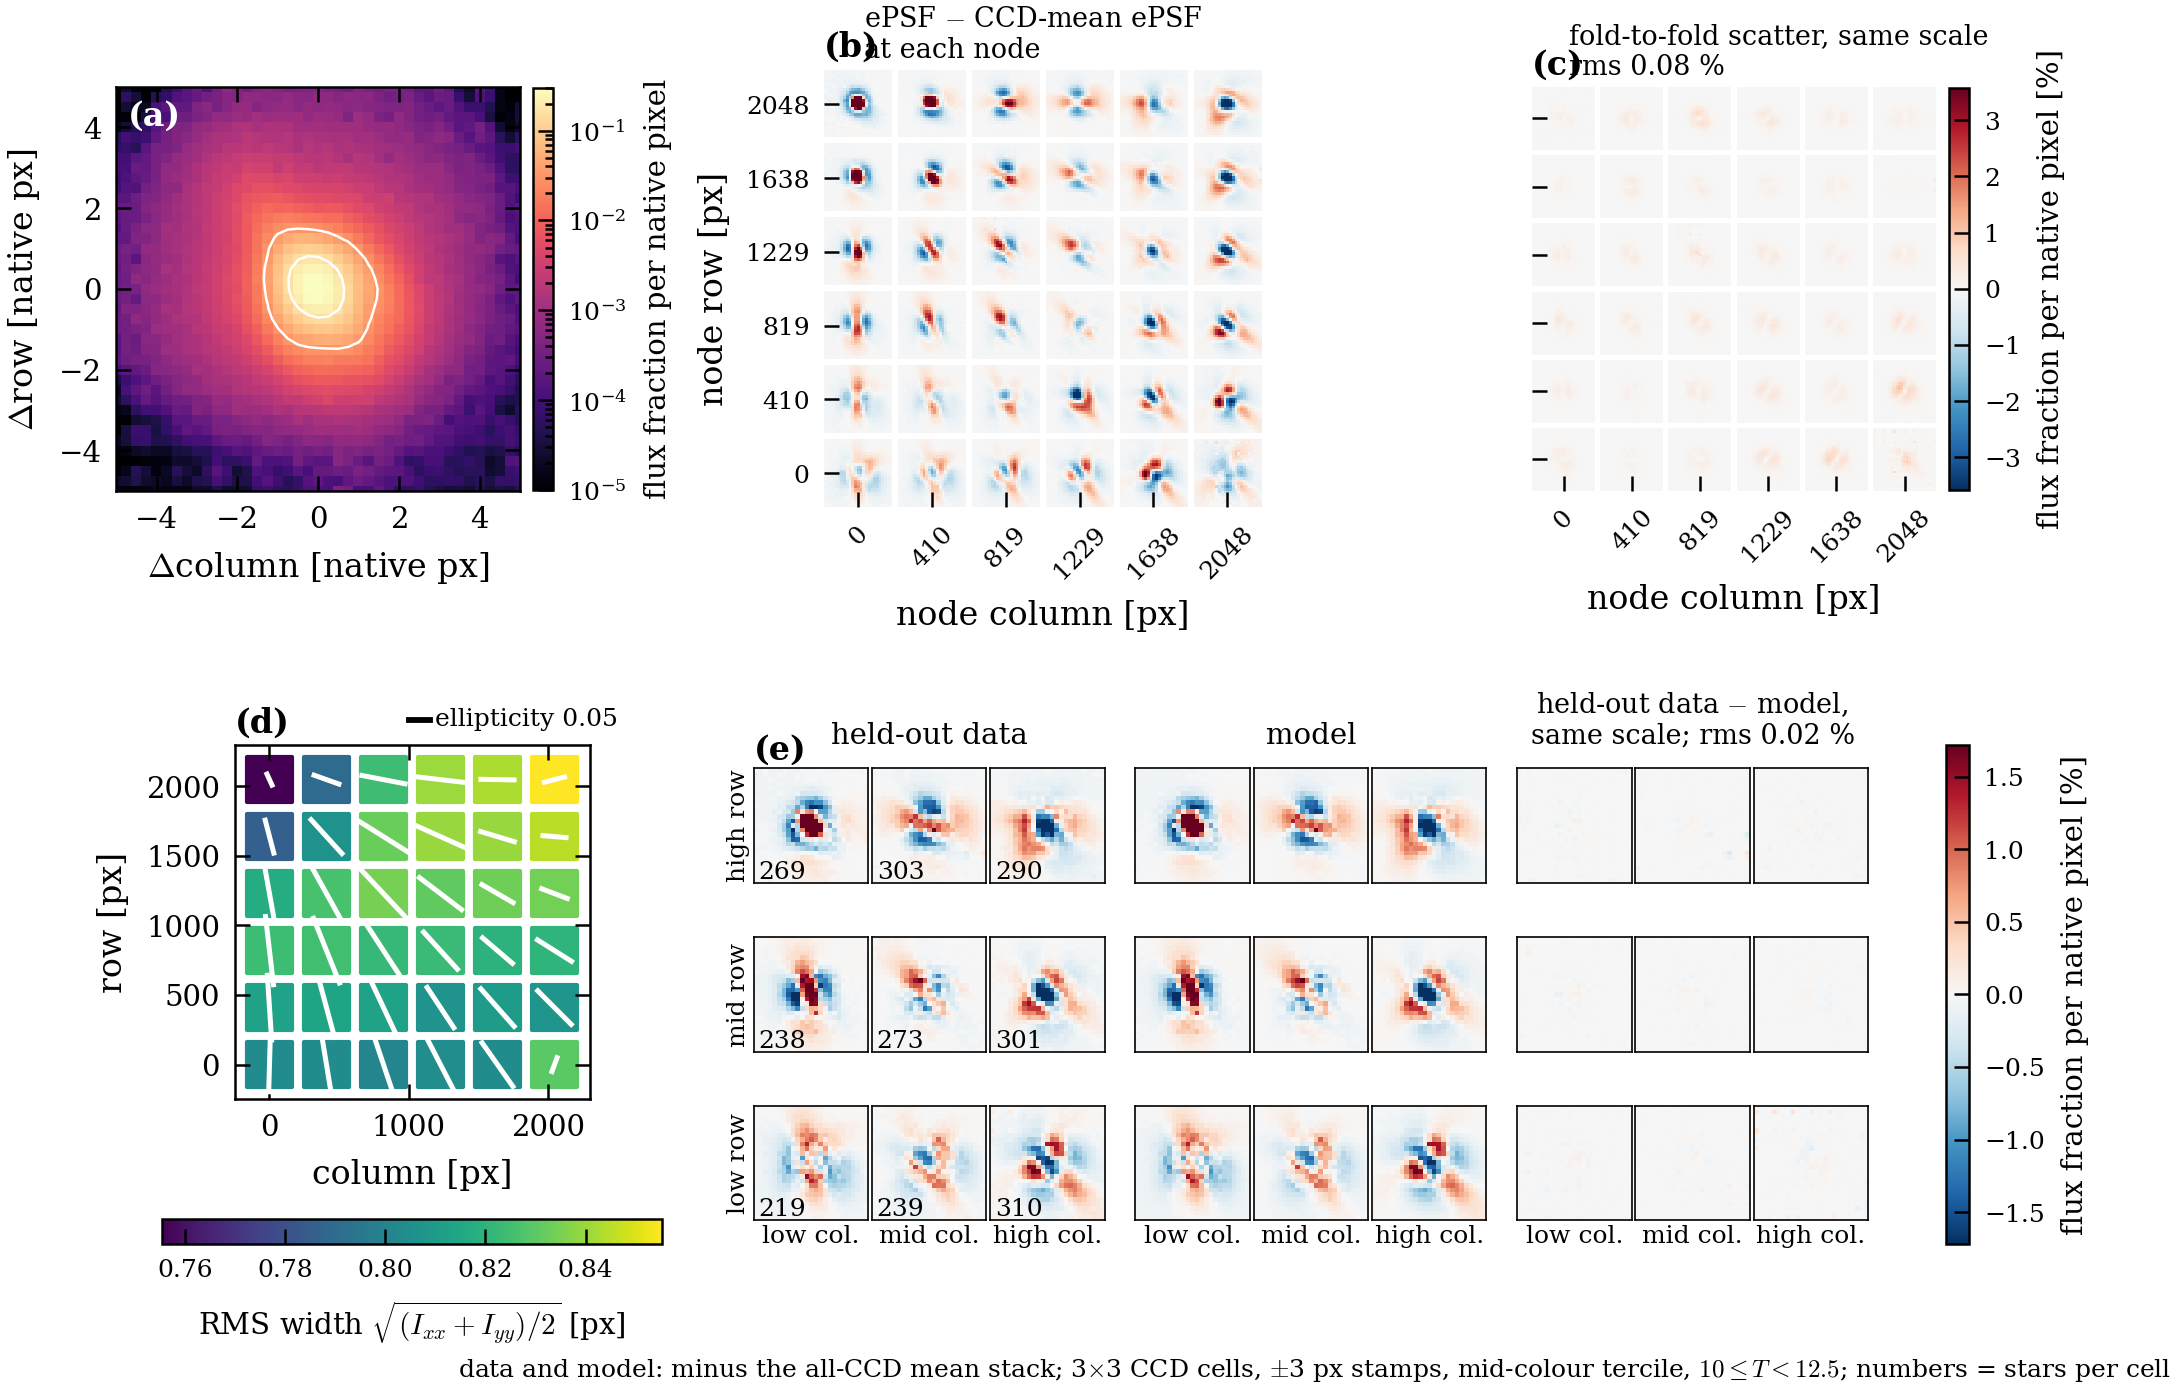
- The spatial change of the ePSF across the detector is 4.9–6.8 times the fold-to-fold scatter across the five fields (to update). The fold scatter is the noise of the measurement, so the spatial change is real.
- The rms width is 0.80–1.00 px with ellipticity up to about 0.15, rising toward the far corner of the CCD (to update).
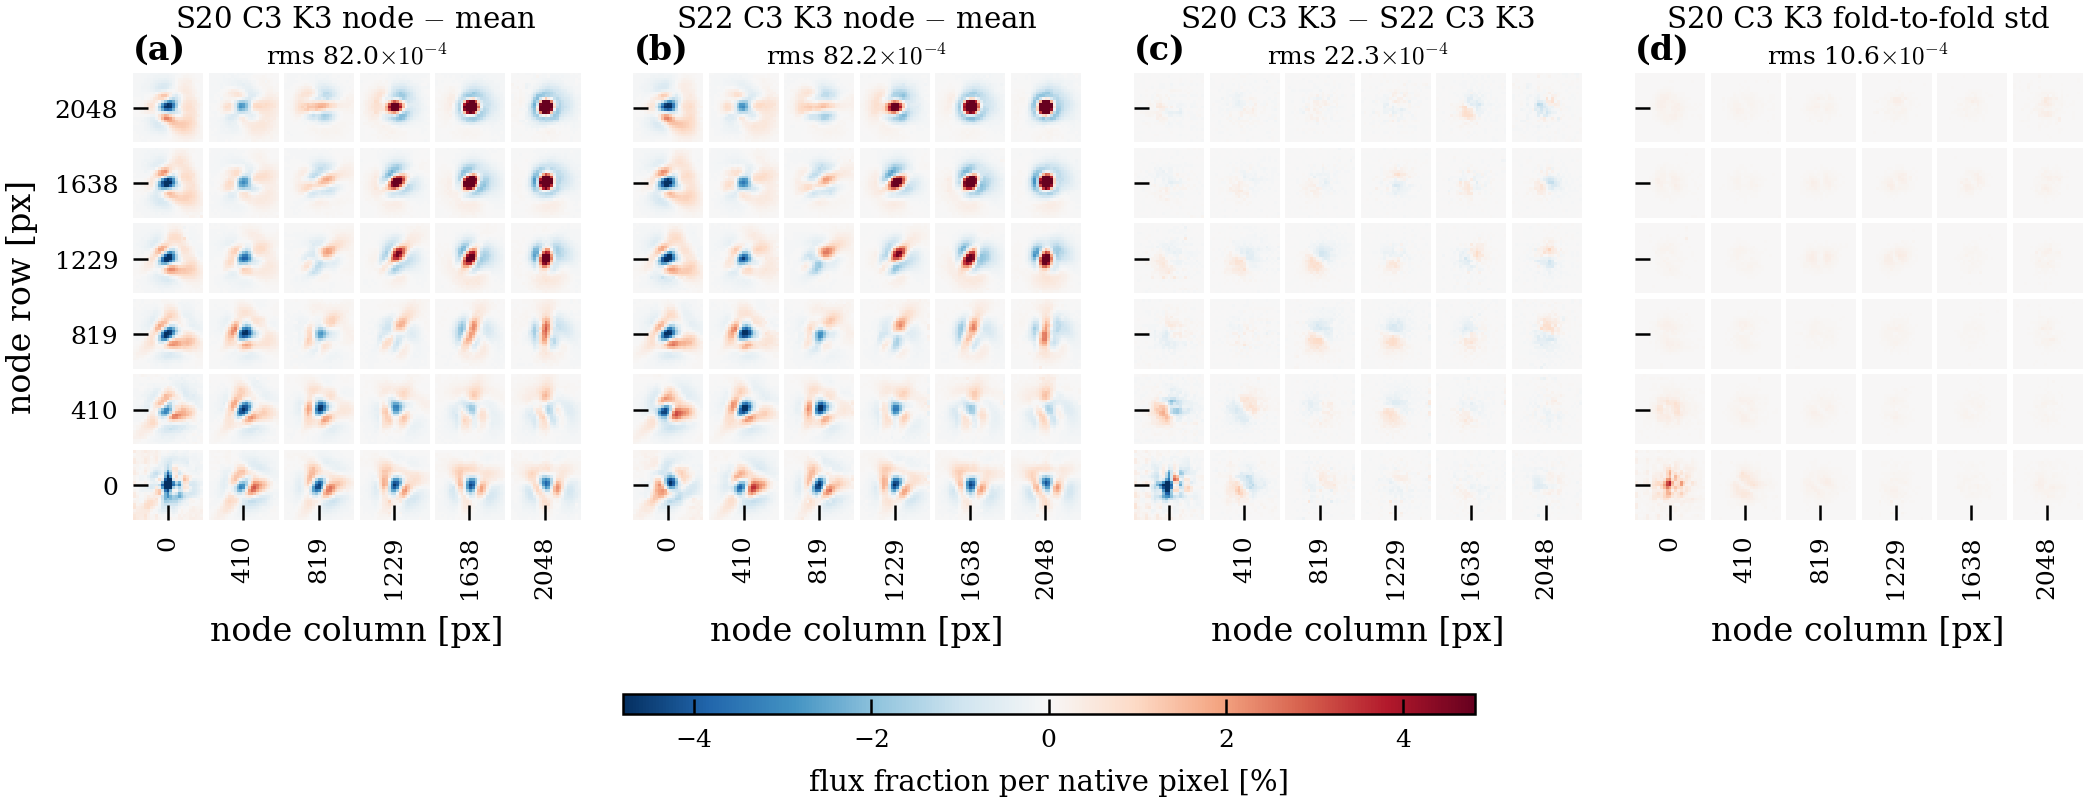
- The same CCD observed in two sectors (F2, S22) largely repeats the pattern: the F2 minus S22 difference has an rms of $2.2\times10^{-3}$ per native pixel, against $8.2\times10^{-3}$ for the node pattern and $0.8$–$1.1\times10^{-3}$ for the fold scatter (to update).
(a) The reference-colour ePSF at the central node. (b) Each of the 36 nodes minus their mean, against (c) the fold-to-fold scatter on the same scale. (d) rms width and ellipticity per node. (e) Held-out stars stacked in 3×3 CCD cells: data minus CCD mean beside model minus CCD mean, and their difference, which is small compared with the spatial change.
Other fields (F2, S22, C1, C4) and the F2 minus S22 repeatability figure
5.2 Colour dependence
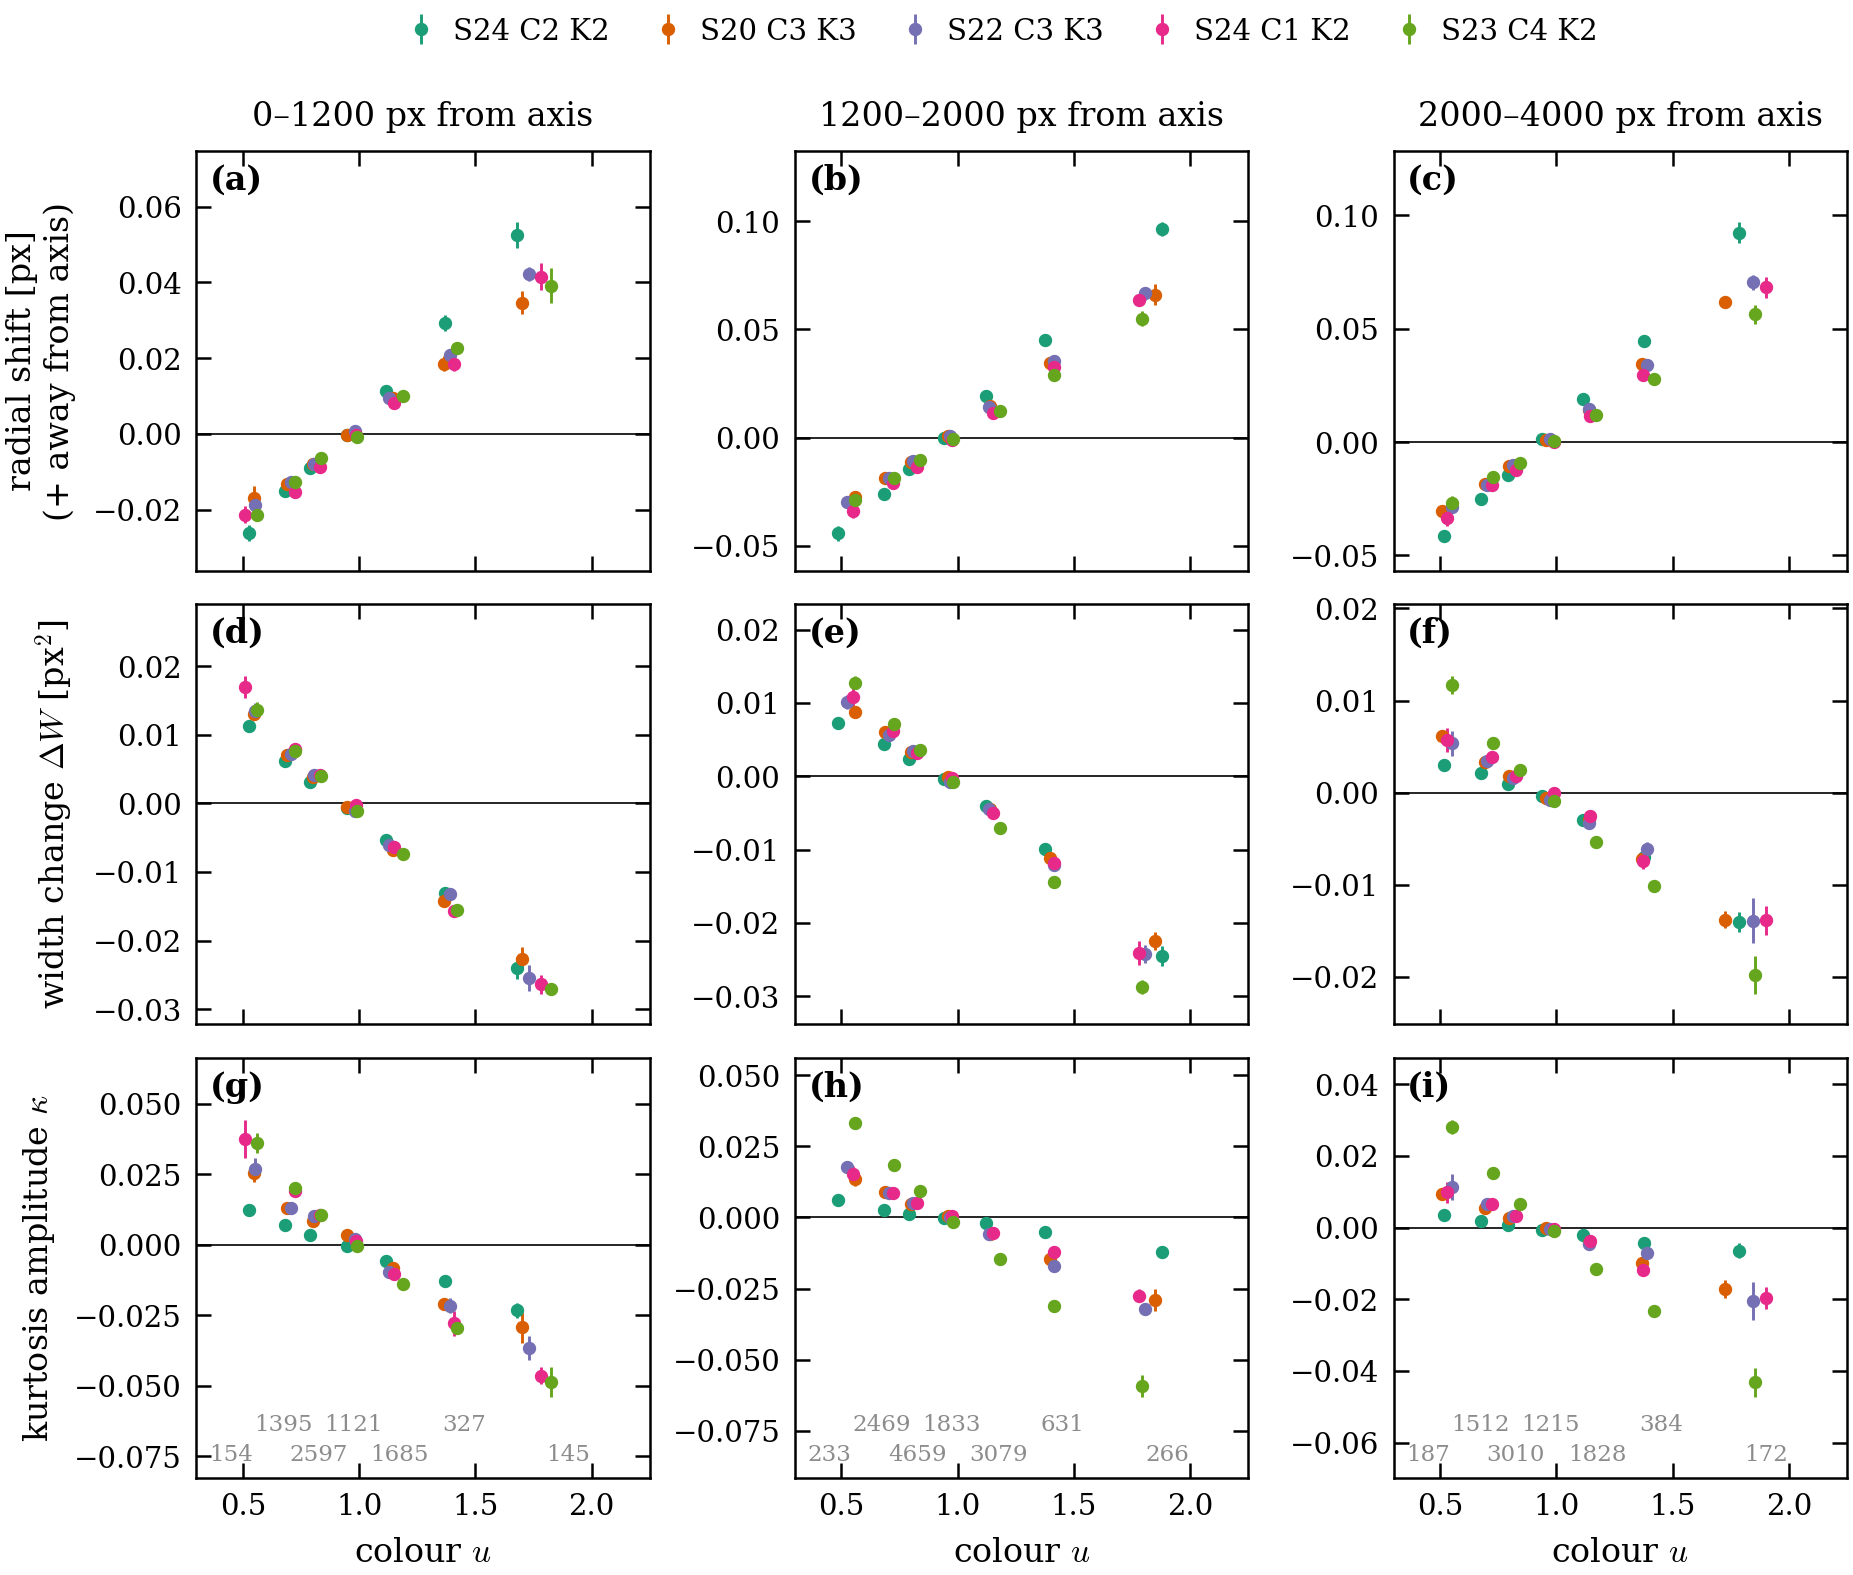
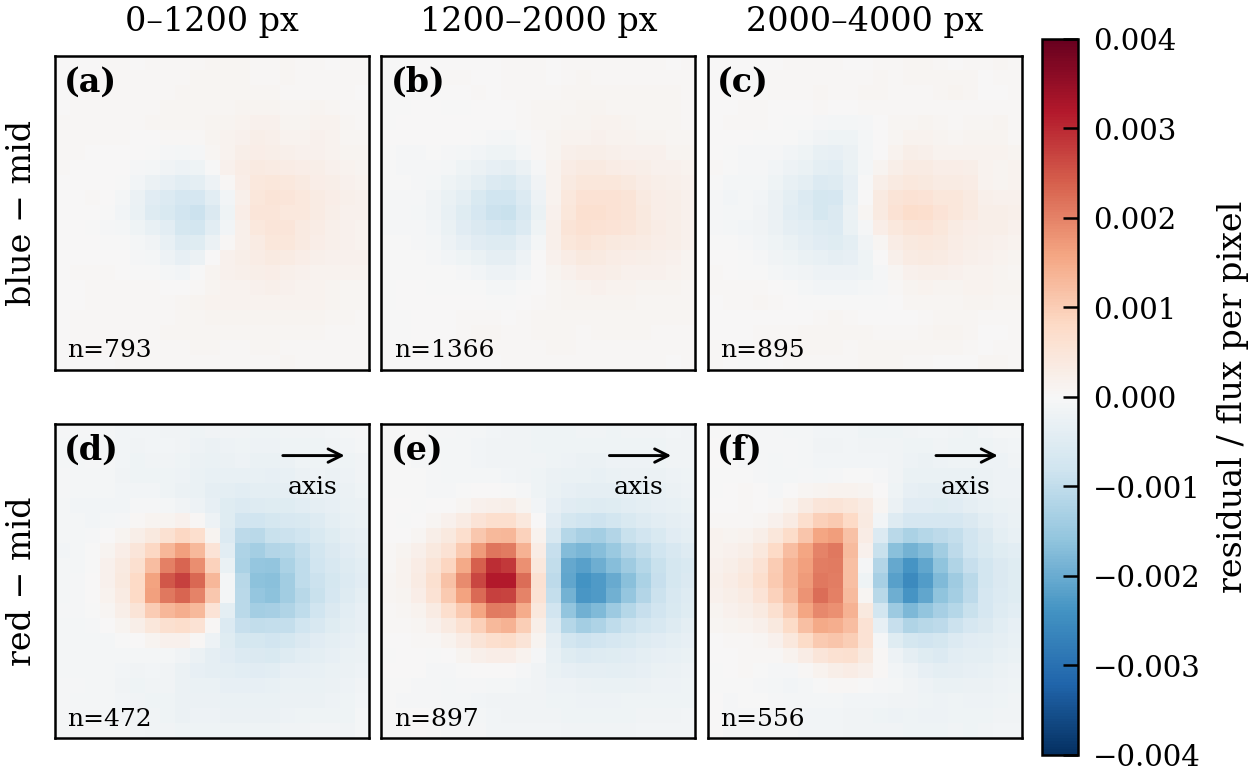
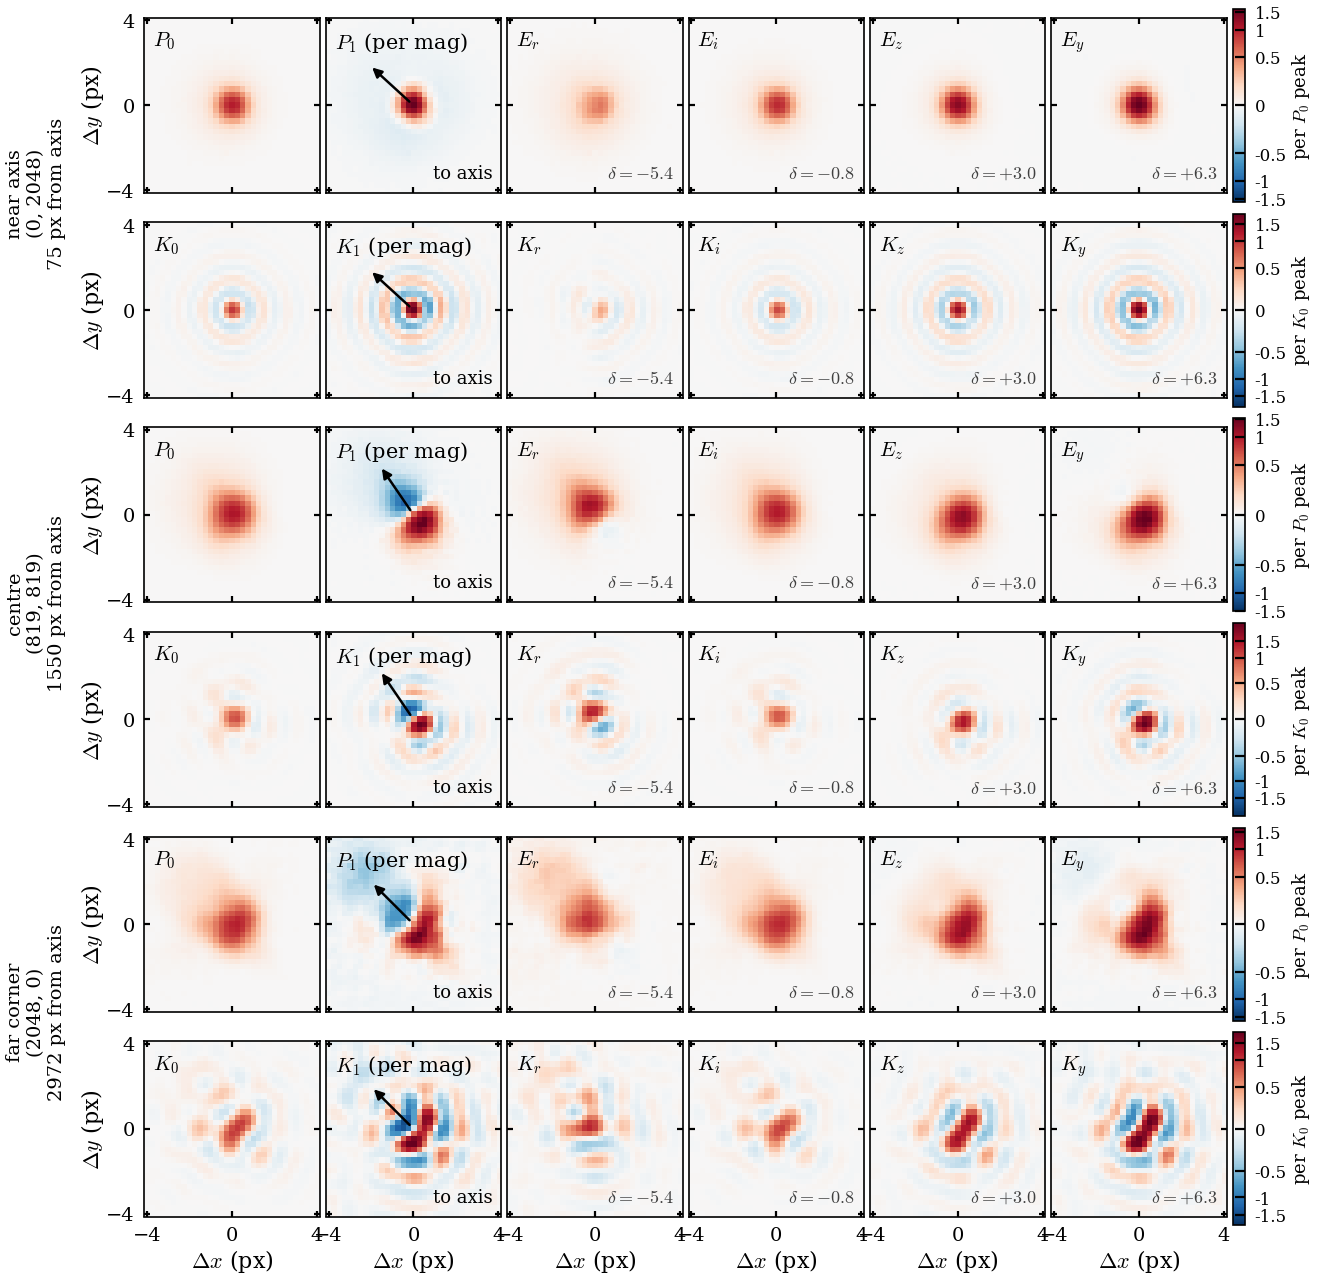
- What the data show, without a model. We fit each held-out star's own response freely. Red stars lie farther from the optical axis, by an amount that grows with axis distance; they have a narrower, peakier core; and a coma-like asymmetry changes sign with radius (Fig. 9). The red minus blue radial shift is $-41$ to $-66$ mpx across the five fields (Table 4).
- The model. The radial shift with ring and coma basis functions (§4.4) reproduces the shift to within 0.6 mpx: the shift left in the residual is $+0.2$ to $+0.6$ mpx, largest for S23 C4 K2 ($+0.6\pm0.2$ mpx, 3$\sigma$) and within 1$\sigma$ elsewhere (Table 4; means over one outlier-clipped star set, so data = model + residual exactly). Fig. 12 shows the basis functions.
- Physical comparison. Against the data, the basis-function model's width and kurtosis slopes follow the data in physical terms (Fig. 13). The earlier physical-operator model, which moves core and wing in fixed ratios, is compared in Appendix D.
- Limit. A red core residual remains inside about 1.3 px; faint stars ($T>13$) are out of scope.
(a–i) Radial shift, width change $\Delta W$ and kurtosis amplitude $\kappa$ of clean held-out $T=10$–13 stars against colour $u$, in three zones of distance from the optical axis, for five fields. Points: median per colour bin with resampling errors. Each star's value is its own fitted response (the model's colour term plus a free per-star correction), and the slopes agree to 0.2 % (shift) and 1–4 % (width, kurtosis) between the two colour models, so the trends are a property of the data. (j) Stacked (data minus achromatic ePSF)/flux, red minus mid-colour and blue minus mid-colour, five fields pooled, per zone, with the optical axis to the right.
Images behind the curves: stacked residuals by colour
(a) The five ring and four coma basis functions, the shift term, and the other terms of the physical-operator model (grey, dashed frames), each normalised to its own maximum, next to the ePSF. (b, c) Azimuthal average of the ring functions and the $\cos\theta$ moment of the coma functions against radius; the shaded band marks the taper beyond 5.5 px. The basis functions cover the radial ranges that the operators combine in fixed ratios.
5.3 Brightness dependence
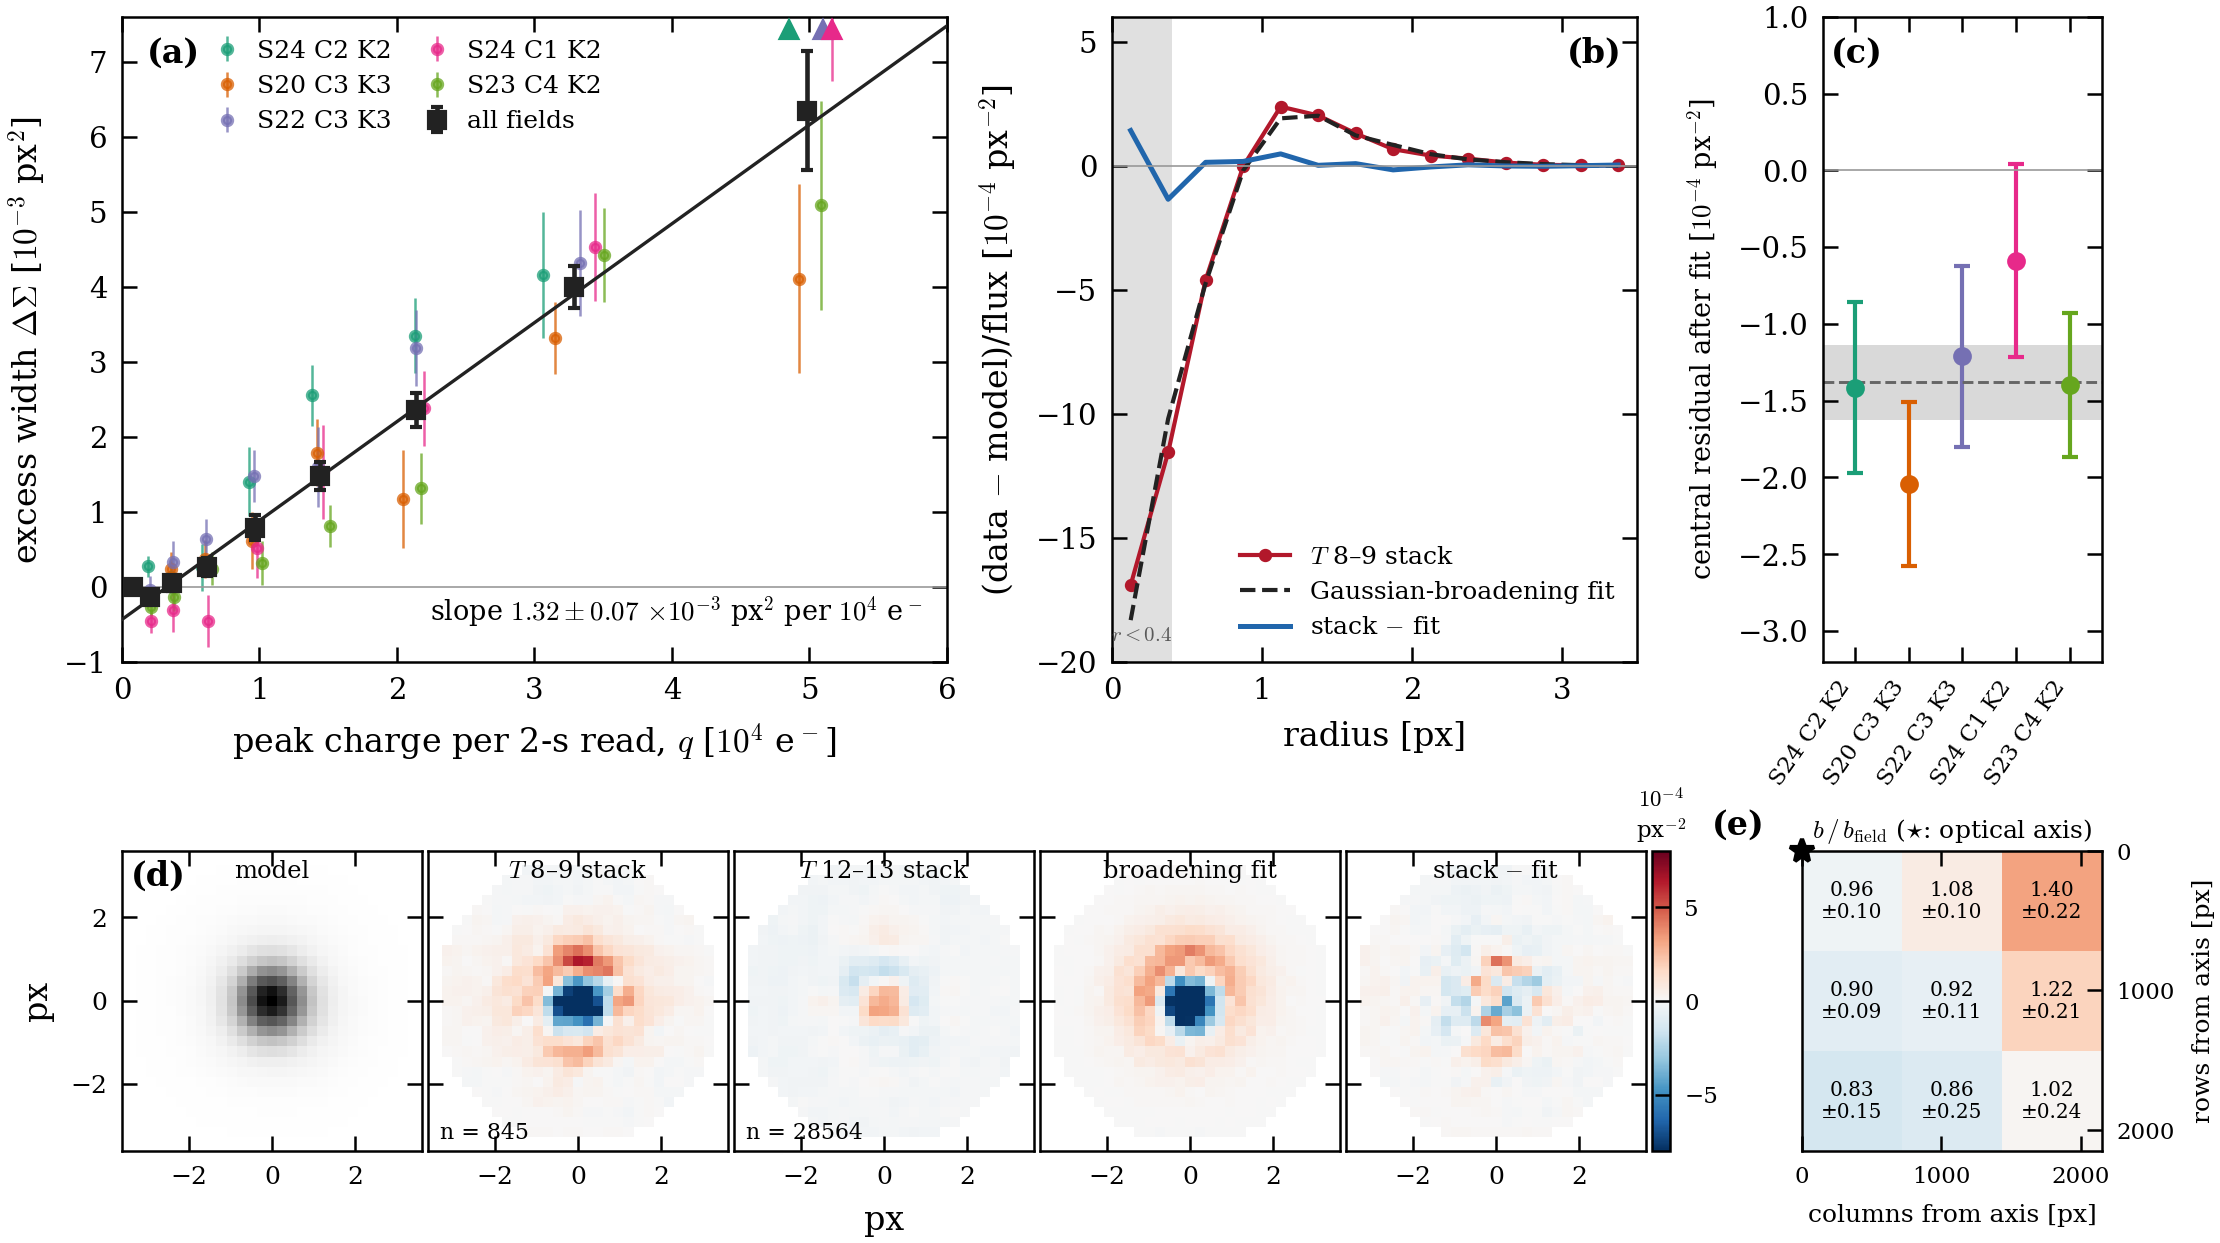
Suppose that, for a group of stars, the true PSF is the model $P$ blurred by an isotropic Gaussian of variance $\Delta\Sigma$ per axis. The stacked residual divided by flux is then $$\frac{\text{data}-\text{model}}{f}\simeq\tfrac12\,\Delta\Sigma\left(\partial_x^2P+\partial_y^2P\right),$$ where $f$ is the star's flux, $P$ the unit-flux model image (px$^{-2}$) and $\Delta\Sigma$ (px$^2$) the excess width, positive when the data are broader than the model. We fit each stack on held-out stars, together with flux, centroid and background terms, and use the peak charge in one 2-s read, $q=2\,{\rm s}\times f\times\phi$, as the brightness variable ($\phi$ is the fraction of the flux in the brightest pixel; $q\approx6\times10^4$ e$^-$ at $T=8$).
- The width grows linearly with peak charge: pooled over five fields, $d\Delta\Sigma/dq=(1.33\pm0.06)\times10^{-3}$ px$^2$ per $10^4$ e$^-$ ($\chi^2=1.4$ for 6 degrees of freedom), zero below $q\approx3\times10^3$ e$^-$ ($T\gtrsim10.5$). The sign is the same in every field; the slope ranges from 1.05 to 1.65.
- Between $T=8$–9 and $T=12$–13 the excess is $(3.4\pm0.2)\times10^{-3}$ px$^2$, about 0.2 % in the core width. The absolute scale of $\Delta\Sigma$ has a 10–15 % systematic uncertainty from the calibration of the measurement.
- A Gaussian broadening explains 87 % of the power of the bright stack within 3.5 px. What remains is small but not noise.
- The effect resembles the brighter-fatter effect of CCDs (Antilogus et al. 2014; Guyonnet et al. 2015): charge already collected in a pixel deflects later photo-electrons toward its neighbours.
- Leaving it out costs little: adding a width term lowers the held-out $\chi^2$ by 1.2 % at $T=8$–10.5 and 0.15 % at $T=10.5$–13, and changes PSF magnitudes by between $-0.6$ and $+0.3$ mmag (Appendix E).
Excess PSF width relative to the adopted model, measured on held-out stars in five fields. (a) Excess width $\Delta\Sigma$ against peak charge $q$ per 2-s read, relative to each field's faint stars; coloured points are fields, black squares the weighted mean, the line a straight-line fit with the slope given. (b) Azimuthal profile of the pooled $T=8$–9 stack, its Gaussian-broadening fit and the remainder. (c) Central residual after the same fit, per field. (d) Model image, stacked residuals at $T=8$–9 and $12$–13, the broadening fit and the remainder, on one colour scale ($10^{-4}$ px$^{-2}$).
5.4 What remains
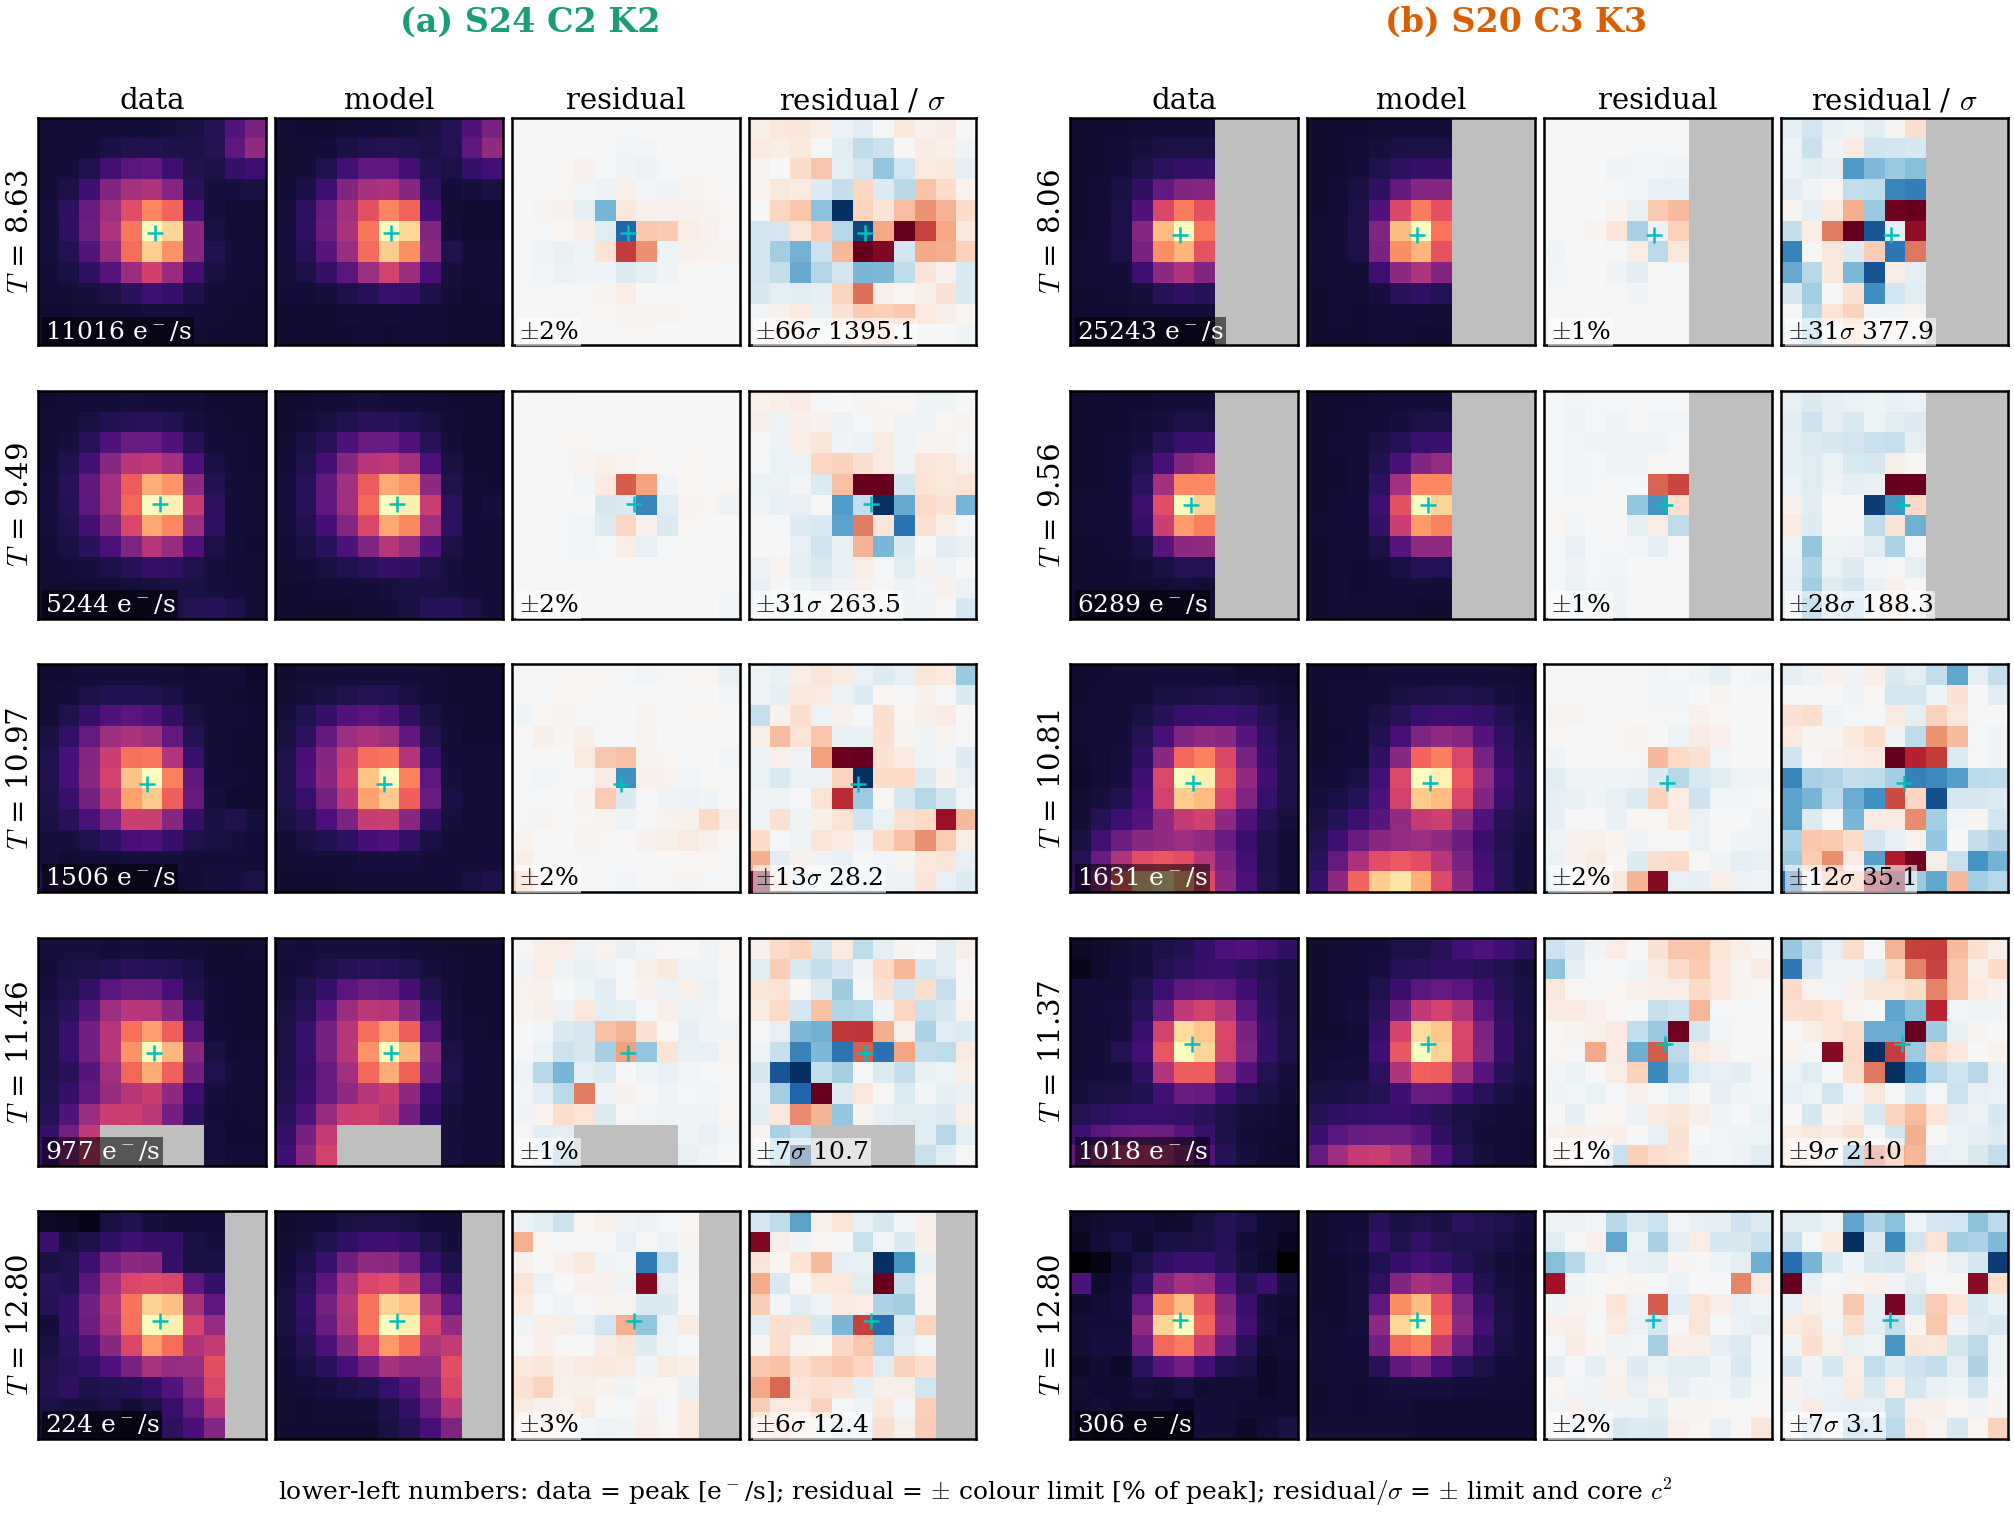
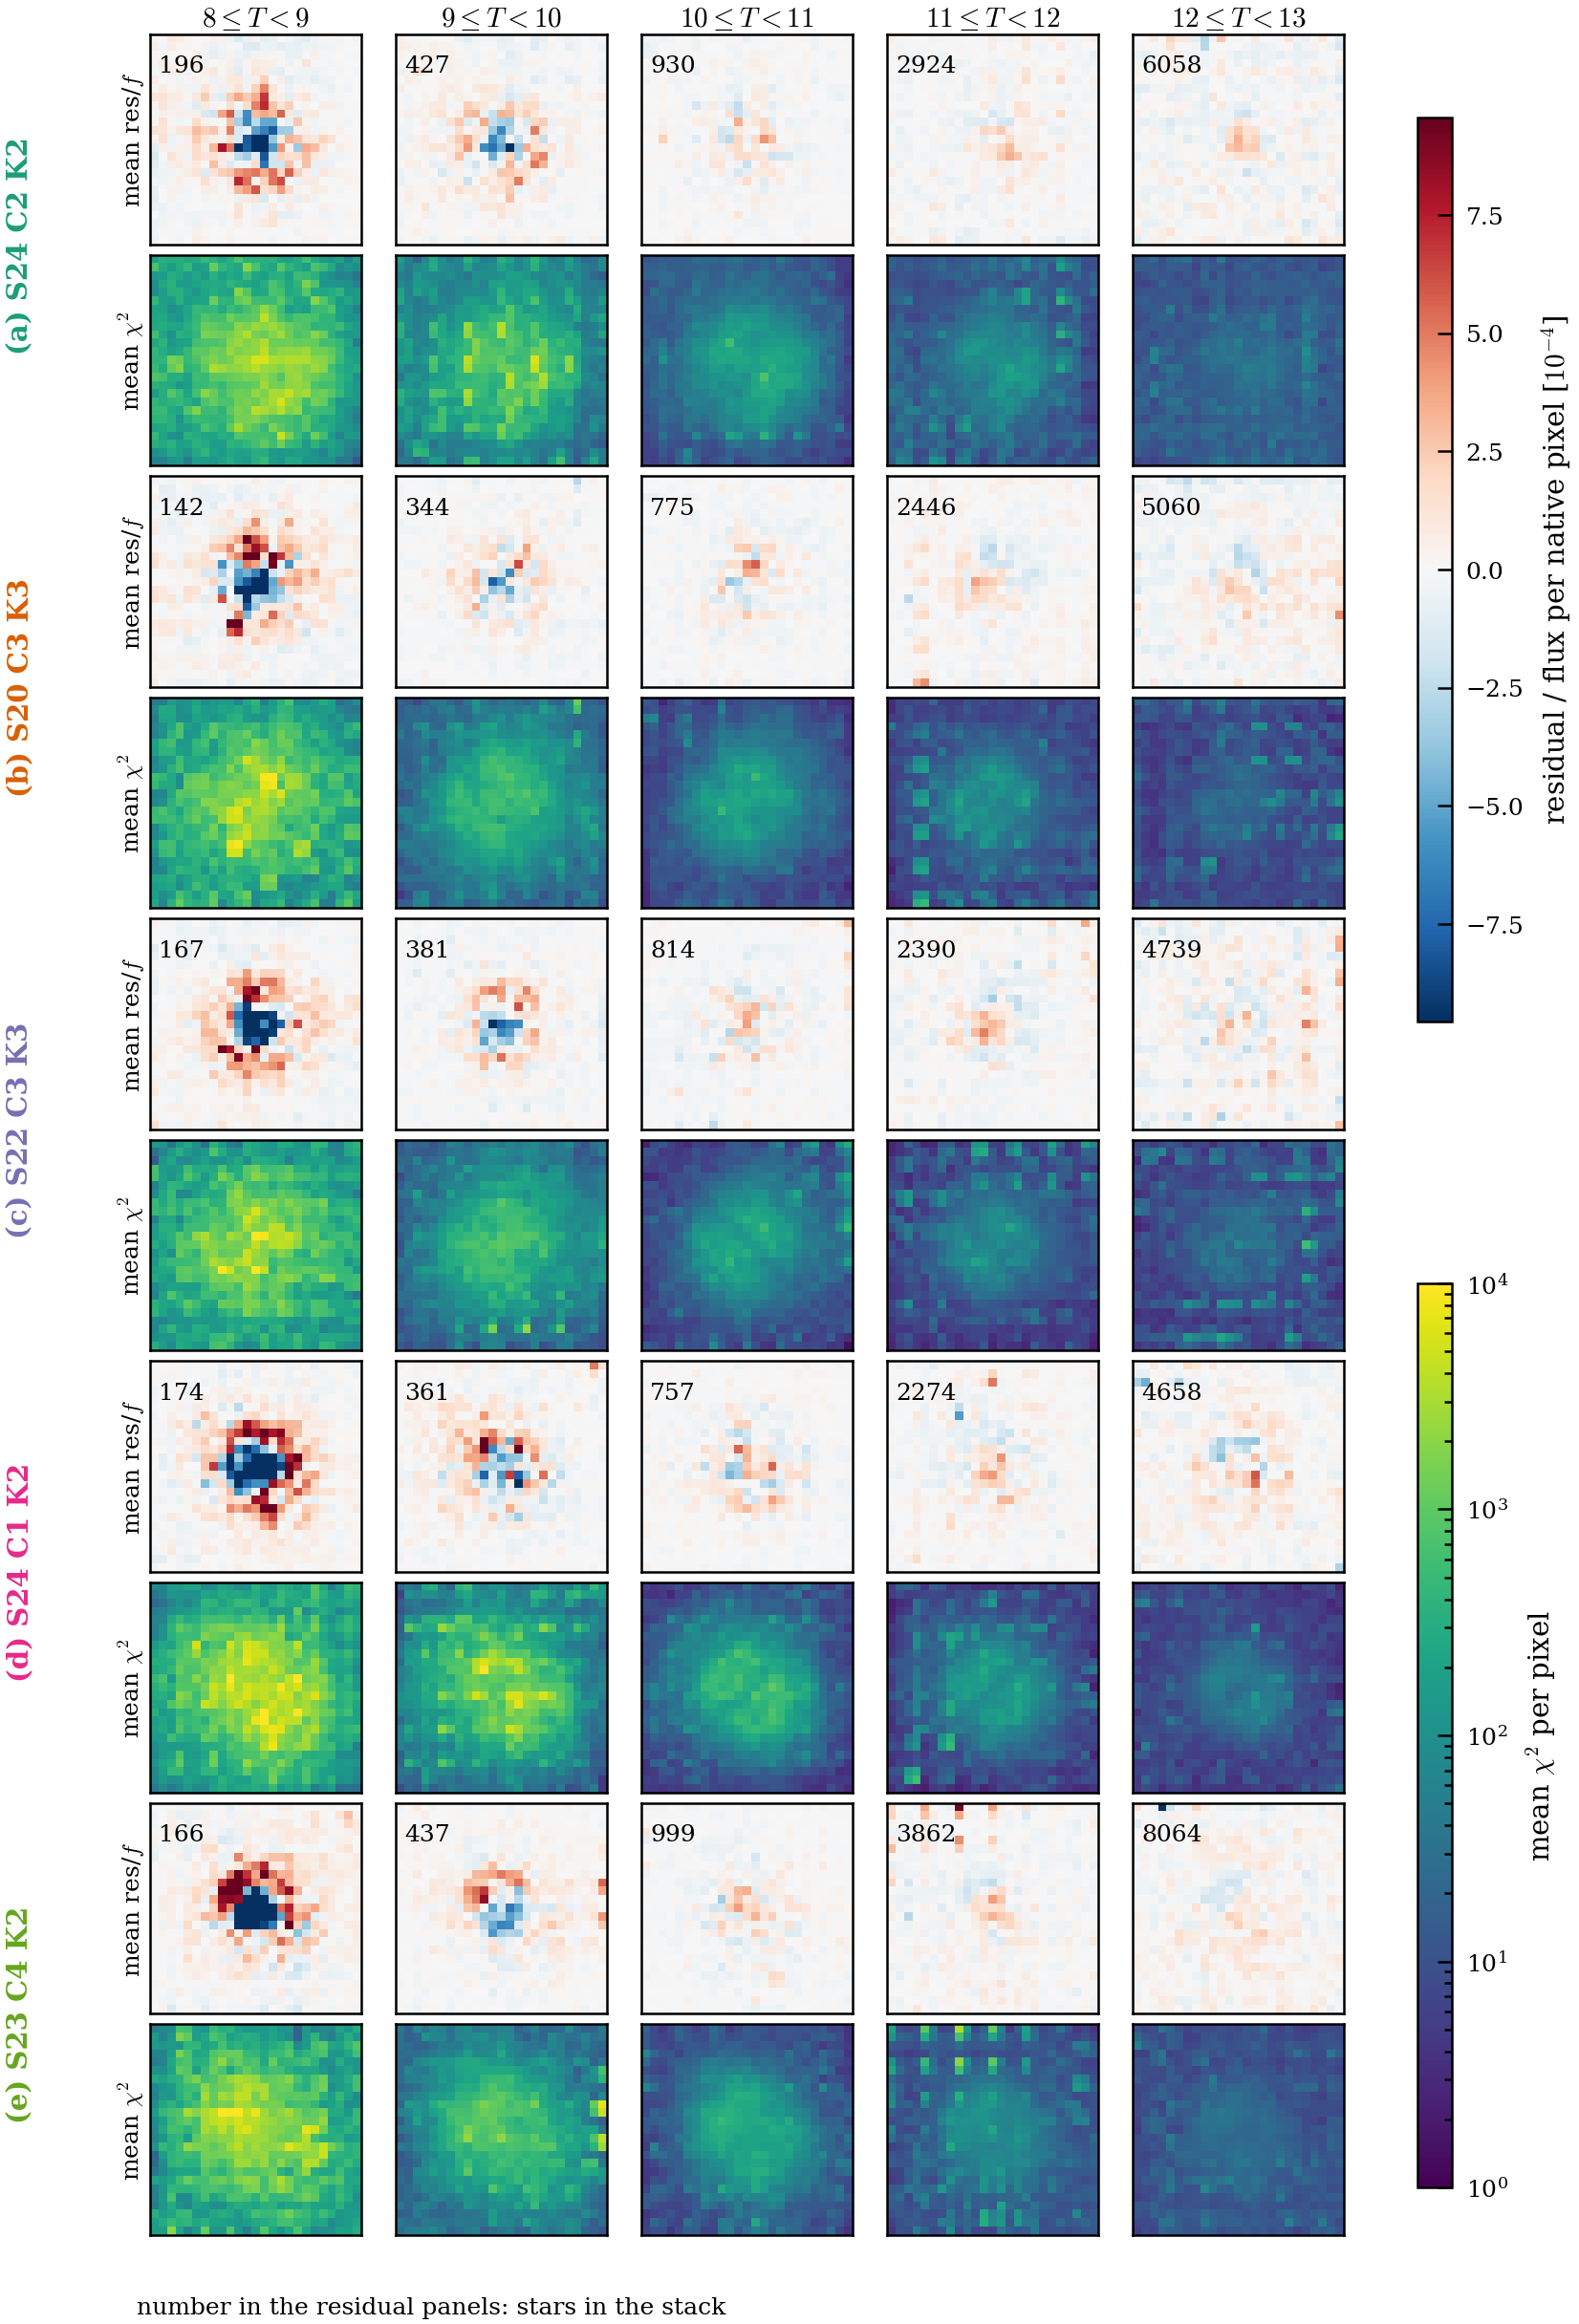
- Held-out stars are reproduced pixel by pixel to a few per cent of the peak (Fig. 15, stamps). Residuals at the bright end are a small, structured central pattern (score images).
- The median held-out $c^2$ per pixel falls from about 500 at $T=8$–9 to about 6 at $T=12$–13, and the held-out to in-training ratio is 1.2–1.3 at $T=8$–9 (Table 3).
- The colour terms lower the $c^2$ at every brightness (Table 4).
Held-out stars of F1 (left) and F2 (right) nearest the CCD centre in each magnitude bin ($T=8$ to 13). Columns: data, model, residual (shared scale as a percentage of the peak) and residual in units of the noise. The cross marks the fitted position, grey pixels are masked, and $c^2$ is the mean $\chi^2$ per pixel within the star's core ($r\le3$ px), $\chi^2=(D_p-m_p)^2/\sigma_p^2$.
Other fields (S22, C1, C4)
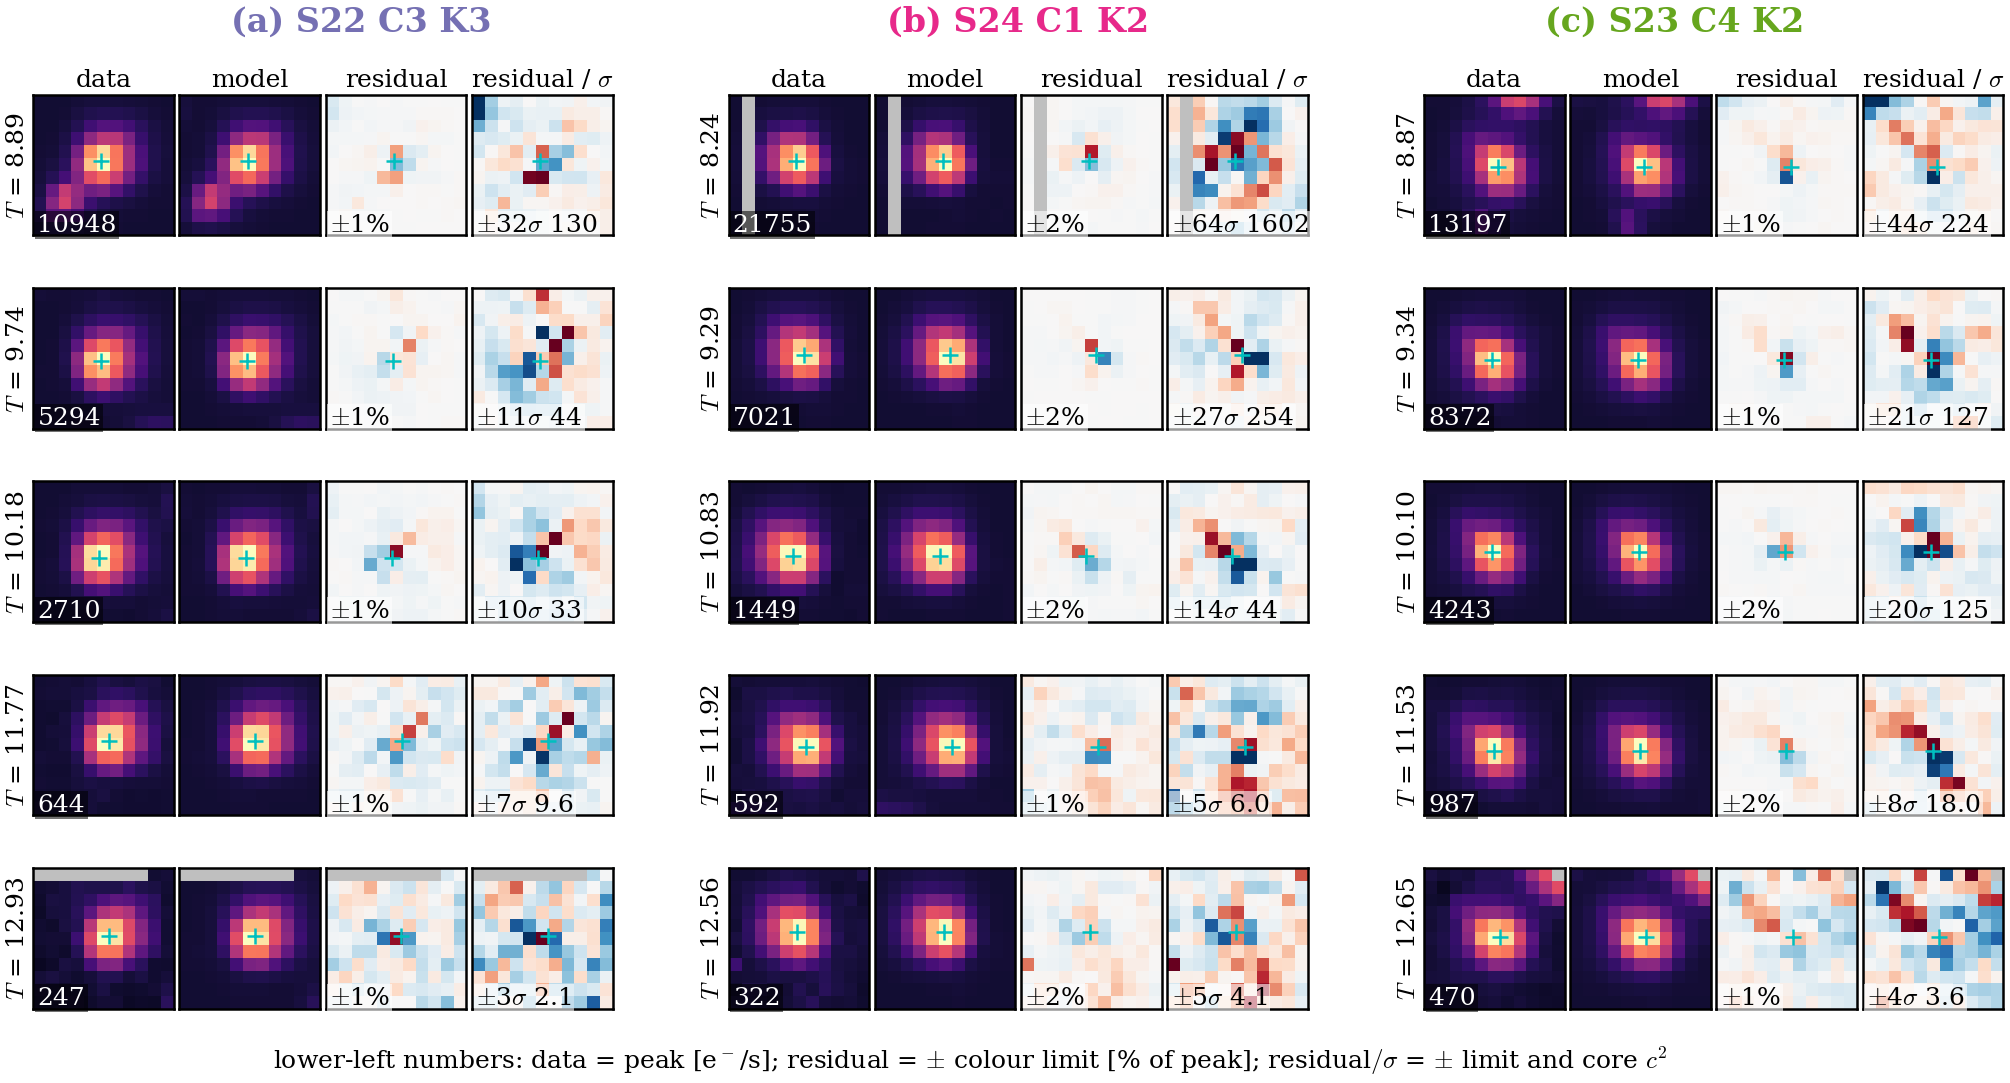
(a) Median core $c^2$ per pixel against $T$, held-out (solid) and in training (dashed), for five fields. (b) Held-out over in-training ratio. (c) Median held-out $c^2$ against colour offset. (d, e) Learning curves of the held-out median $c^2$ for the shape and colour stages. (f) Fractional decrease of the training loss per step against the stop-rule tolerance.
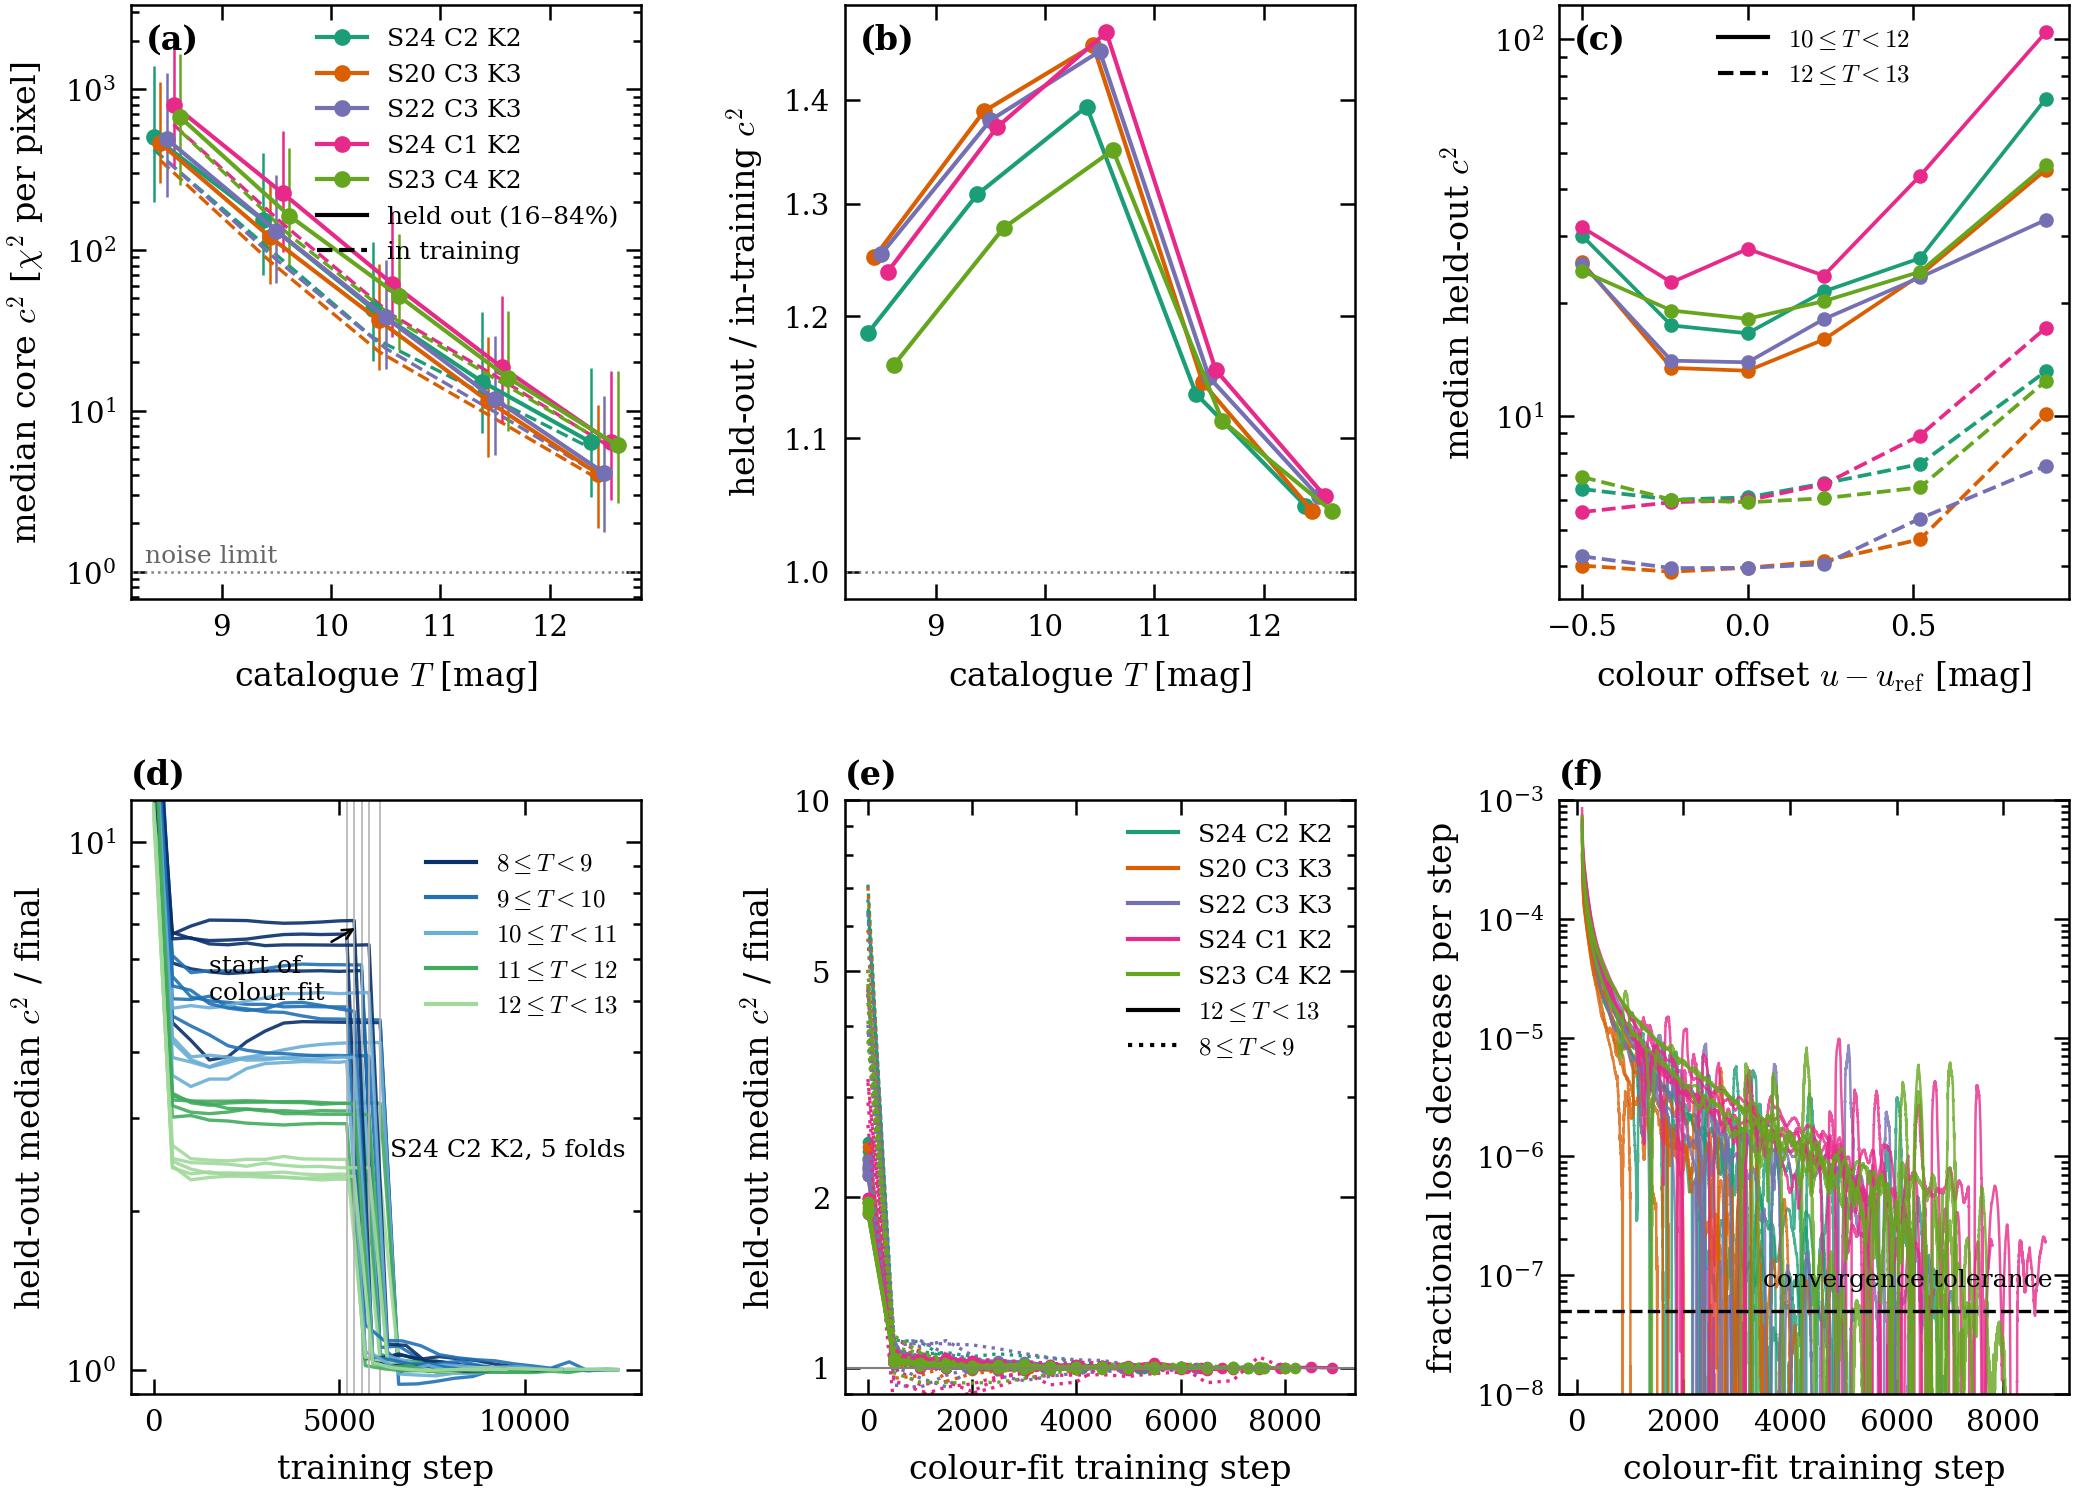
Mean held-out residual divided by flux (top rows, shared colour scale) and mean $\chi^2$ per pixel (bottom rows) for stars of five magnitude bins in each field, with the number of stars. At $T=8$–9 a central deficit with a positive ring is visible in every field; it is the brightness effect of §5.3. Fainter bins show only weak structure.
For each field: held-out cores, colour range, WCS bias and scatter against the FFI header WCS on the same stars, median core $c^2$ in three magnitude bins, held-out over in-training ratio at $T=8$–9, and the photometric scatter and colour slope against Gaia-XP (§6.2).
| FFI | held-out cores | colour $u-u_{\rm ref}$ 5–95% | WCS bias x, y [mpx] | WCS σ x, y [mpx] | header WCS σ x, y [mpx] | median $c^2$ T8–9 / 10–11 / 12–13 | held/in-training T8–9 | Δm σ T10–12 [mmag] | Δm colour slope [mmag/mag] |
|---|---|---|---|---|---|---|---|---|---|
| S24 C2 K2 | 10,536 | -0.31 … +0.49 | -0.2, +0.2 | 6.2, 4.9 | 24, 31 | 505 / 43 / 6.4 | 1.2 | 12.0 | +37 ± 1 |
| S20 C3 K3 | 8,767 | -0.31 … +0.51 | +0.0, -0.1 | 4.5, 4.9 | 23, 26 | 461 / 36 / 4.1 | 1.3 | 12.0 | +35 ± 1 |
| S22 C3 K3 | 8,491 | -0.30 … +0.49 | -0.0, -0.0 | 4.9, 5.2 | 19, 24 | 488 / 38 / 4.1 | 1.3 | 11.6 | +36 ± 1 |
| S24 C1 K2 | 8,224 | -0.31 … +0.53 | -0.6, -0.3 | 7.3, 5.9 | 20, 16 | 797 / 62 / 6.4 | 1.2 | 12.6 | +40 ± 1 |
| S23 C4 K2 | 13,528 | -0.32 … +0.47 | +0.0, +0.0 | 5.1, 5.0 | 27, 20 | 671 / 52 / 6.1 | 1.2 | 14.3 | +38 ± 1 |
Red minus blue radial shift of $T=10$–13 stars, measured and modelled, the remaining difference, and the median held-out $c^2$ with the colour terms off and with the adopted model, in three magnitude bins.
| FFI | red − blue radial shift, measured [mpx] | model [mpx] | remaining [mpx] | $c^2$ colour-off / adopted, T8–9 / 10–11 / 12–13 | all held-out |
|---|---|---|---|---|---|
| F1 S24 C2K2 | -64.8 | -62.3 | +0.2 ± 0.4 | 5.07 / 3.55 / 1.80 | 2.19 |
| F2 S20 C3K3 | -48.4 | -46.6 | -0.3 ± 0.3 | 4.84 / 3.53 / 1.76 | 2.11 |
| S22 C3K3 | -51.8 | -50.2 | -0.3 ± 0.3 | 5.13 / 3.00 / 1.68 | 1.97 |
| C1 S24 C1K2 | -53.1 | -49.6 | -0.3 ± 0.5 | 3.16 / 2.26 / 1.61 | 1.81 |
| C4 S23 C4K2 | -40.1 | -38.6 | +0.7 ± 0.2 | 4.69 / 2.83 / 1.49 | 1.72 |
6 Consequences
6.1 Astrometry
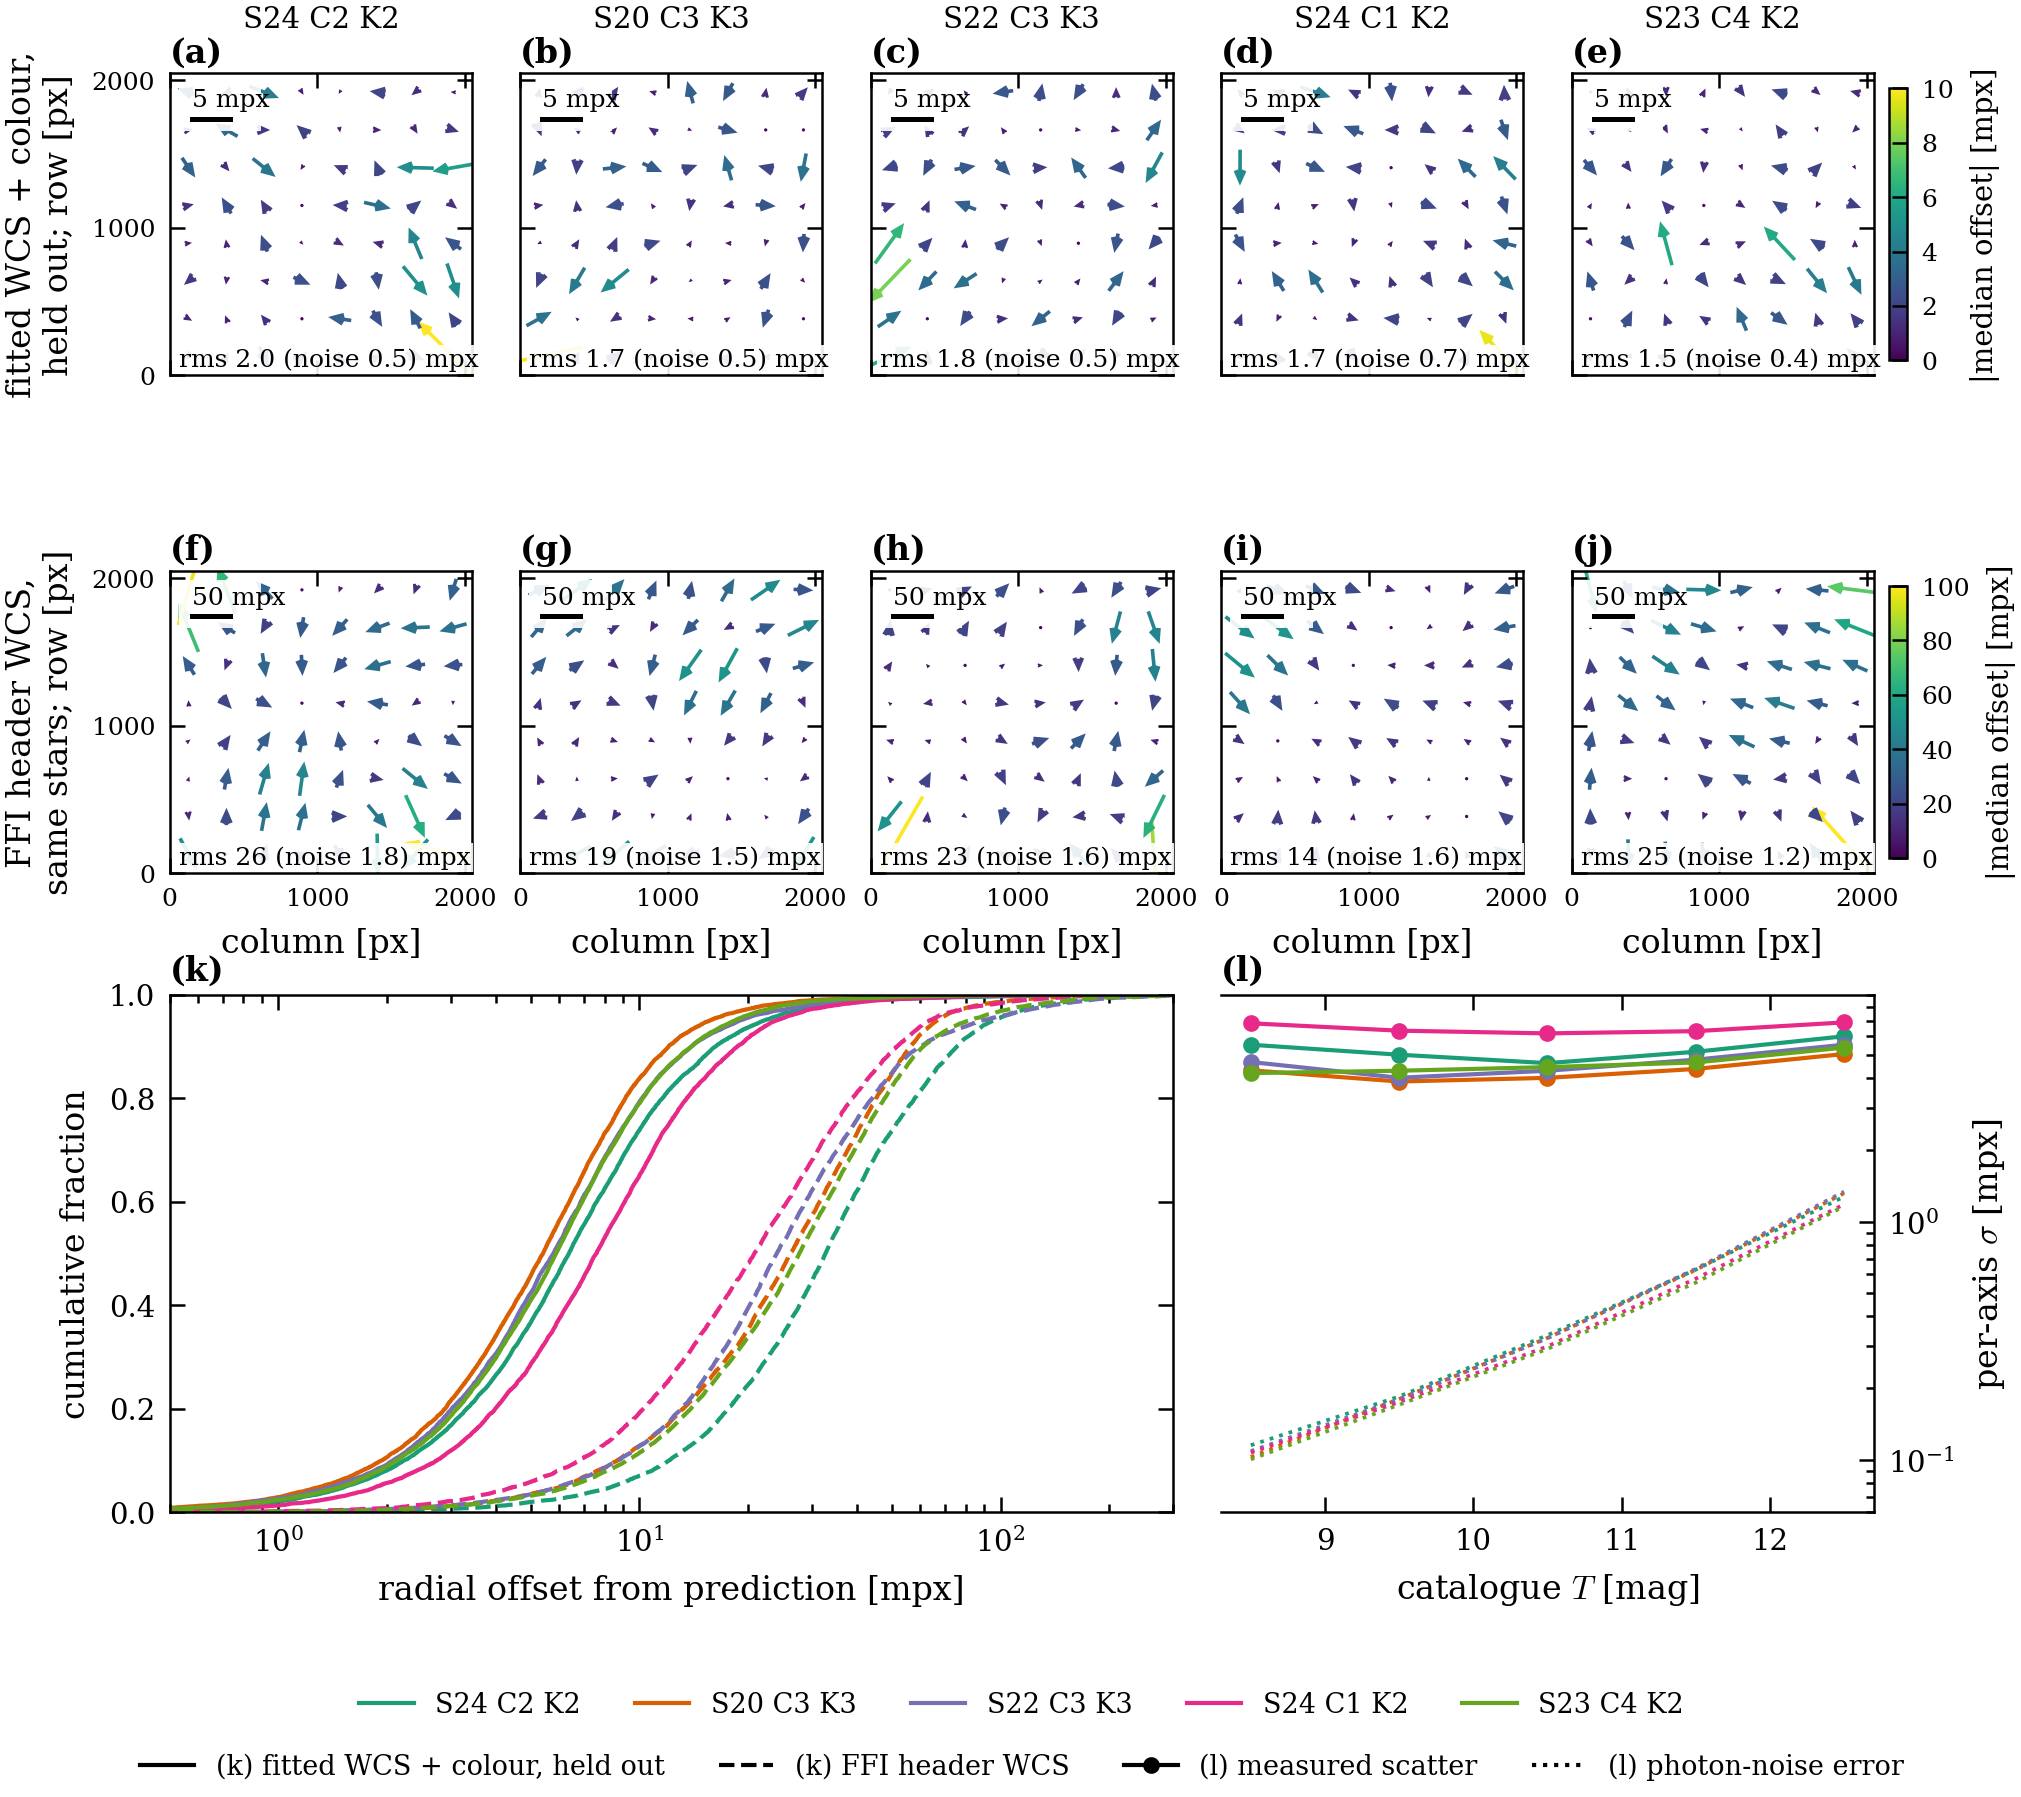
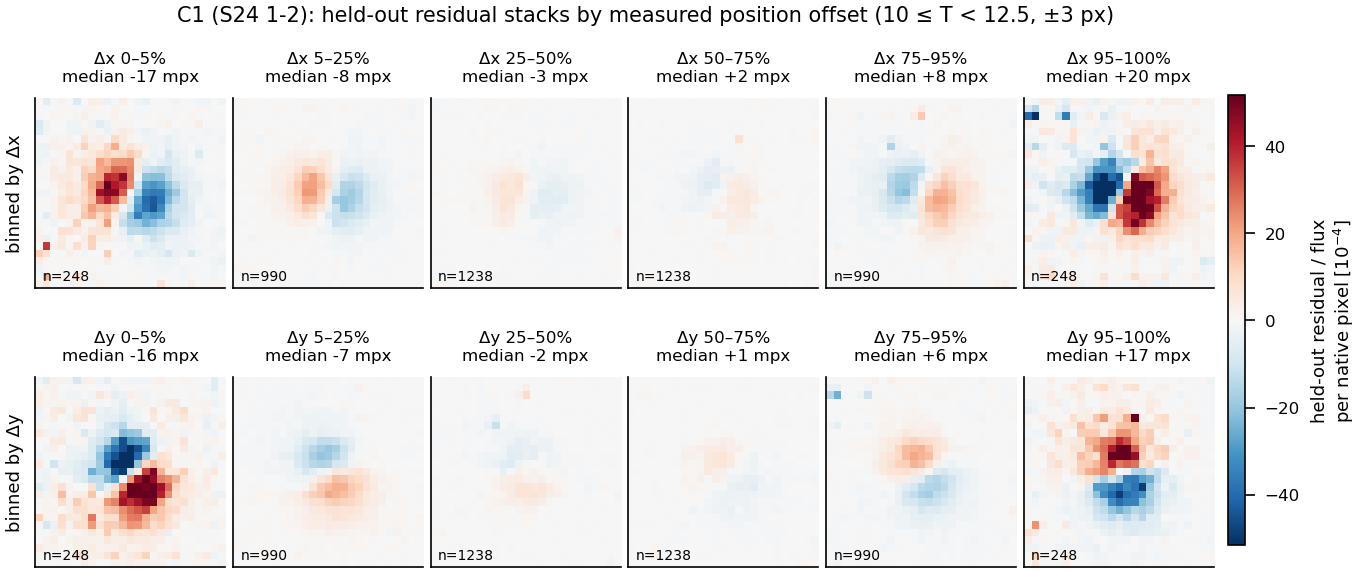
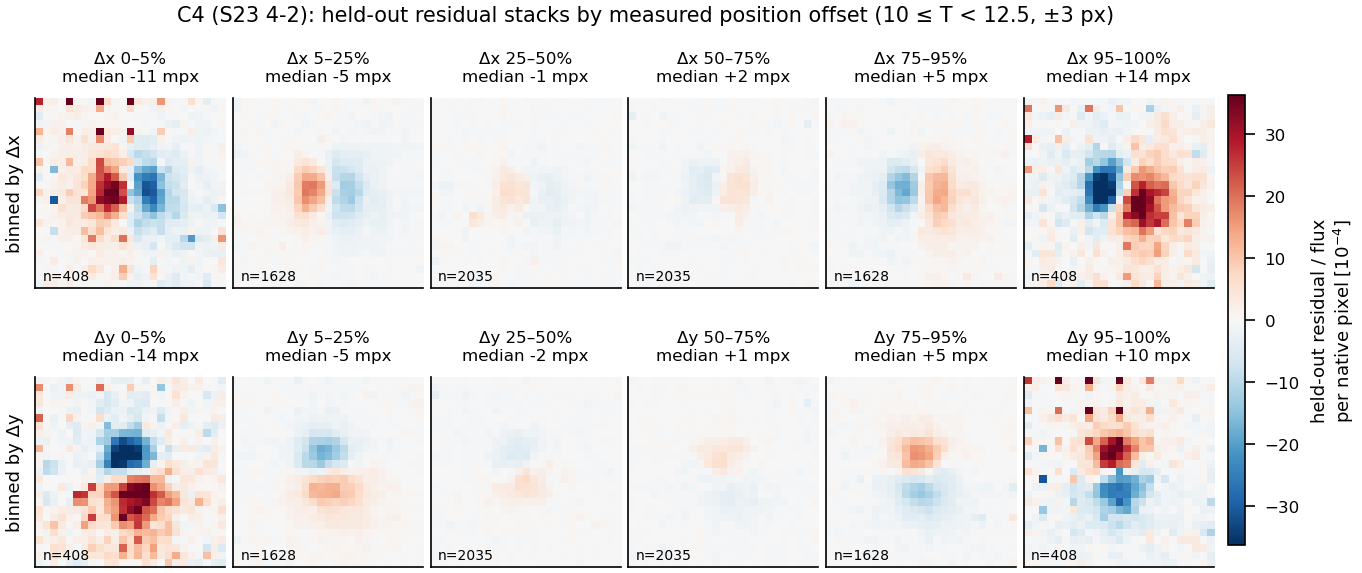
- Held-out stars, scored with the fits that did not use them, have a per-axis position scatter of 4.5–7.3 mpx with the fitted WCS and colour model, against 16–31 mpx with the FFI header WCS on the same stars (to update).
- The scatter is flat with magnitude while photon noise runs 0.1–1.2 mpx, so it is a systematic floor, not noise. Cell-median maps leave a coherent 1.5–2 mpx pattern, largest at the CCD edges and corners.
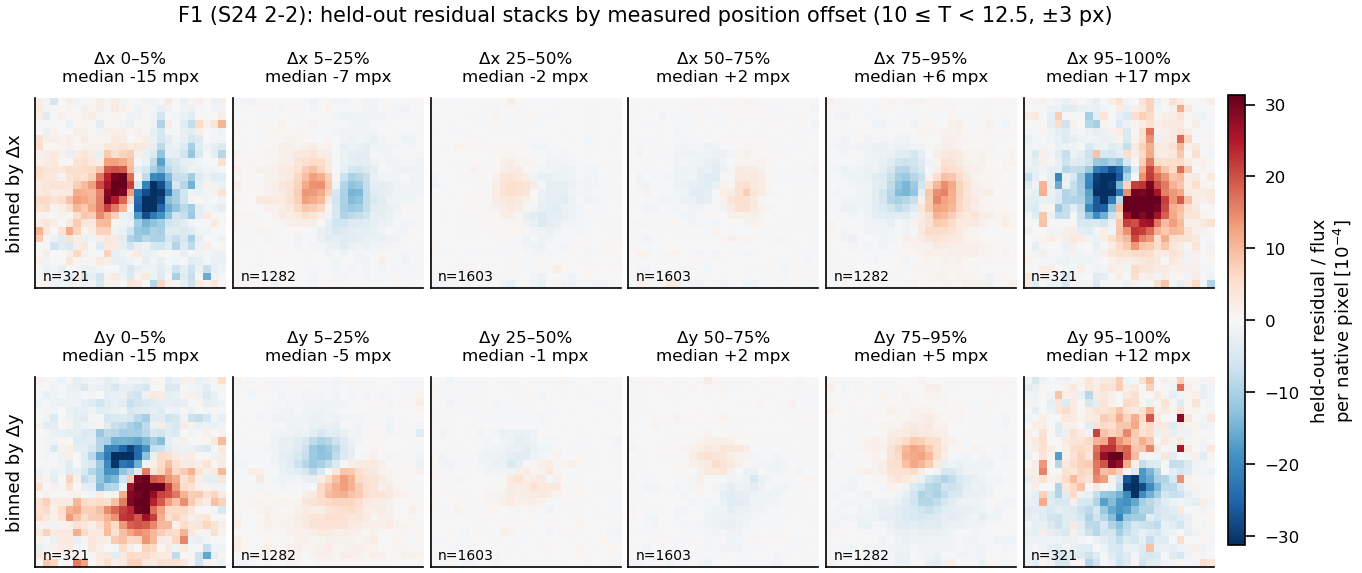
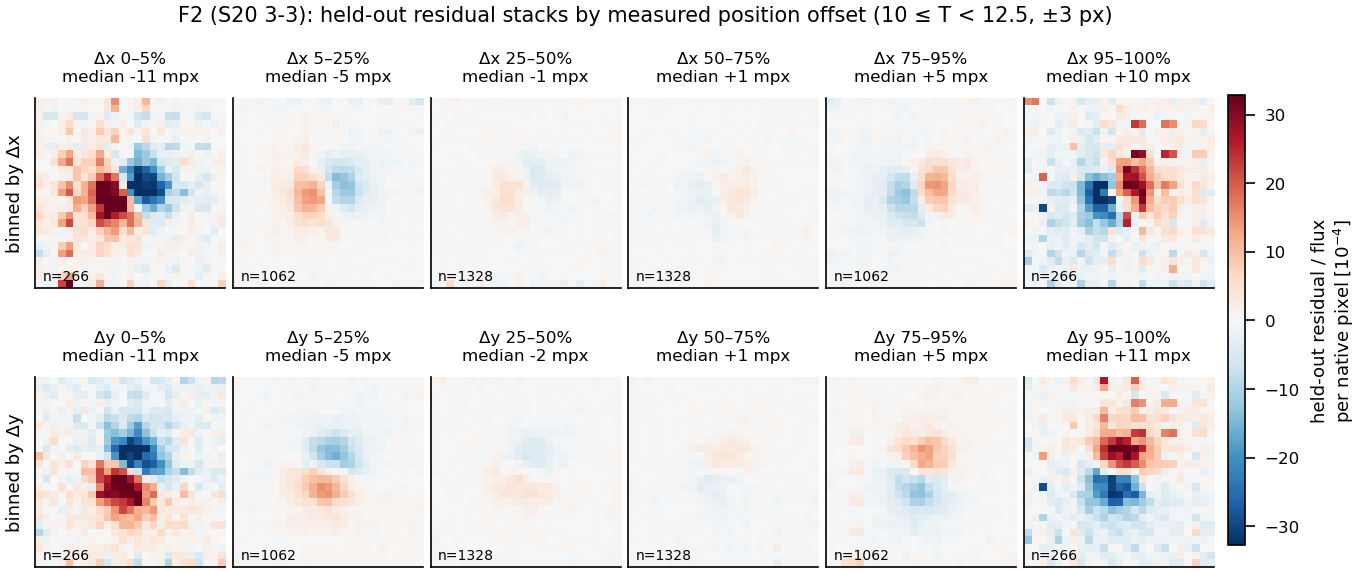
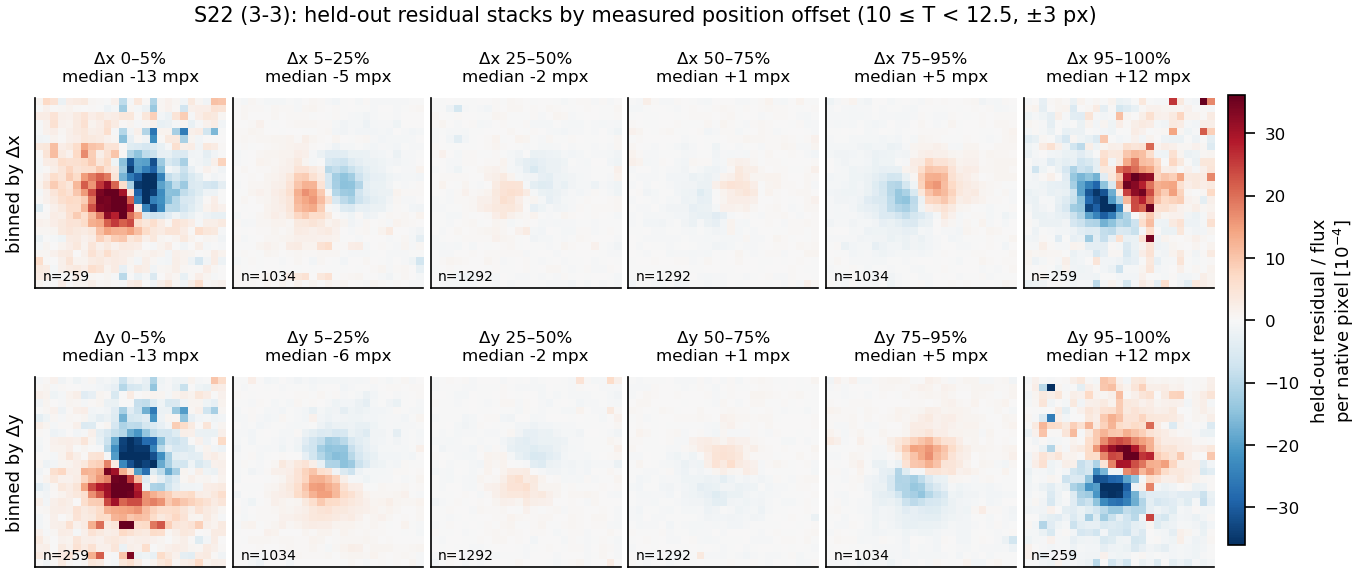
Top: cell-median position offsets of held-out stars with the fitted WCS and colour model (arrows, scale 5 mpx). Middle: the same stars with the FFI header WCS (scale 50 mpx). Bottom left: cumulative distribution of the radial offset with a constant offset removed. Bottom right: measured per-axis scatter against $T$, against the photon-noise error. The stacked residuals of stars binned by measured offset show clean dipoles whose sign follows the offset, so the offsets are real image shifts.
Images behind it: residual stacks binned by measured offset, per field
6.2 Bright-star photometry
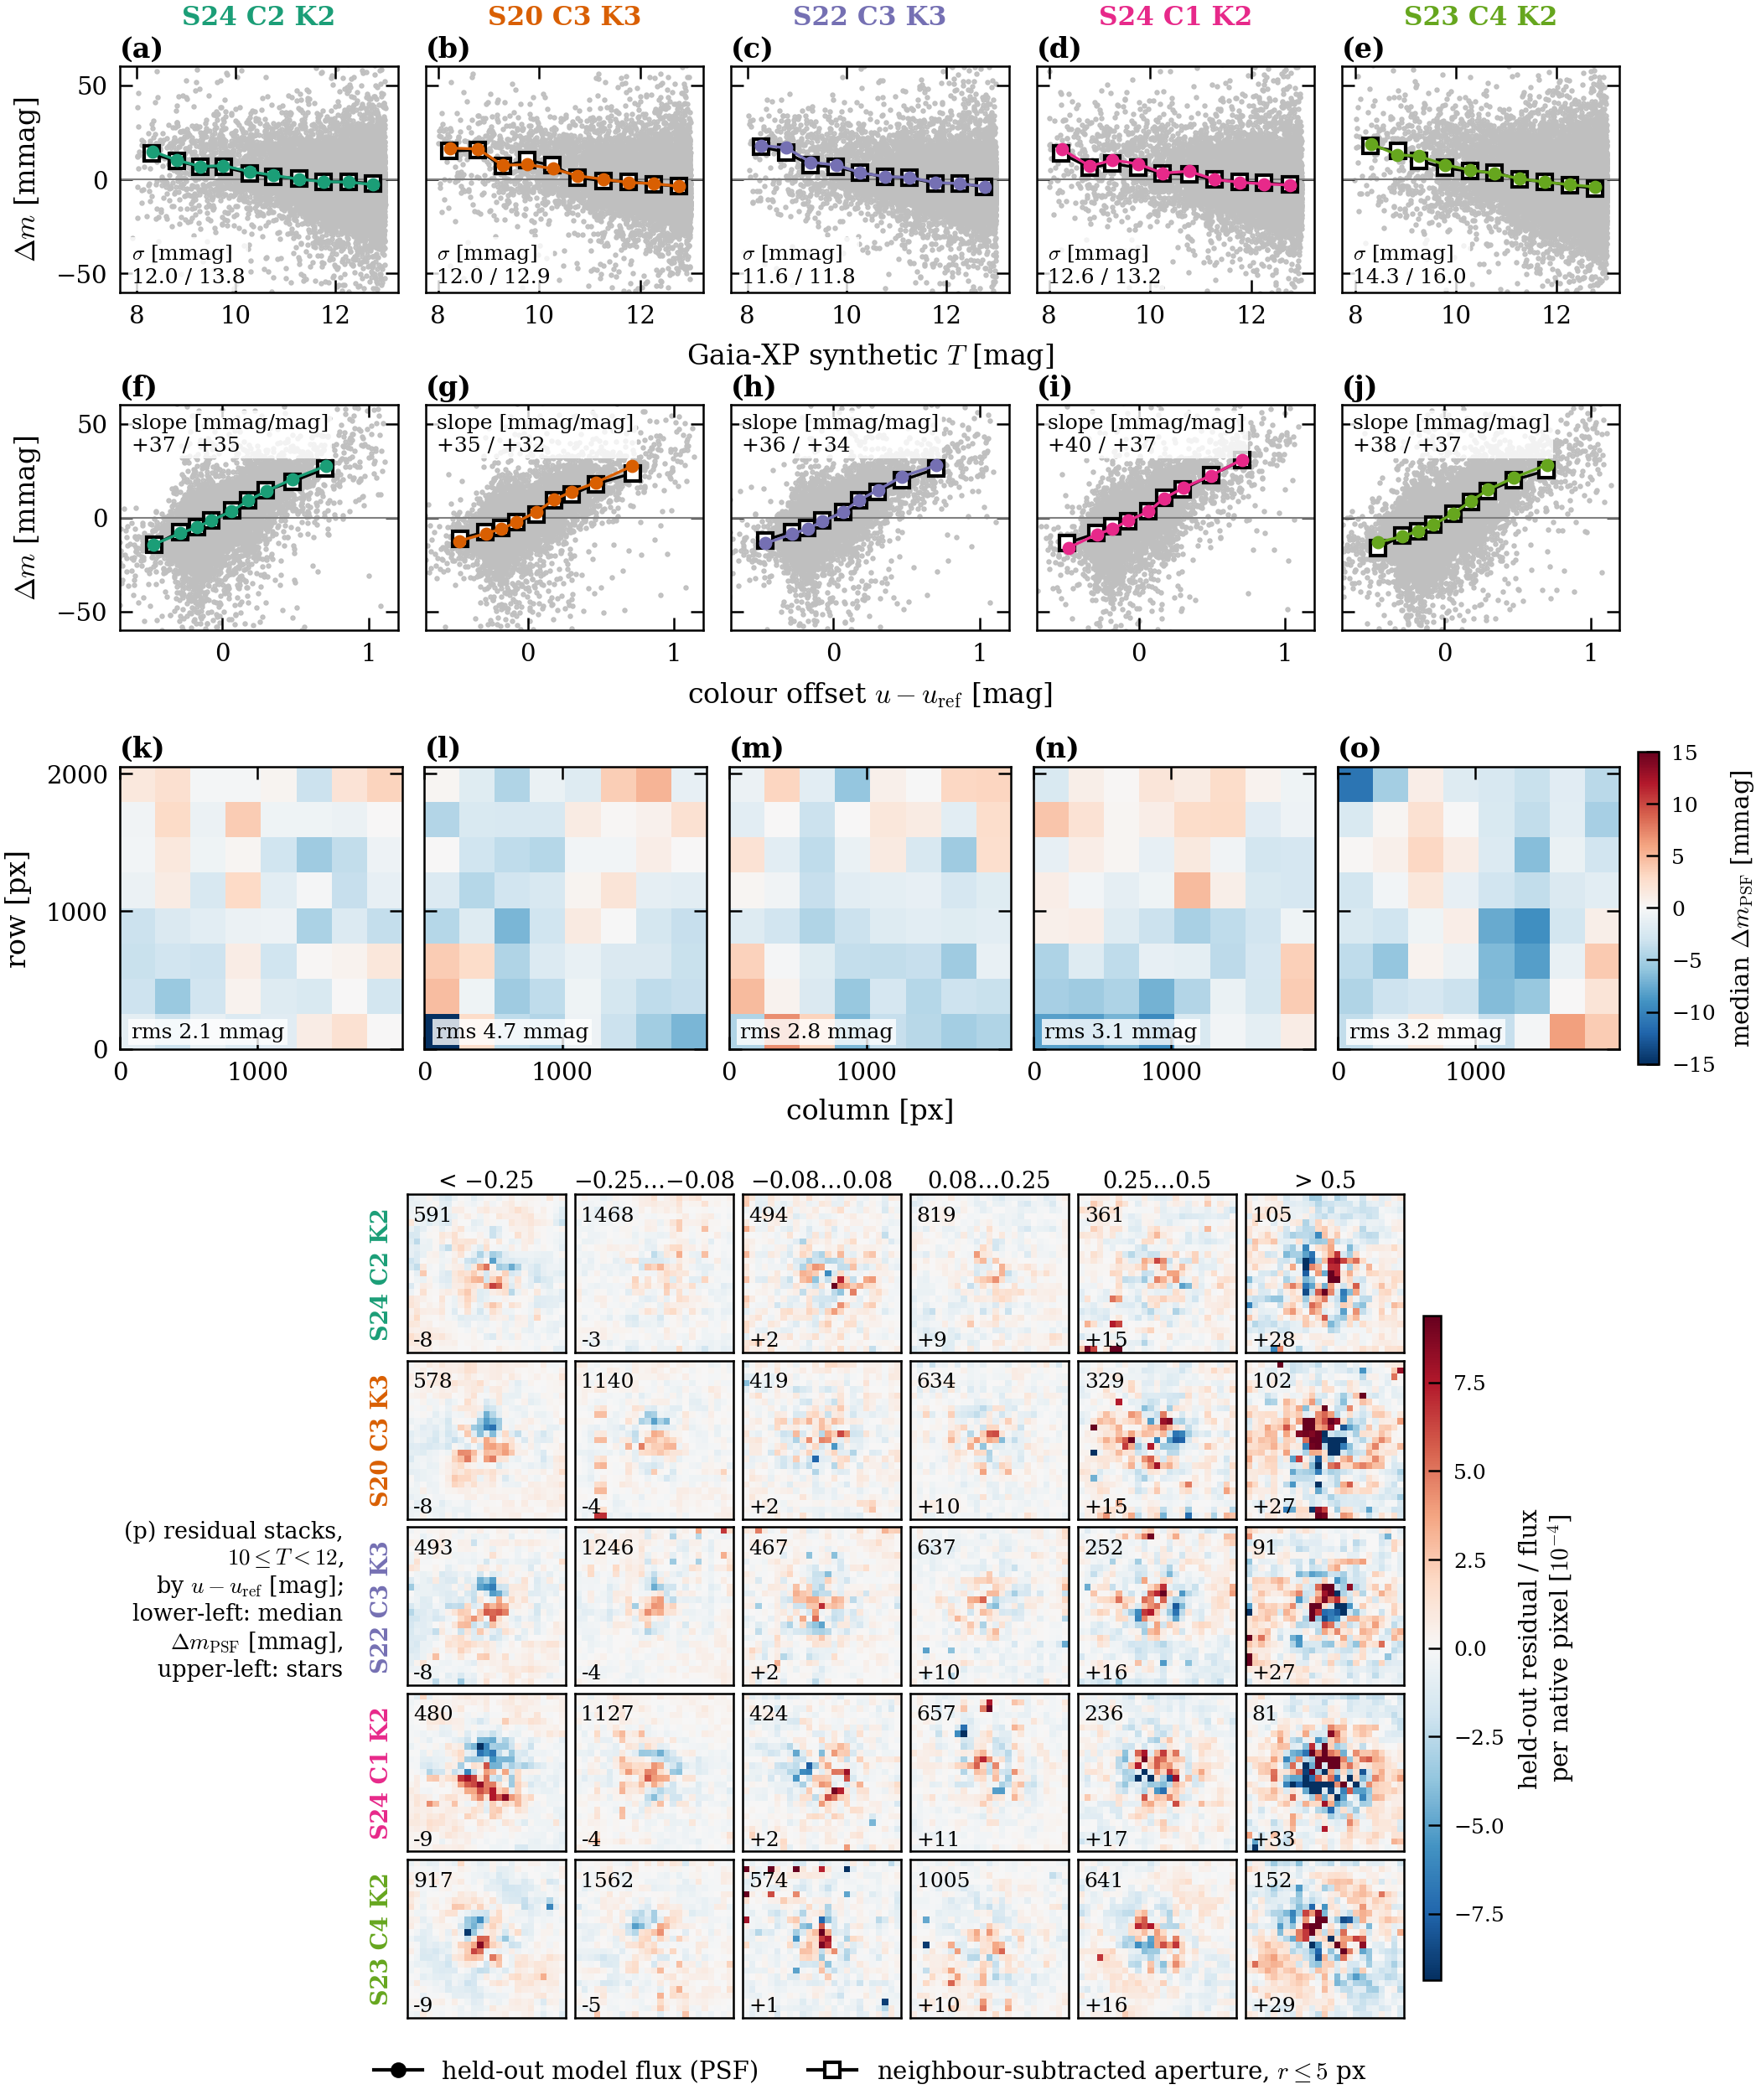
- Held-out PSF fluxes agree with Gaia-XP synthetic TESS magnitudes with a scatter of 11.6–14.3 mmag at $T=10$–12 (to update). Neighbour-subtracted aperture fluxes give the same.
- Magnitude differences depend on colour with a slope of +35 to +40 mmag per mag of colour offset. This slope uses the colour offset $u-u_{\rm ref}$ and Gaia-XP spectra extended beyond 1020 nm with a power law; anchoring the red end to 2MASS $J$ and expressing the slope in $G_{\rm BP}-G_{\rm RP}$ gives the 25–30 mmag per mag of §7 (on the same stars the anchoring alone lowers it from 40.5 to 29.3 mmag per mag, so the extrapolated tail accounts for about a quarter).
- Held-out magnitudes run faint relative to Gaia-XP for the brightest stars: the pooled $\Delta m$ is $+15$ mmag at $T=8$–9 and $-3$ mmag at $T=12$–13, the same in all five fields (to update). It appears equally with neighbour-subtracted apertures and does not change with aperture radius from 5 to 12 px, so it is not light outside the PSF model. About a third of the faint-end slope is a magnitude-dependent calibration error of the Gaia XP spectra: with the corrected XP spectra of Huang et al. (2024) the excess at $T=8$–9 drops to $+11$ mmag and the slope to about 2 mmag per mag. The remainder is not explained by any reference correction and is most likely on the TESS side; we report it as a limit of the absolute flux scale at the bright end.
- Held-out fluxes also depend weakly on where a star falls within a pixel: stars centred on a pixel are 1.5–2.5 mmag fainter than stars near a corner, mostly along columns. The dependence is the same for PSF and aperture fluxes and at all magnitudes, so it is a property of the detector's intra-pixel response that a single pixel-integrated ePSF cannot represent; it limits the flux accuracy at the $\le0.25$ % level.
Magnitude difference $\Delta m$ between held-out fluxes and Gaia-XP synthetic $T$ against $T$ (top row), against colour offset (second row; slopes in mmag per mag), as median maps over the CCD (third row; cell rms 2.1–4.7 mmag), and as residual stacks by colour bin (bottom). Circles are PSF fluxes, squares neighbour-subtracted aperture fluxes of radius 5 px. Held-out magnitudes run faint relative to Gaia-XP for the brightest stars, by about +15 mmag at $T\approx8.3$ falling to $-4$ mmag at $T\approx13$, identically in all five fields; this is a limit of the absolute flux scale at the bright end. Stars centred on a pixel are 1.5–2.5 mmag fainter than stars near a corner, a property of the detector's intra-pixel response that a pixel-integrated ePSF cannot represent.
6.3 Final de-crowded image with per-band kernels
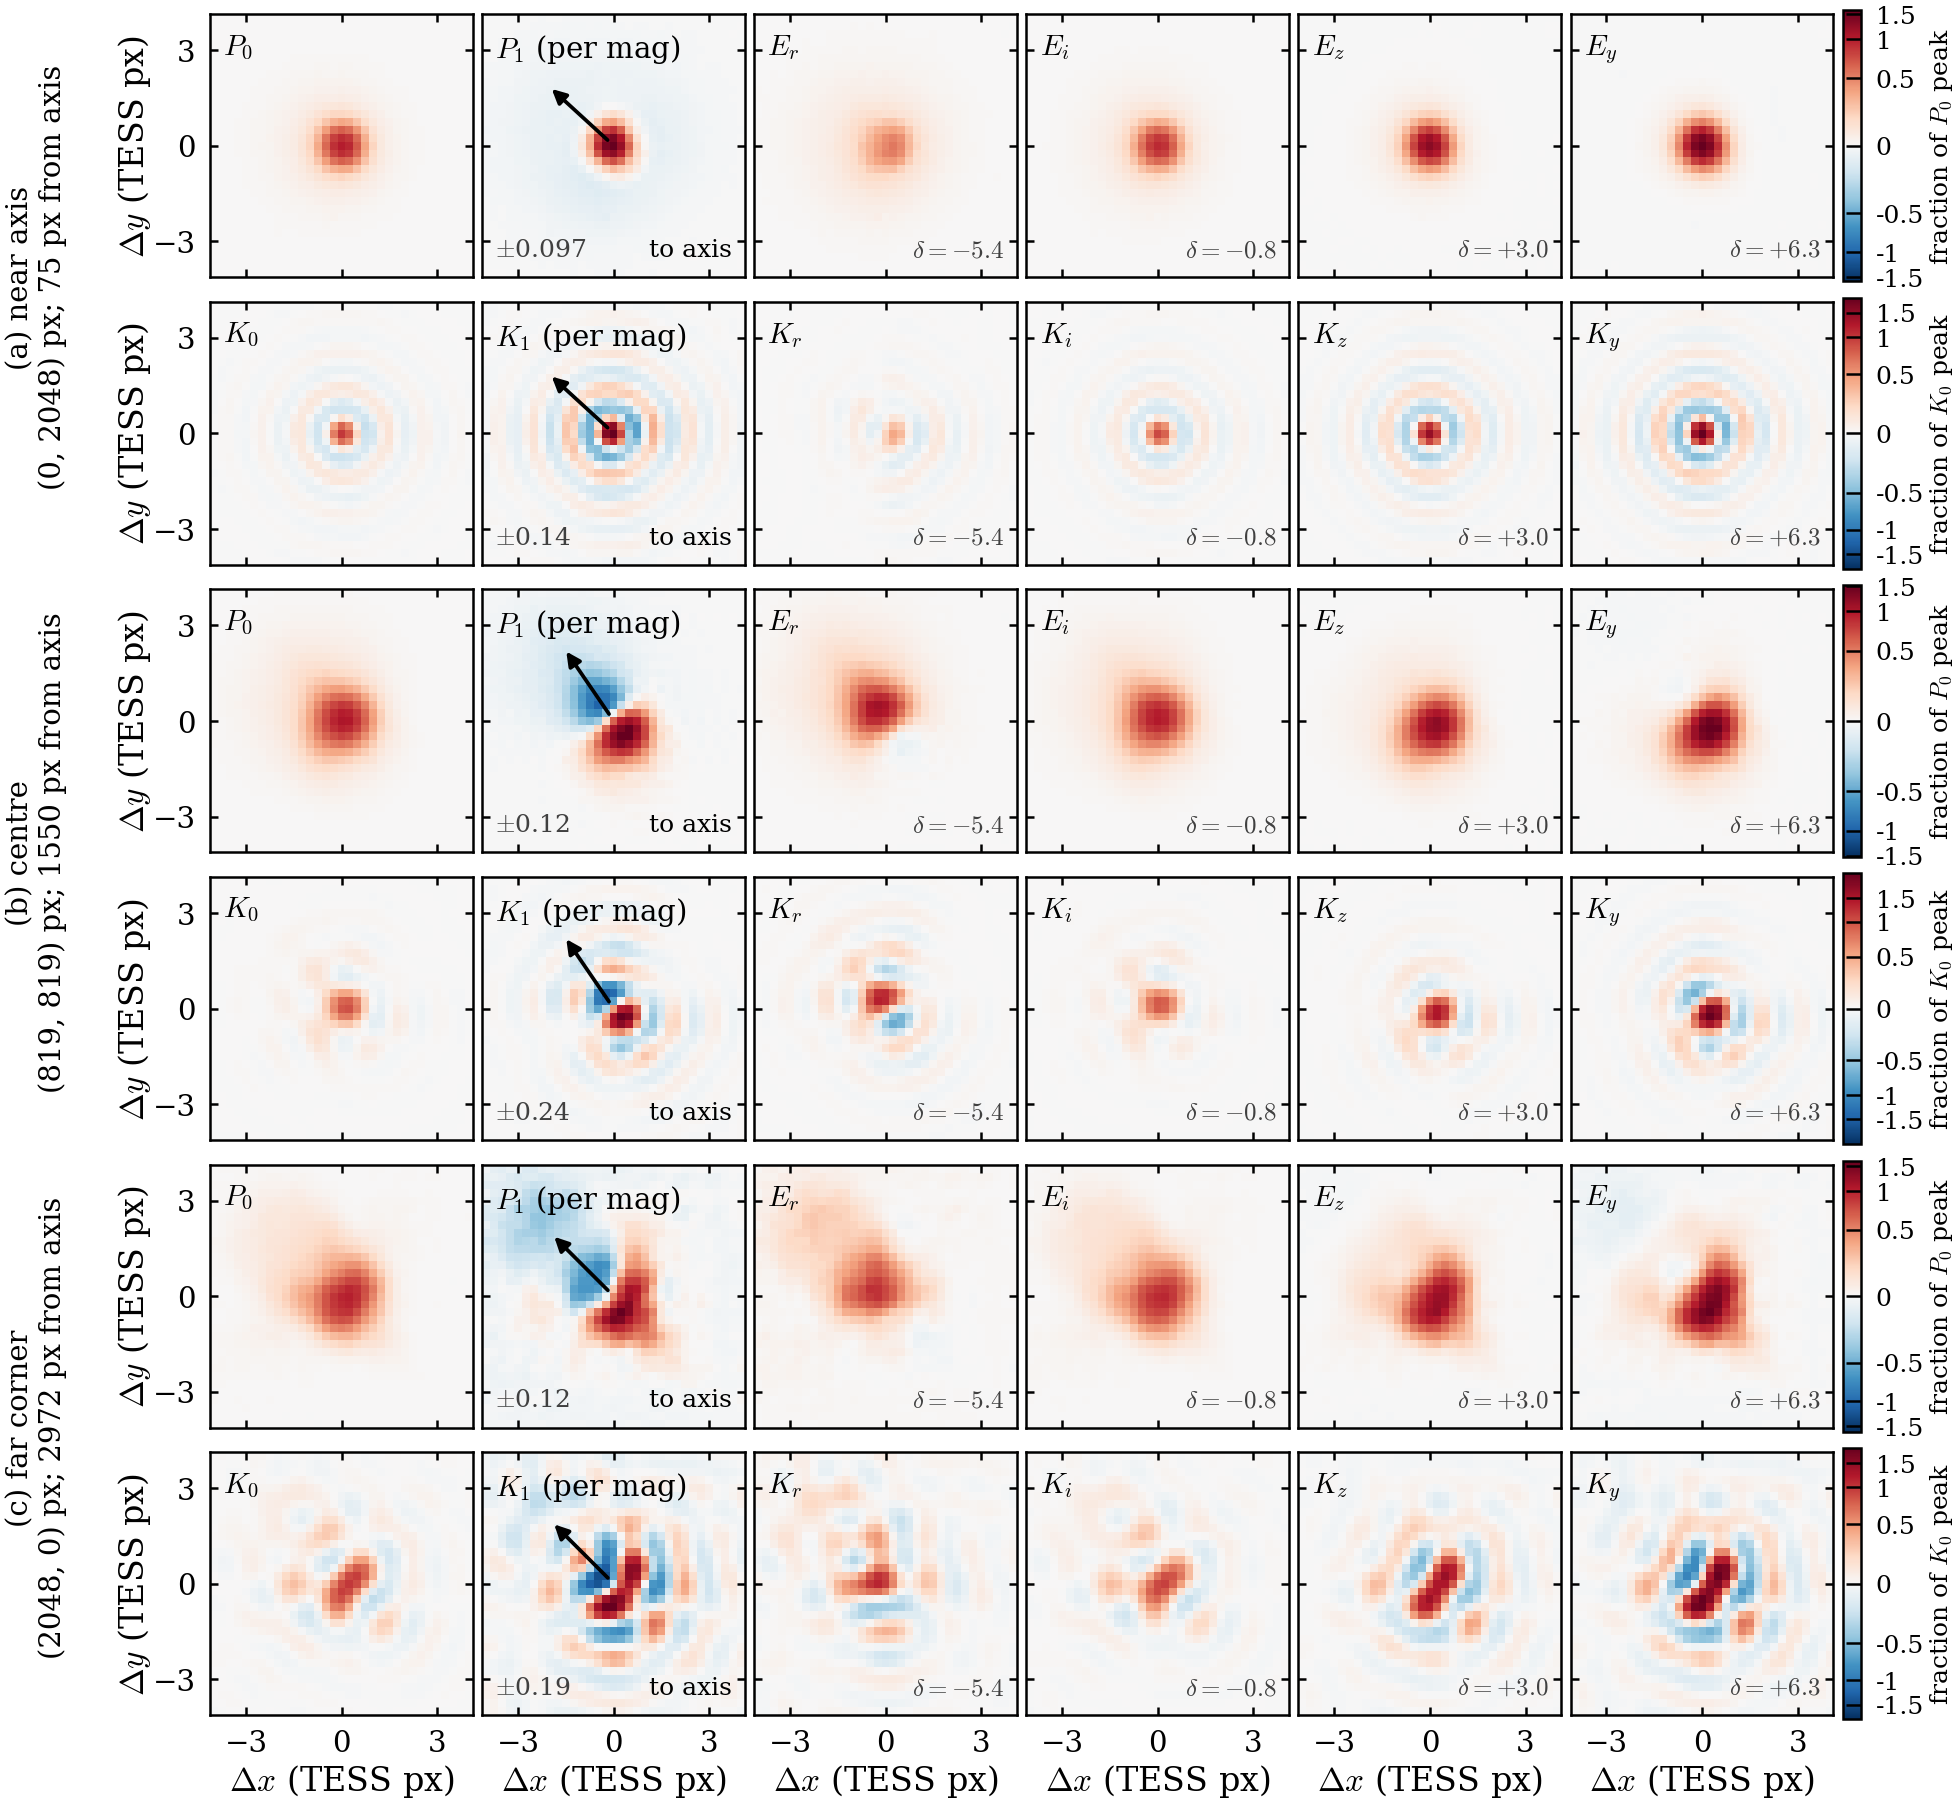
- For each PS1 band we evaluate the fitted ePSF at that band's colour and remove the smoothing already applied to the template, giving a kernel $K_b$ at every position. Each calibrated band template is convolved with its own kernel and the sum is subtracted from the background-corrected FFI: $$D_{\rm final}=(I-B)-\sum_b K_b\ast T'_b .$$ Here $T'_b$ is the calibrated band template (§2.5) rebuilt on the fitted WCS, and $K_b$ the band-$b$ kernel.
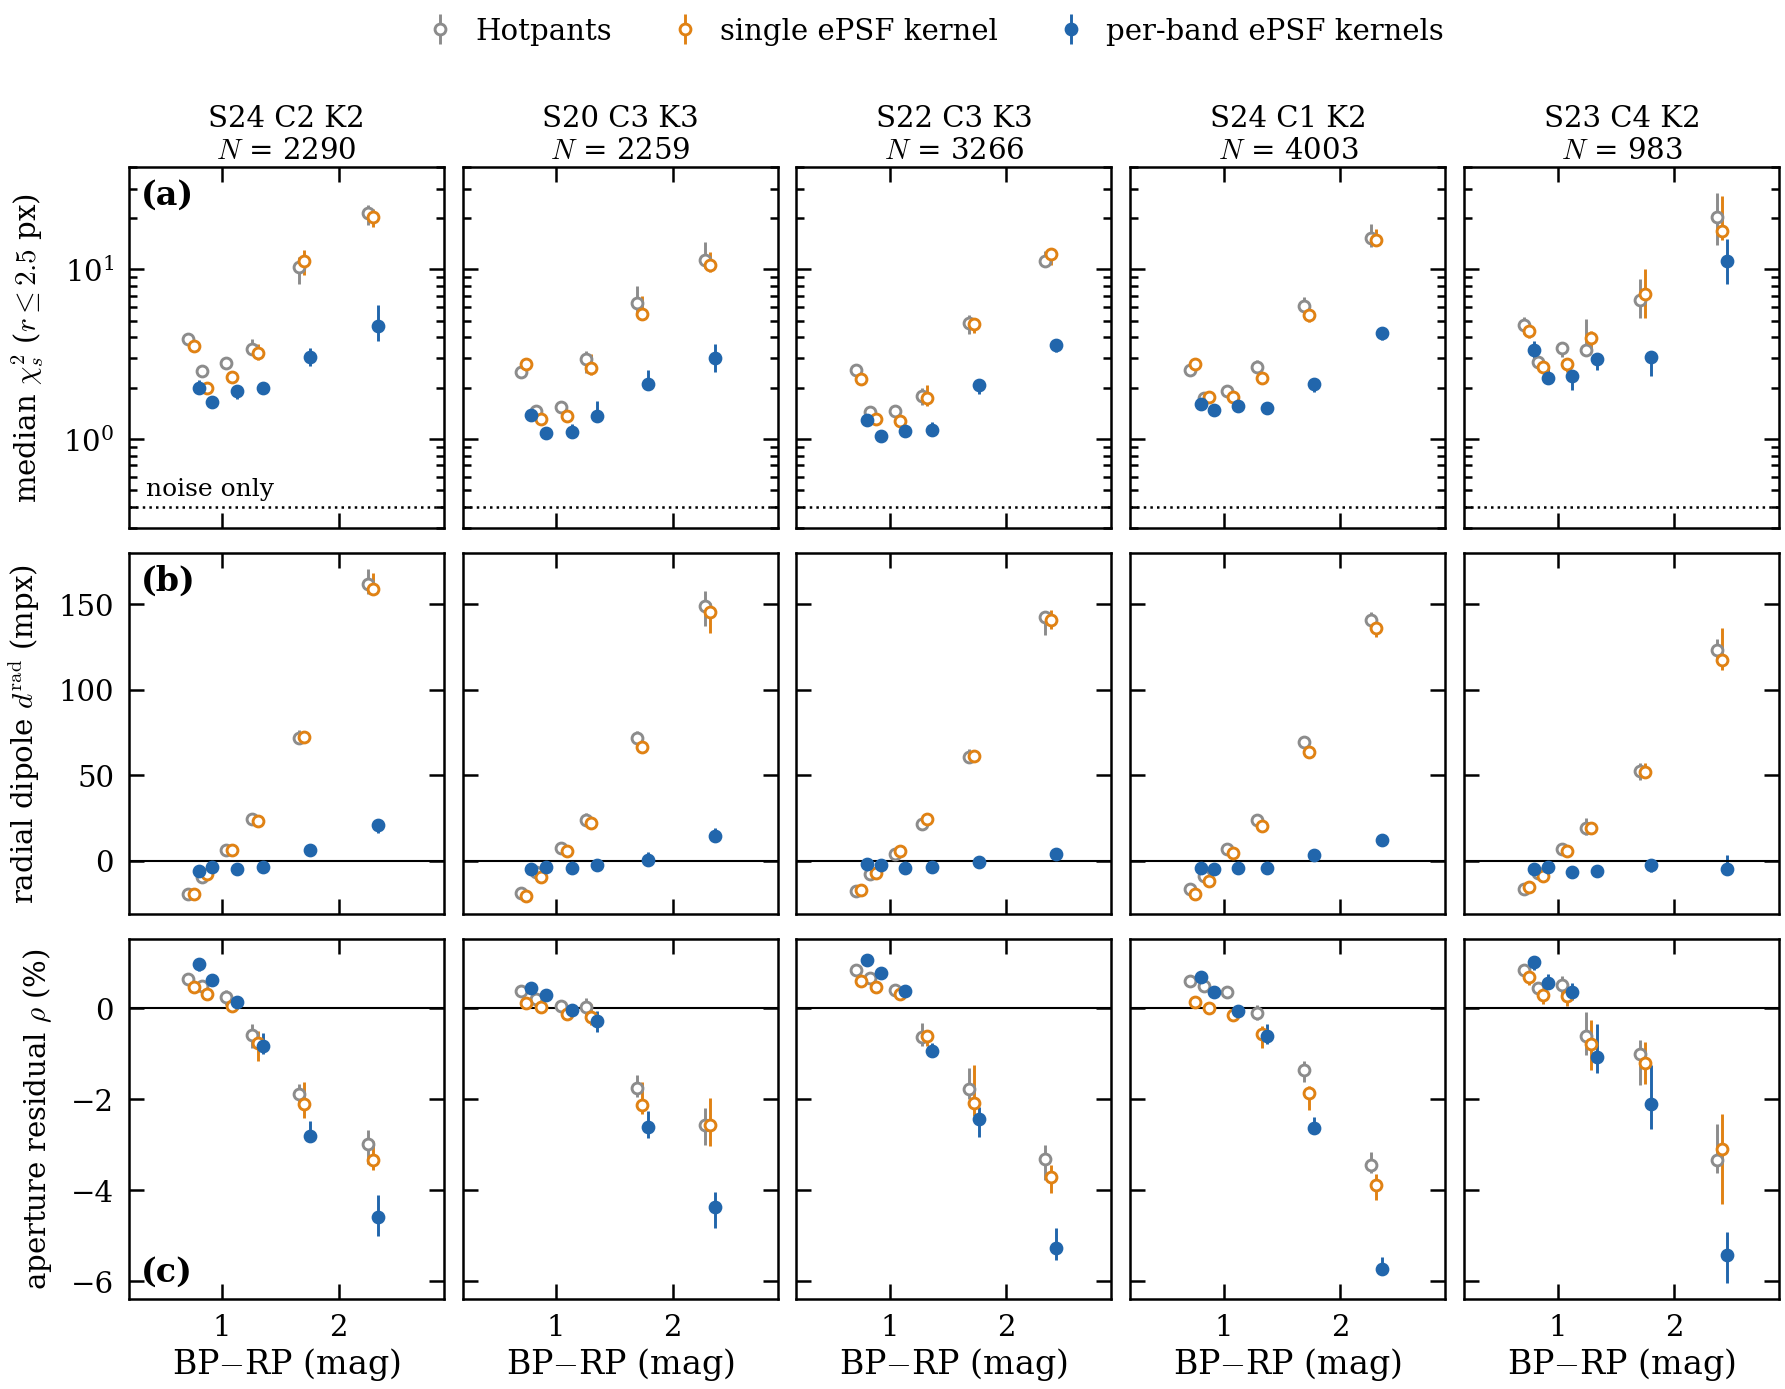
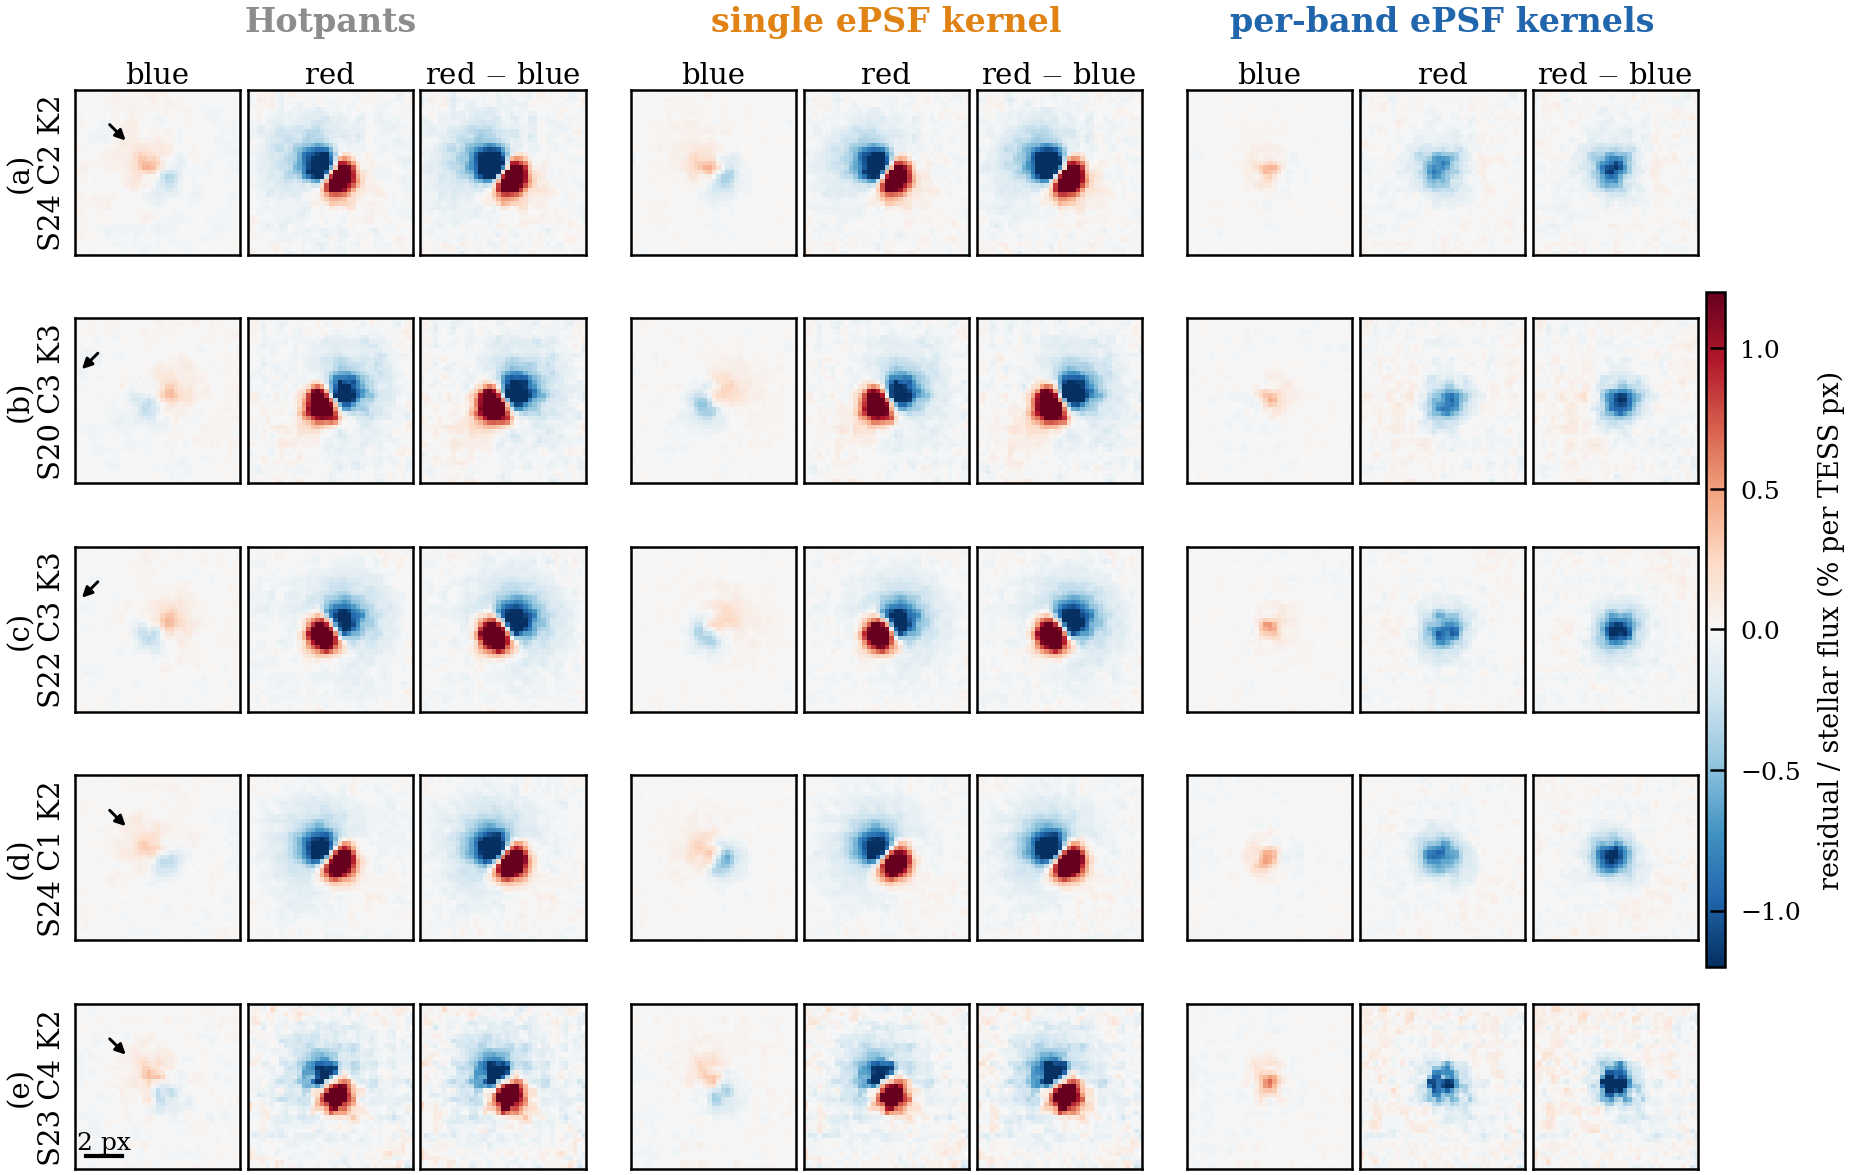
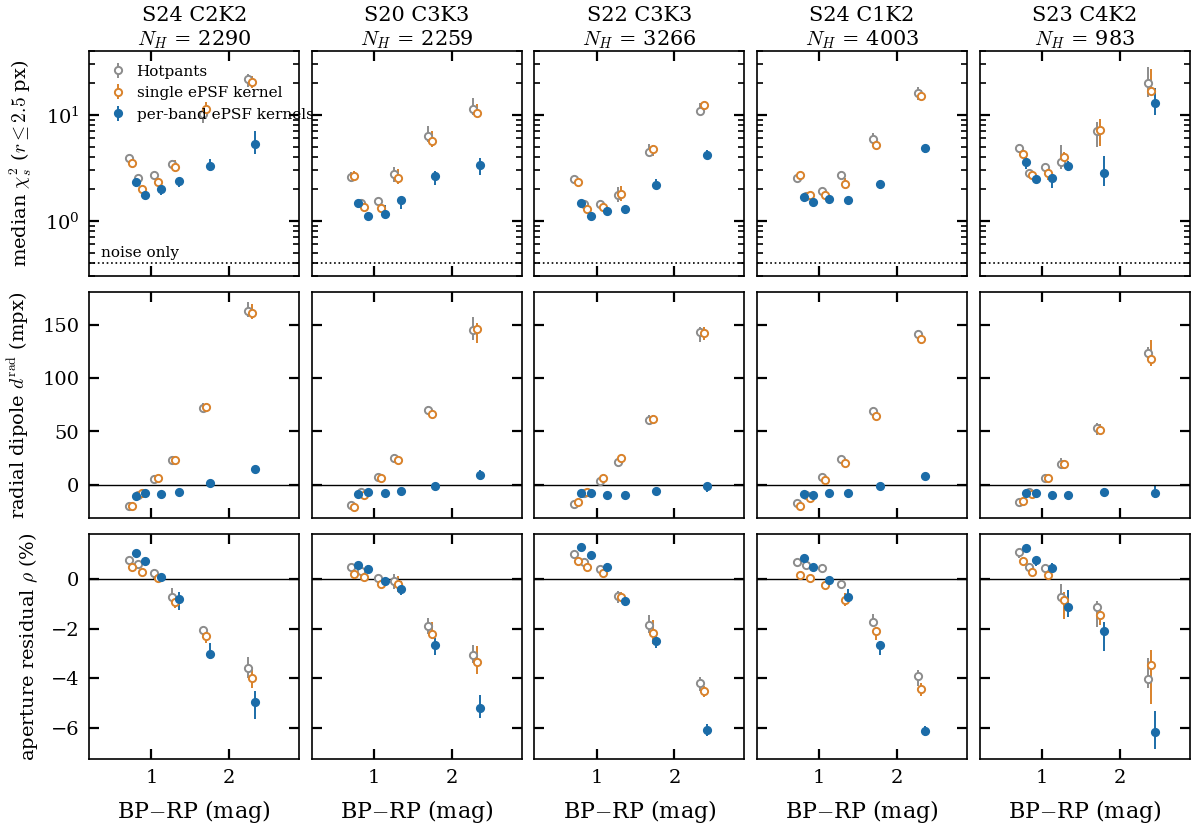
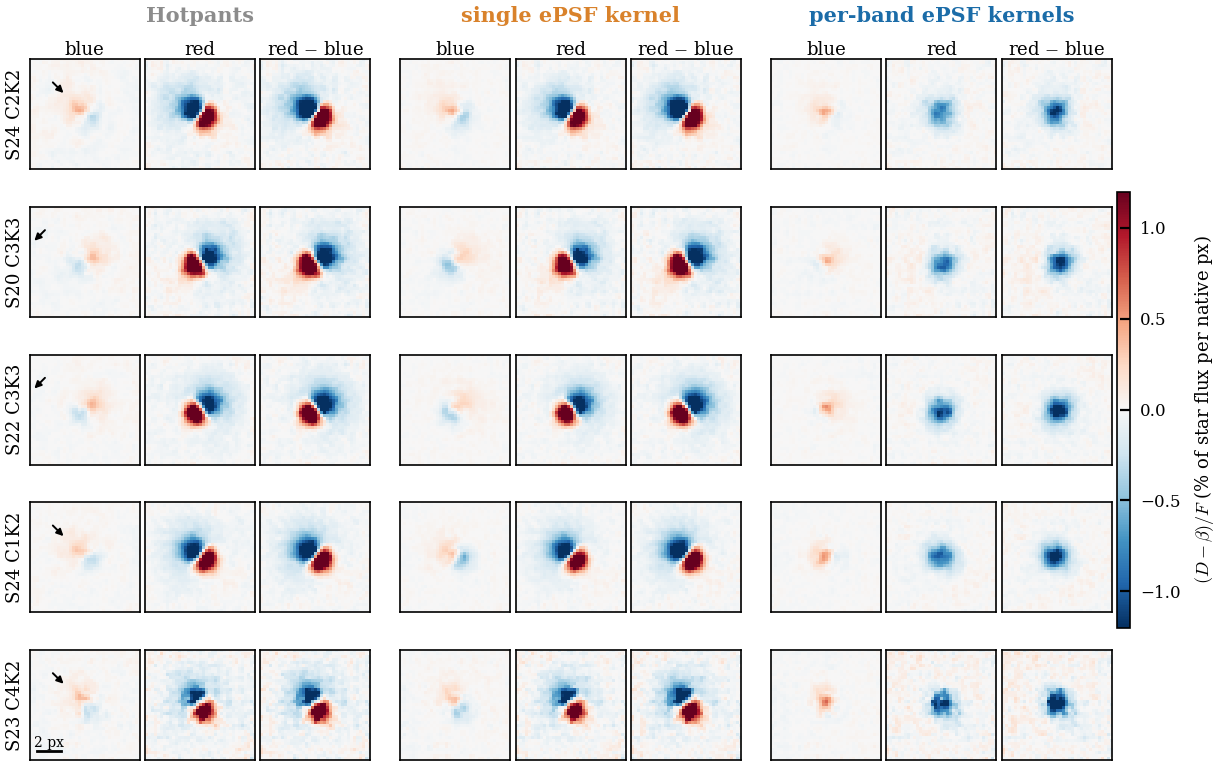
- On held-out faint stars ($13\le T<16$) the per-band kernels give the lowest core $\chi^2$ in every colour bin and remove the colour-dependent radial dipole that a single empirical kernel and a colour-independent kernel both leave (red minus blue $+132$ to $+181$ mpx with the empirical and colour-independent kernels, against $0$ to $+27$ mpx with the per-band kernels; reddest-bin $\chi^2$ lower by a factor of 2–4.5).
- The PS1 stack images are offset from their header WCS by about 0.1 arcsec relative to Gaia (the PS1 mean catalogue agrees with Gaia). Correcting the kernel position for this offset, with proper motion, removes most of an achromatic dipole of mid-colour stars; the offset is largely, not entirely, explained.
- The colour-correct kernels expose a template excess for red stars (aperture residual $-4.4$ to $-5.7$ % for the reddest stars, against $-2.6$ to $-3.9$ % with the empirical and colour-independent kernels): the template over-predicts the TESS flux of red stars. The band synthesis is ruled out (the template follows Gaia-XP colour to $\le0.4$ % per mag), and §7 discusses the origin.
Kernels $K_b$ at several positions for the four bands, with checks that their sum reproduces the ePSF at the star's colour. Placeholder.
previous run (to be replaced)
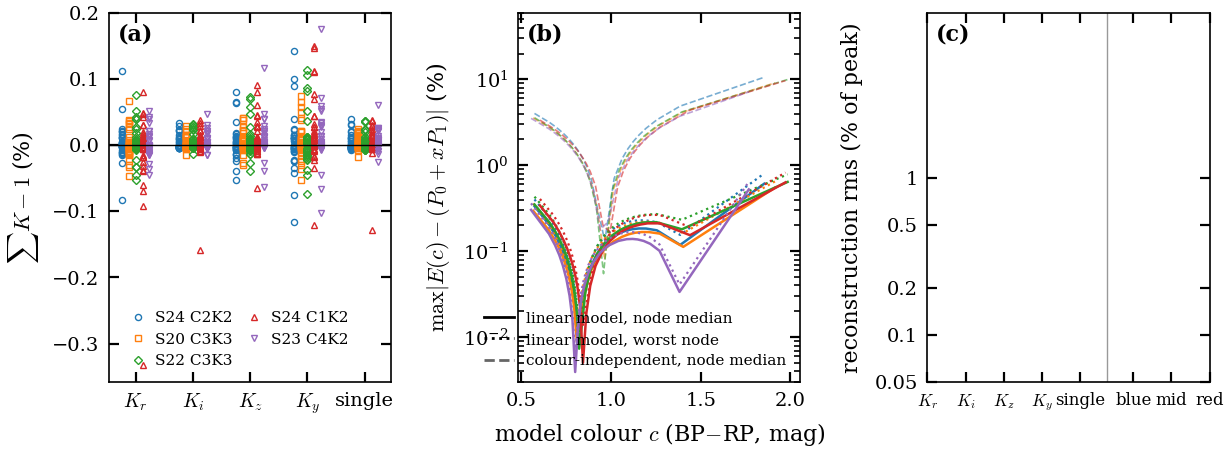
Held-out faint stars ($13\le T<16$) on identical templates, WCS and stars, for three subtractions: Hotpants (one empirical kernel), a single colour-independent ePSF kernel, and per-band kernels from the chromatic ePSF. Rows: median core $\chi^2$ within 2.5 px; radial residual dipole (mpx, positive away from the optical axis); and aperture residual, the fraction of the star's flux left within 3.5 px (negative means over-subtraction). The per-band kernels give the lowest $\chi^2$ in every colour bin and remove the colour-dependent dipole, leaving a constant radial offset of about $-8$ mpx that comes from the template colour zero point. The reddest stars have the most negative aperture residual (about $-5$ to $-6$ %), the sign of a template that is too bright for red stars. In (c) the per-band image leaves the MOST negative aperture residual for the reddest stars ($-4.4$ to $-5.7$ %, against $-2.6$ to $-3.9$ % for Hotpants and the single kernel): the colour-correct kernels expose the template's red excess, which the empirical kernels partly absorb. Its origin is discussed in §7 (red total-flux deficit) and Appendix F.
Images behind it: stacked residuals by colour
previous run (to be replaced)
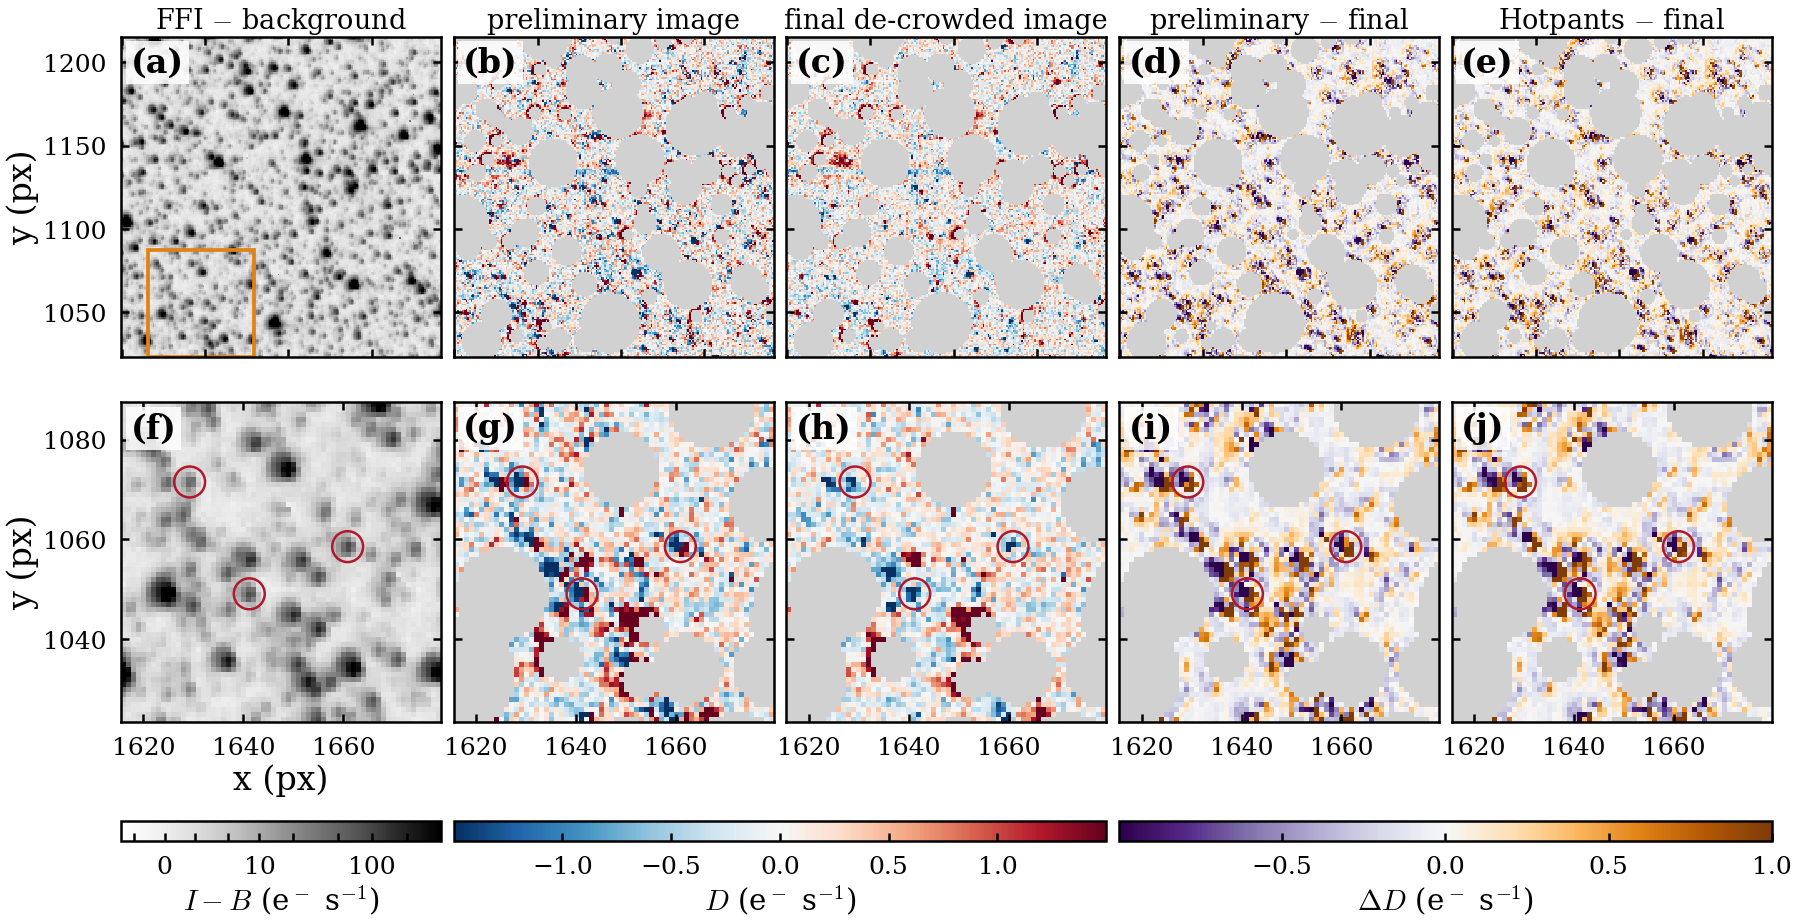
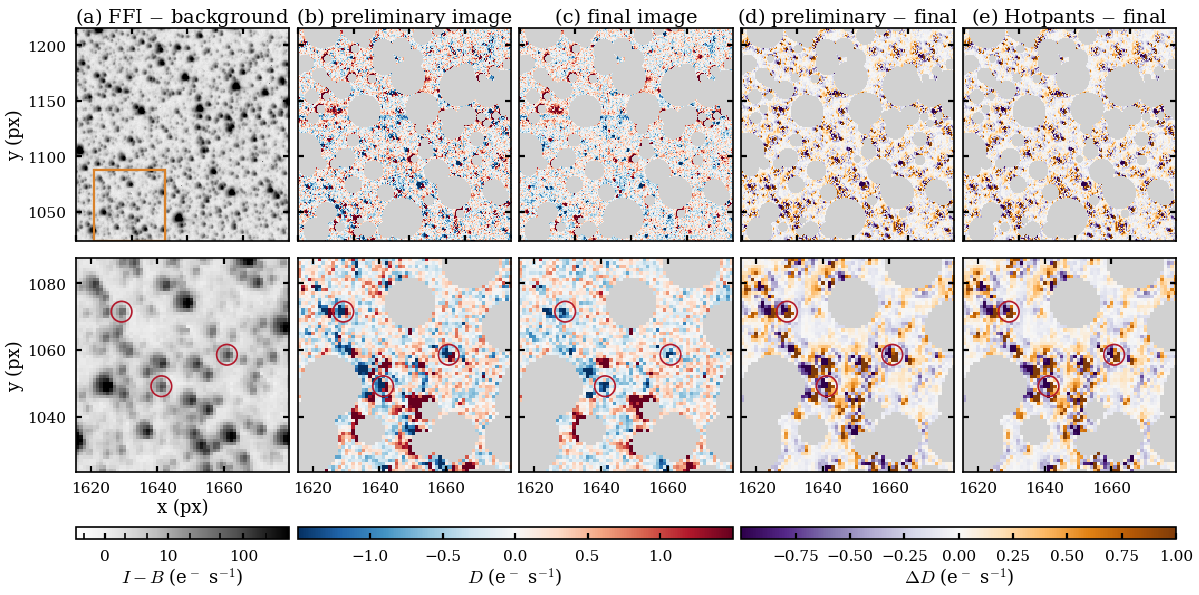
The same crop of F1 as the FFI, the preliminary image and the final de-crowded image on one colour scale; other fields in the supplement. Placeholder.
previous run (to be replaced)
6.4 Refit stability
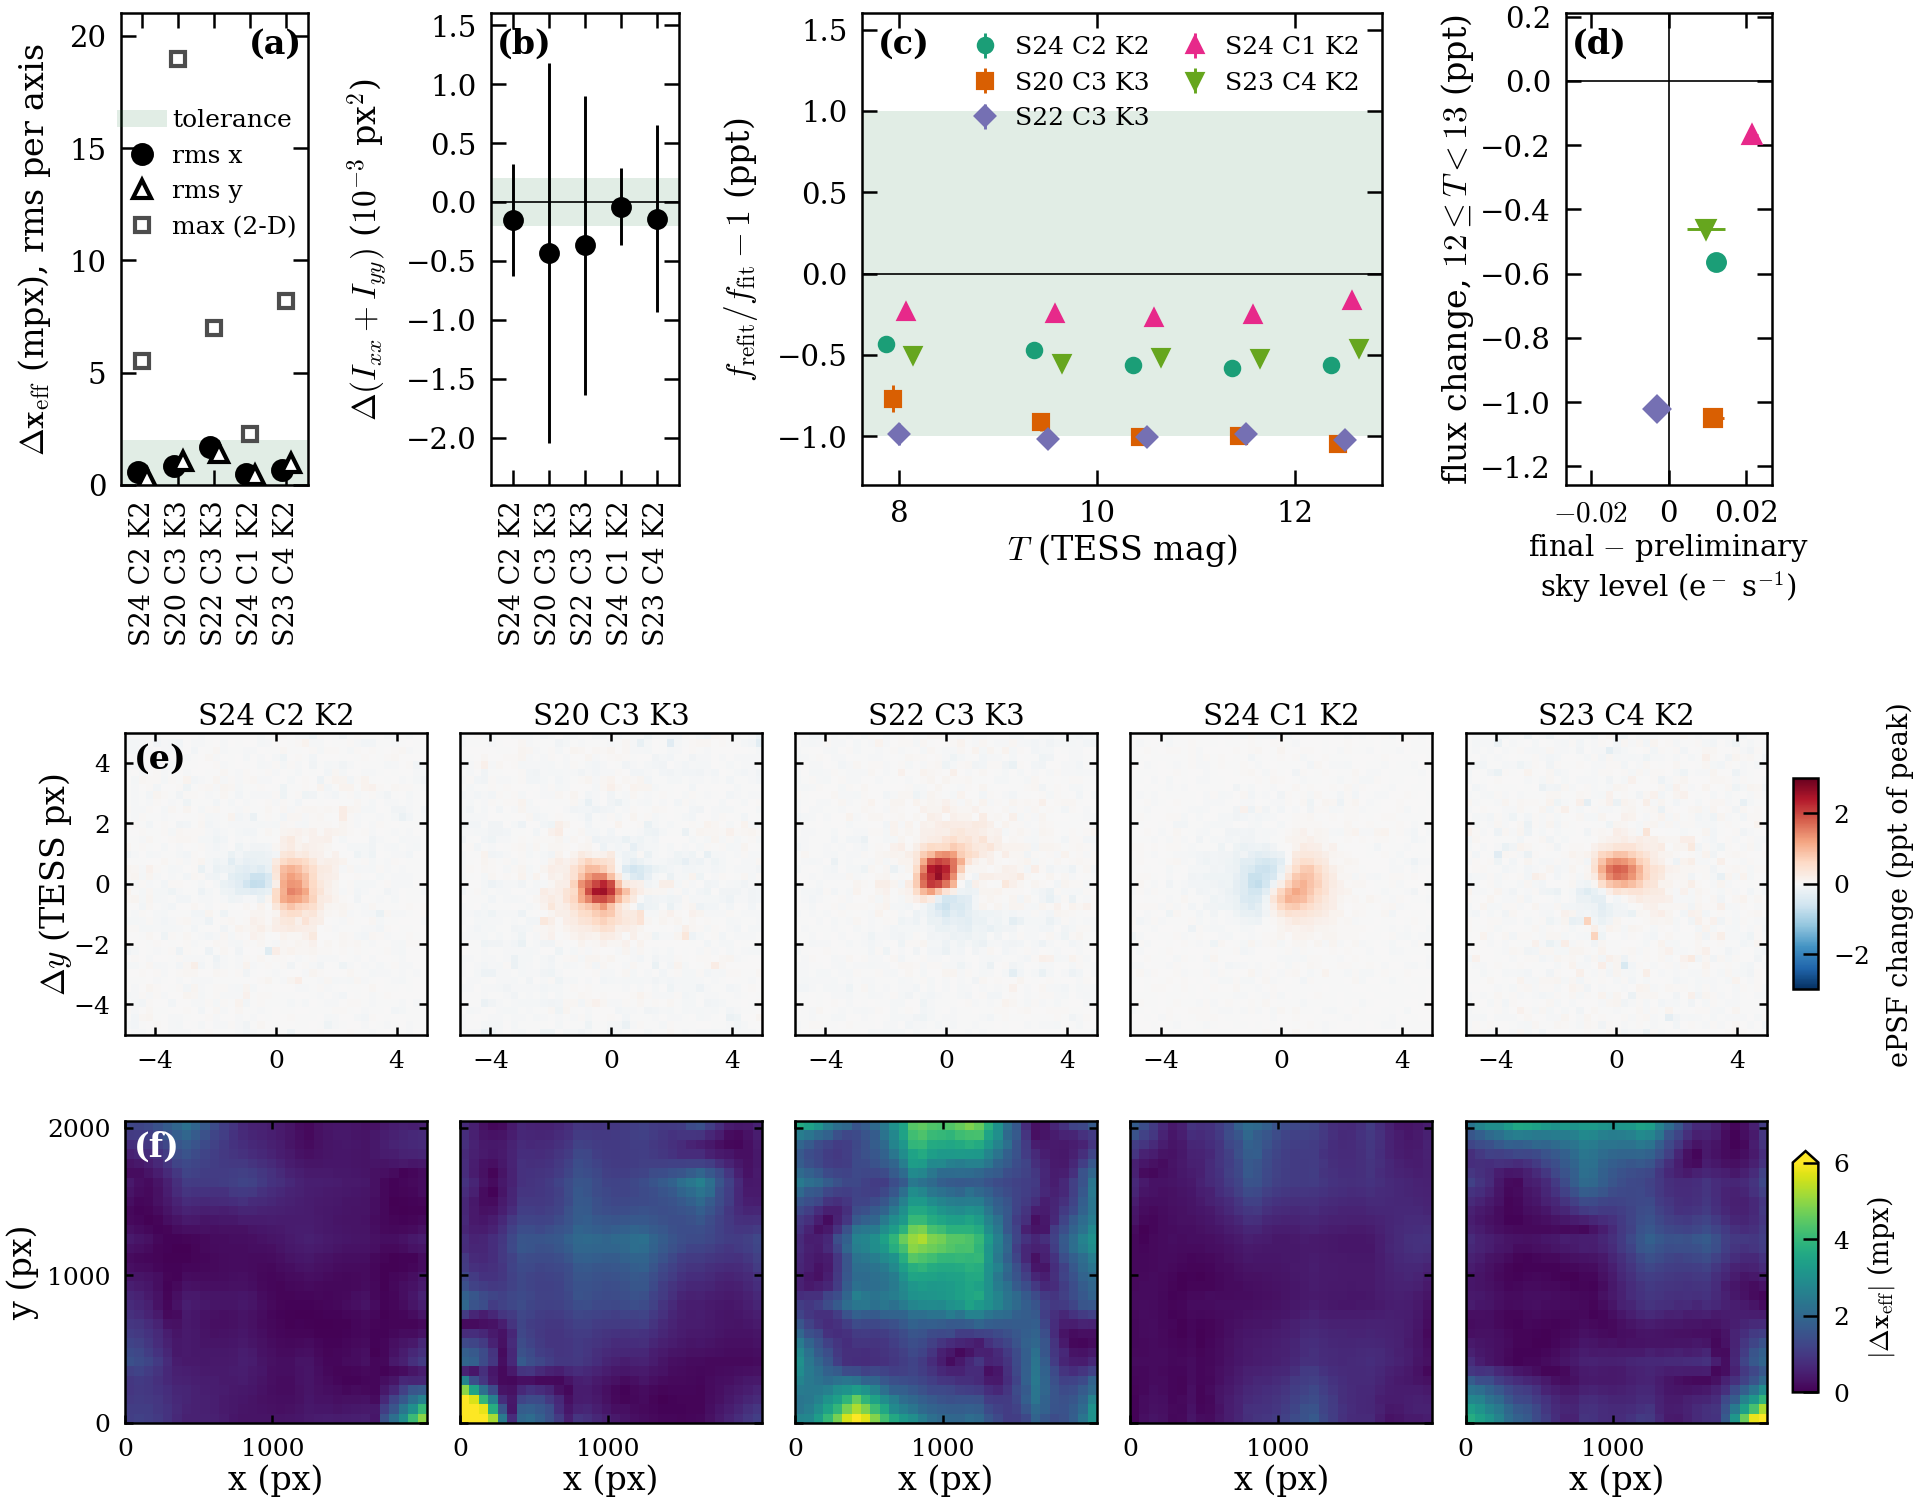
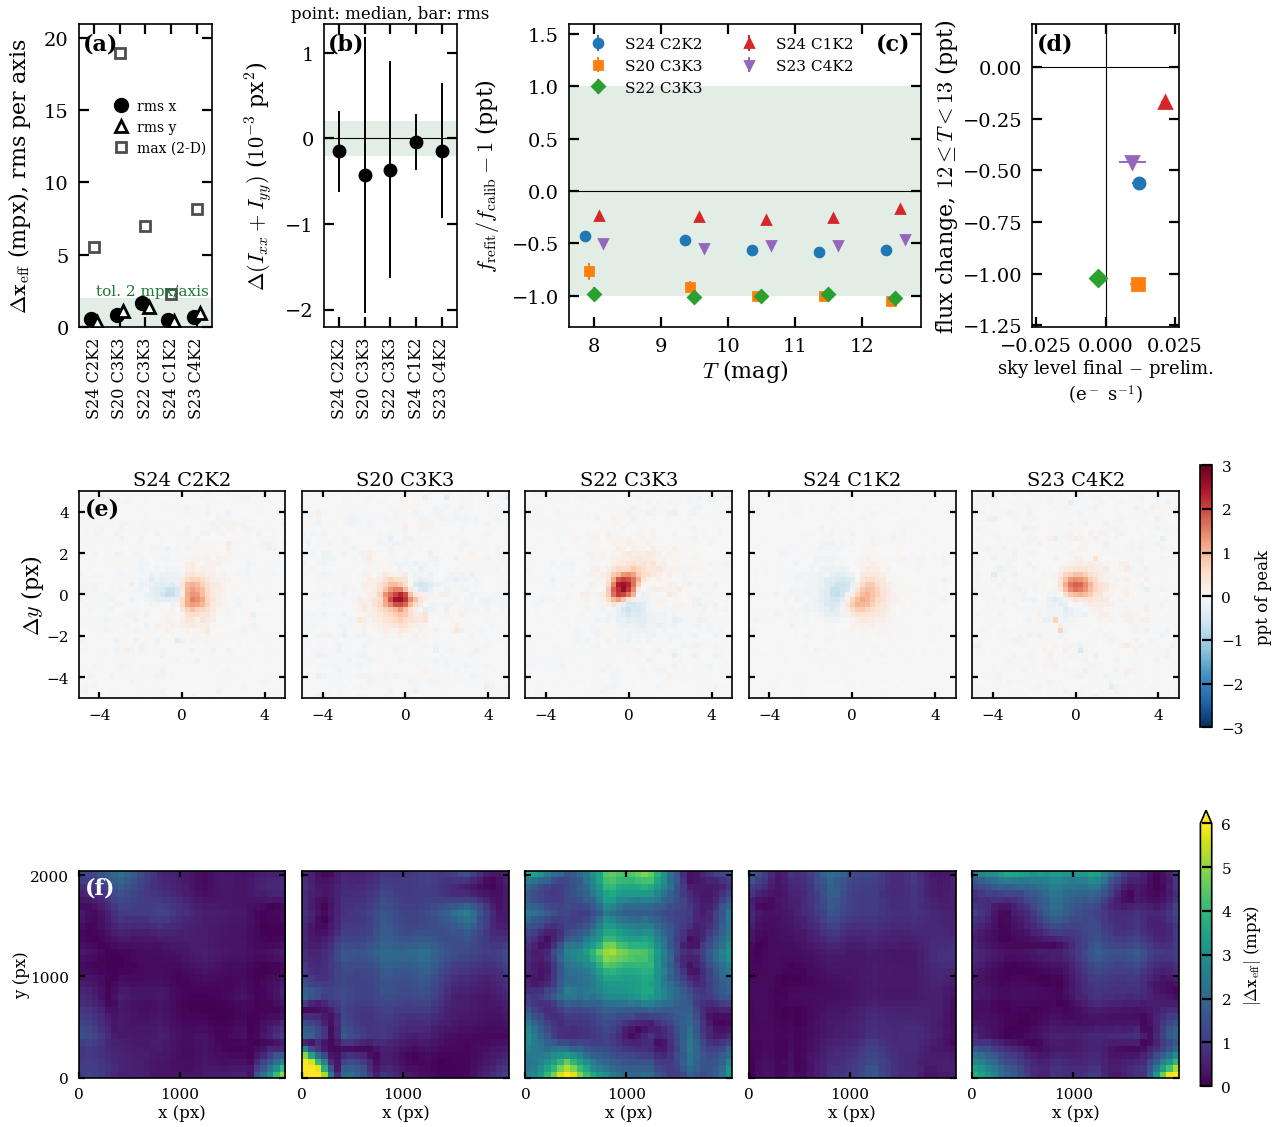
- We refit the joint model on the final de-crowded image and compare with the fit on the preliminary image, with tolerances set before the refit: 2 mpx per axis in effective star position, $0.2\times10^{-3}$ px$^2$ in ePSF second-moment size, and $\pm1$ ppt in flux.
- Position: all five fields pass (largest S22, 1.68 and 1.41 mpx per axis). In S22 the WCS and ePSF-centroid changes are each large and nearly opposite, so they largely cancel; we attribute the remaining 3–4 mpx swirl in the CCD centre, as an untested hypothesis, to S22's preliminary image changing most with the background.
- Flux: changes are flat with magnitude, $-0.2$ to $-1.0$ ppt. On F2 the refit gate passes in 3 of 5 magnitude bins, and the faintest-bin total-flux change is $-1.05$ ppt, just outside $\pm1$ ppt. The fixed-aperture check passes.
- Sky: the offset between the preliminary and final subtractions is at most 0.02 e$^-$ s$^{-1}$ in all fields and does not correlate with the faint-star flux change, so the flux change is a redistribution of ePSF light between core and wing, not a sky effect.
- Numbers are from the earlier run and are to be updated.
Refit on the final de-crowded image minus the fit on the preliminary image, five fields. (a) Effective star-position change (WCS plus ePSF centroid), rms per axis over held-out stars, against the 2 mpx tolerance band; all five fields pass (largest S22, 1.68 and 1.41 mpx). Open squares give the largest per-star change $|\Delta\boldsymbol x_{\rm eff}|$ over all fitted stars ($T\le13$); it reaches about 19 mpx in S20 C3 K3, at the bottom-left corner of the CCD where (f) saturates, and is not part of the tolerance, which is set on the rms. (b) Change of the ePSF second-moment size in $10^{-3}$ px$^2$. (c) Flux ratio $f_{\rm refit}/f_{\rm prelim}-1$ in ppt against $T$, flat at $-0.2$ to $-1.0$ ppt; F2's faintest bin ($-1.05$ ppt) sits just outside the $\pm1$ ppt band, and the gate passes in 3 of 5 bins on F2. (d) Sky offset of the final minus preliminary subtraction (at most 0.02 e$^-$ s$^{-1}$) against the faint-star flux change, which do not correlate.
previous run (to be replaced)
6.5 Targeted de-crowding and faint-star photometry
- For a target star we take its own PS1 source segment in each band and push it through the same smoothing, resampling and kernels as the template, giving a modelled target image $M_t$ (Table 1, steps 14–15).
- Adding $M_t$ back to the final image, $D_t=D_{\rm final}+M_t$, restores the target's light so that its flux can be fitted together with its neighbours, while bright stars are measured directly on $D_{\rm final}$.
- Figures 23 and 24 will show the stamps and the bright plus faint magnitude difference against Gaia-XP.
7 Discussion and limits
- Red total-flux deficit. We compare the total flux of isolated stars with the flux predicted from their Gaia DR3 XP spectra integrated through the TESS response function (version 2.0). Red stars are systematically fainter than predicted, by $b=25$–$30$ mmag per magnitude of $G_{\rm BP}-G_{\rm RP}$ ($+29\pm2$ mmag mag$^{-1}$ when the spectrum beyond 1000 nm is anchored to 2MASS $J$). The slope is consistent across all four cameras within 2–3$\sigma$ (per-field values 25–36 mmag mag$^{-1}$, driven by camera 1), and agrees on the same CCD in two sectors. It does not depend on brightness over $8\le T\le12.5$, and is seen independently in template-subtracted images of $13\le T\le16$ stars. It is not light scattered outside the photometric aperture: the colour slope is constant from 6 to 150 pixels, less than 16 % (2$\sigma$) of the deficit can lie between 8 and 40 pixels, and less than 5 % lies in row or column streaks. It is not an error in the Gaia spectra: a prediction made without XP, by fitting model atmospheres to APASS and 2MASS photometry, also gives a positive slope (26–39 mmag mag$^{-1}$ depending on the atmosphere grid), and XP synthetic photometry agrees with Pan-STARRS1 $y$ to within 0.65 % per mag in all fields. The most likely explanation is that the in-flight red response of TESS is lower than version 2.0 of the response function, but our data, which constrain the spectrum only through broadband colour, cannot determine its spectral shape. We do not correct for this effect. Users who need absolute TESS fluxes of red stars at the few-percent level should allow for a colour term of this size. (Vanderspek et al. 2018; Montegriffo et al. 2023; Stassun et al. 2019.)
- Brightness width not modelled. The ePSF is the brightness-averaged profile of its training stars. The effect is measured in §5.3 and costs less than 1 mmag in PSF photometry (Appendix E).
- PS1 near-saturation core excess. The template cores of mid-colour stars just fainter than the removal limit are 1–3 % too faint, a stacking effect near PS1 saturation (Appendix F). Our measured onset implies a removal limit of $T<13.7$, against the current $T<13$.
- PS1 stack WCS offset. The stack images sit about 0.1 arcsec from their header WCS relative to Gaia. It is corrected in the kernels (§6.3); a small radial term tied to the template colour zero point remains.
- Node-grid representation limit. Held-out stars are slightly sharper than the model near the $6\times6$ ePSF nodes than midway between them (stack width $-0.7$ to $-1.0\times10^{-3}$ px$^2$ at nodes against $-0.2$ to $-0.3\times10^{-3}$ midway; core $\chi^2$ higher by a factor 1.3–1.4 near nodes). On an $11\times11$ grid the same pattern appears at the new node positions, so it comes from the bilinear interpolation between nodes, not from the optics. A smooth spatial interpolation would remove it; we state it as a limit.
- Bright-end flux-scale trend. Held-out magnitudes run faint toward the bright end (+15 mmag at $T=8$–9, −3 at $T=12$–13; §6.2). About a third of the faint-end slope is a Gaia XP calibration error (Huang et al. 2024); the rest, most likely TESS-side, is a limit of the absolute flux scale.
- Sub-pixel phase term. Fluxes depend on intra-pixel position at the $\le0.25$ % level (§6.2).
- Temporal extension. This paper treats single images. Light-curve performance and the temporal behaviour of the ePSF are the subject of Paper 2.
A Sampling
A like-for-like comparison of the native-grid template with the template four times finer: same frame, same settings, held-out metrics and cutouts. No sampling gain is claimed before this comparison is made.
B Background details
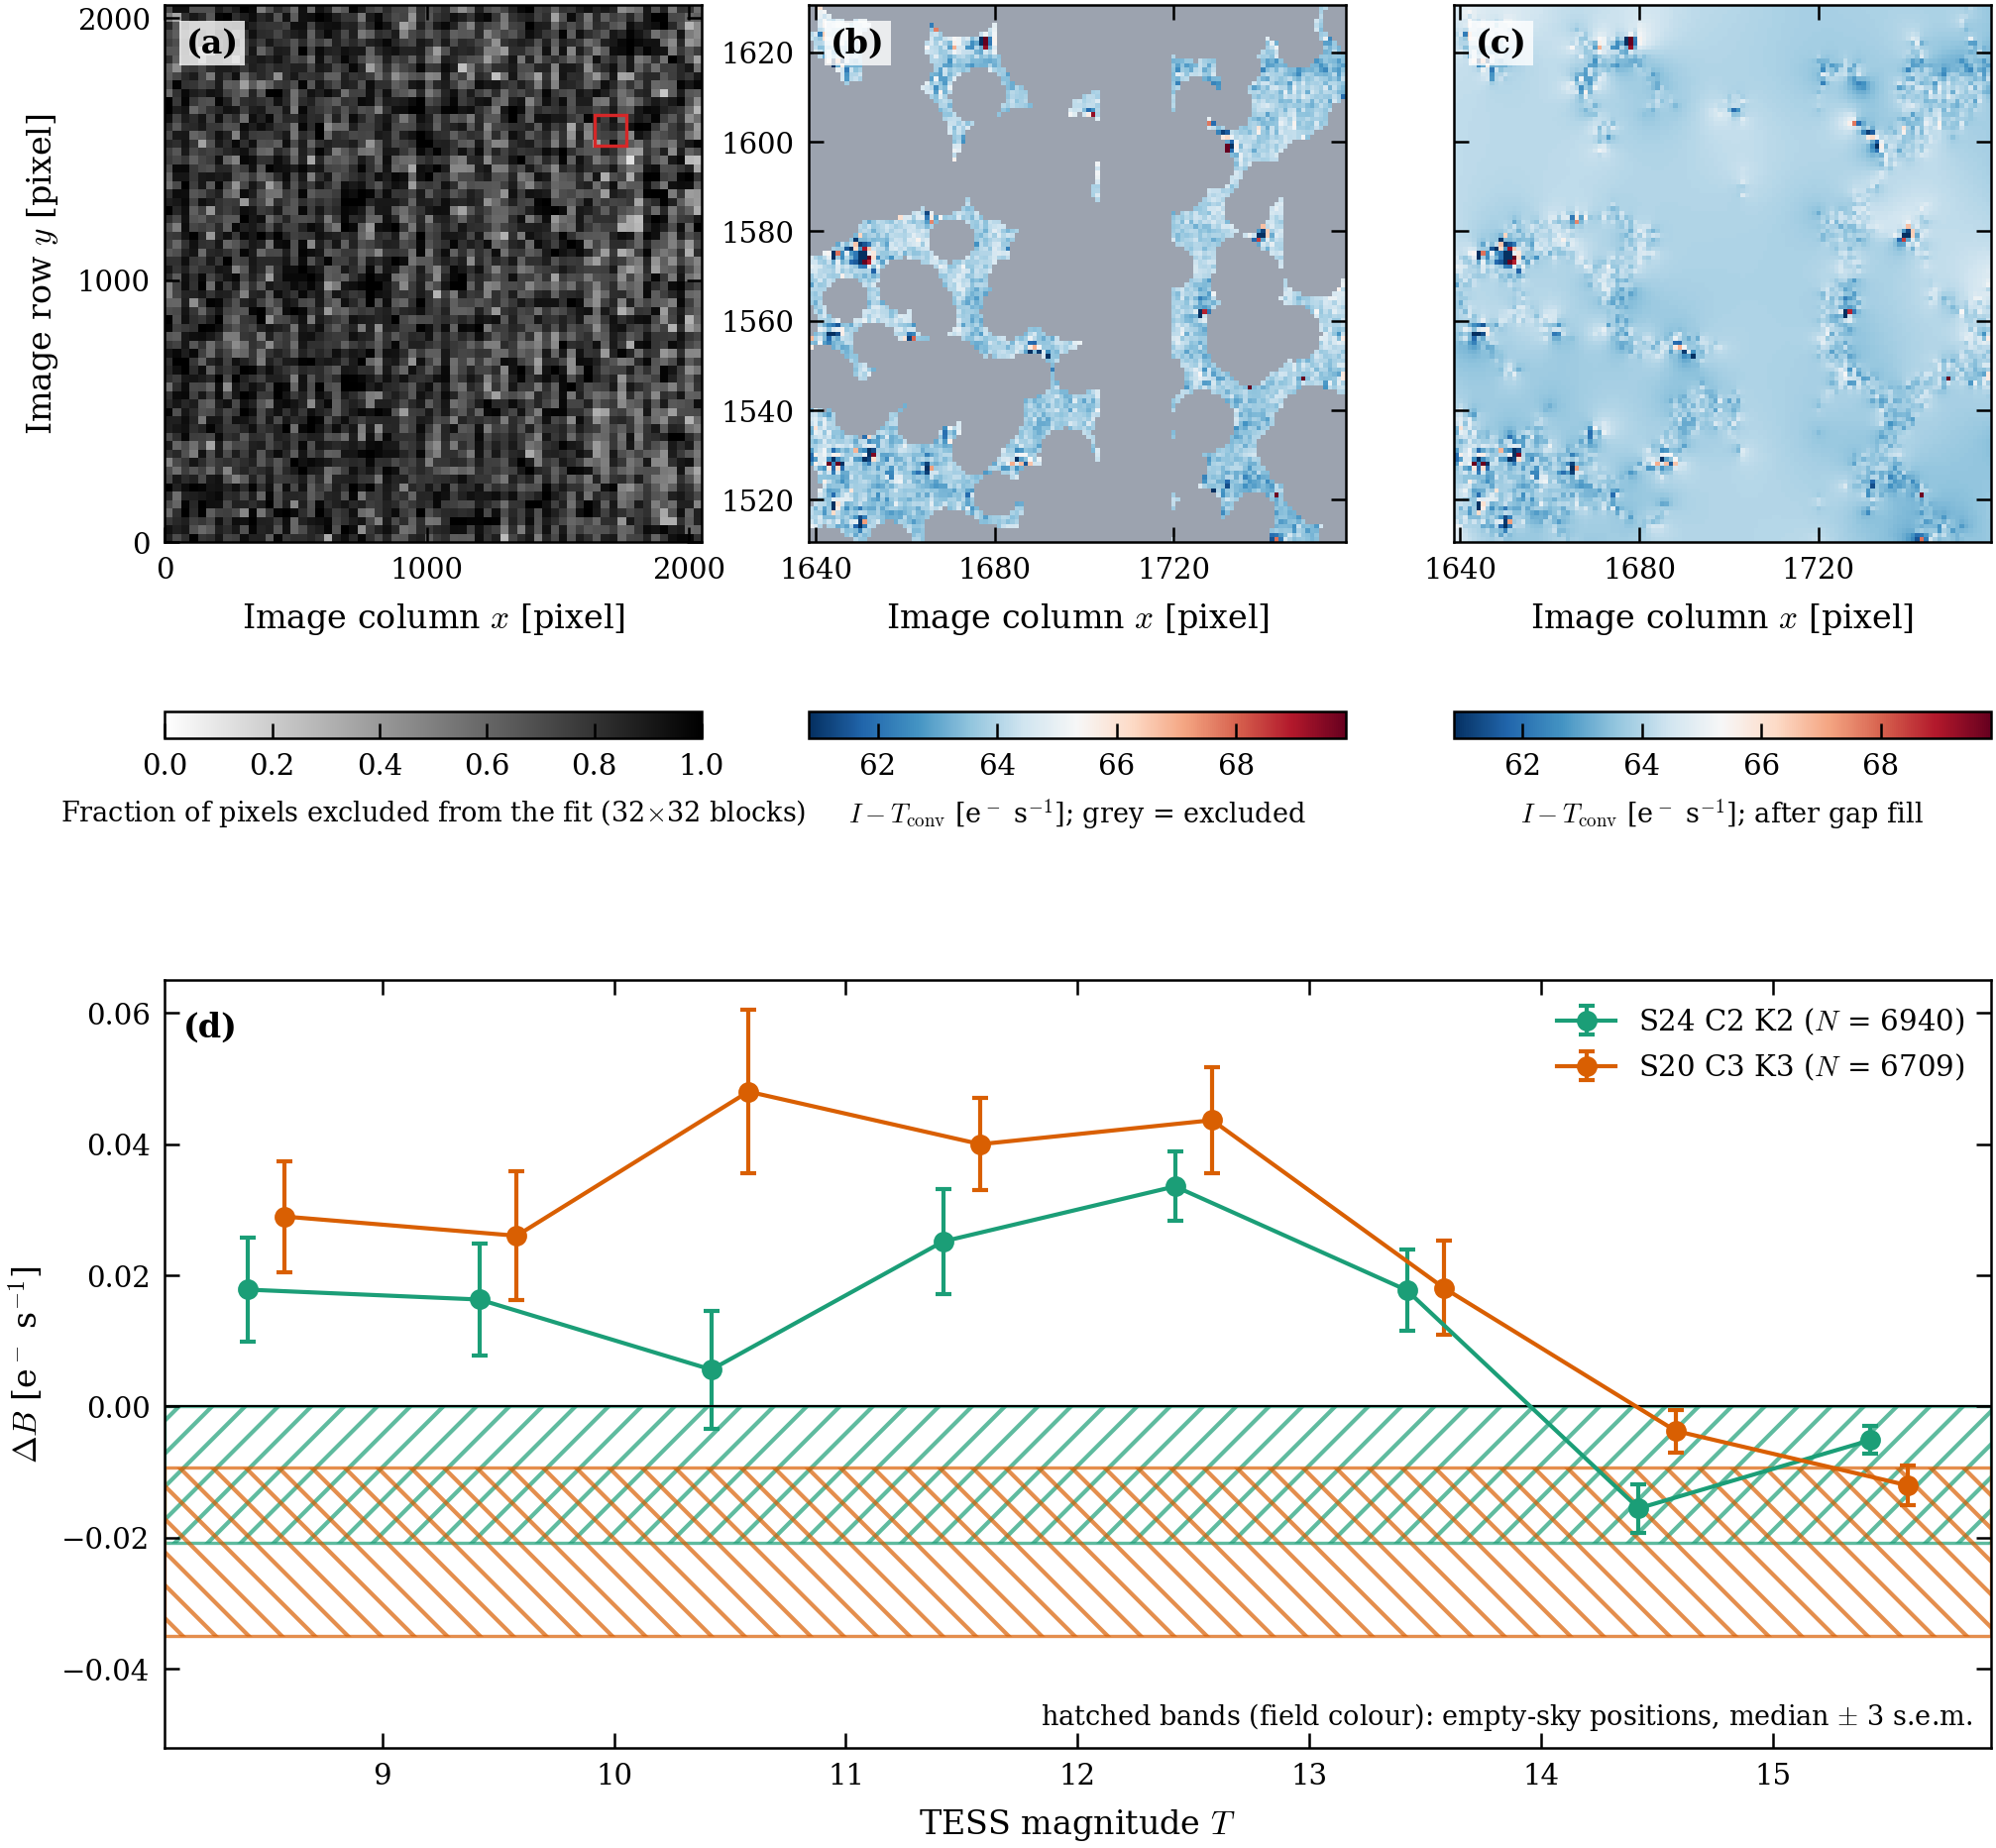
(a) Fraction of pixels excluded from the fit in 32×32 blocks (0.768 excluded overall): catalogue stars ($T<13$, magnitude-scaled disks), red $13\le T<16$ stars, saturated-bleed regions, two bad columns, and the standard mask. (b, c) $I-T_{\rm conv}$ over a 120×120-pixel region on the fit pixels, before and after harmonic gap filling. (d) Median background bias under isolated stars in 1-mag bins for S24 C2 K2 and S20 C3 K3, against empty-sky positions. Biases under stars are $\le0.05$ e$^-$ s$^{-1}$, below 0.1 % of the sky level.
C Band synthesis
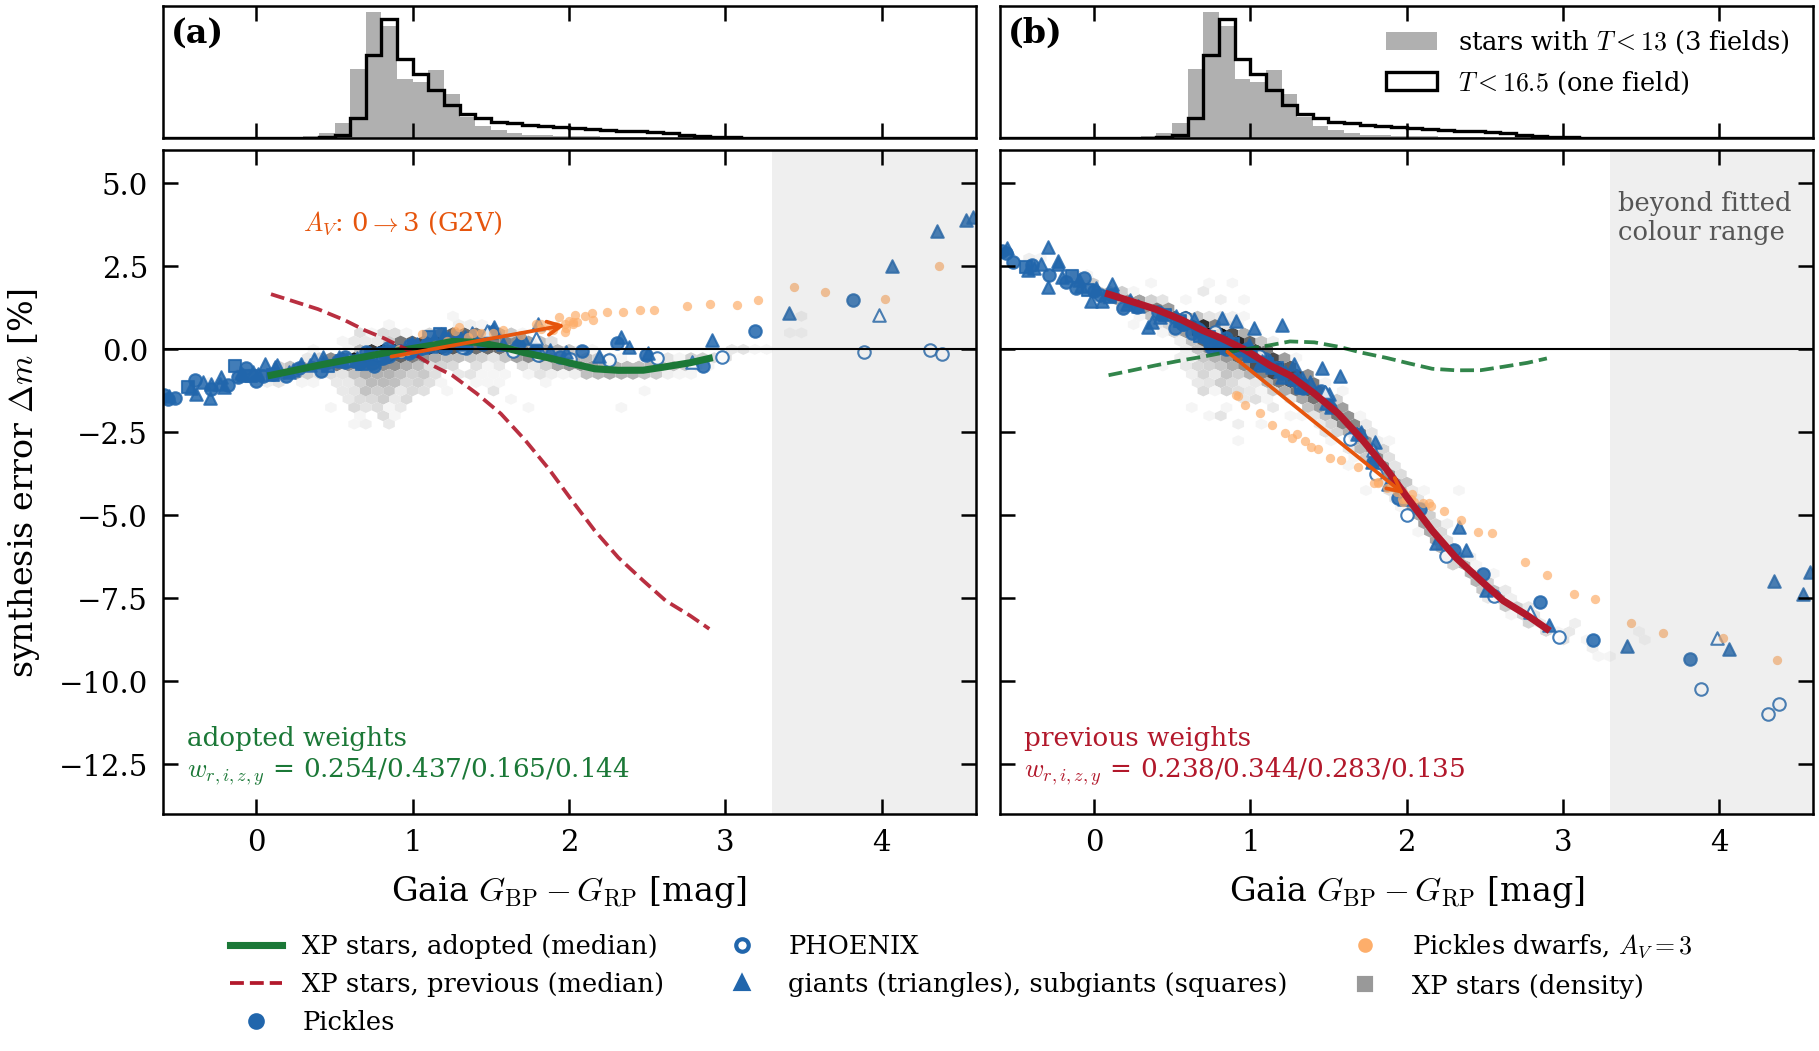
The weights of §2.2 are chosen so that the synthesised template follows the TESS count rate predicted from stellar spectra. Figure C1 shows the synthesis error against colour. Figure C2 shows the evidence for the TESS response curve used.
Synthesis error $\Delta m$ of the band mix against Gaia $G_{\rm BP}-G_{\rm RP}$ for model spectra and Gaia XP stars, for the adopted weights (a) and the previous weights (b). The previous weights are shown because the TESSreduce pipeline (Ridden-Harper et al. 2021) uses them. Shaded: colours beyond the fitted range. Histograms: the colour distribution of the stars.
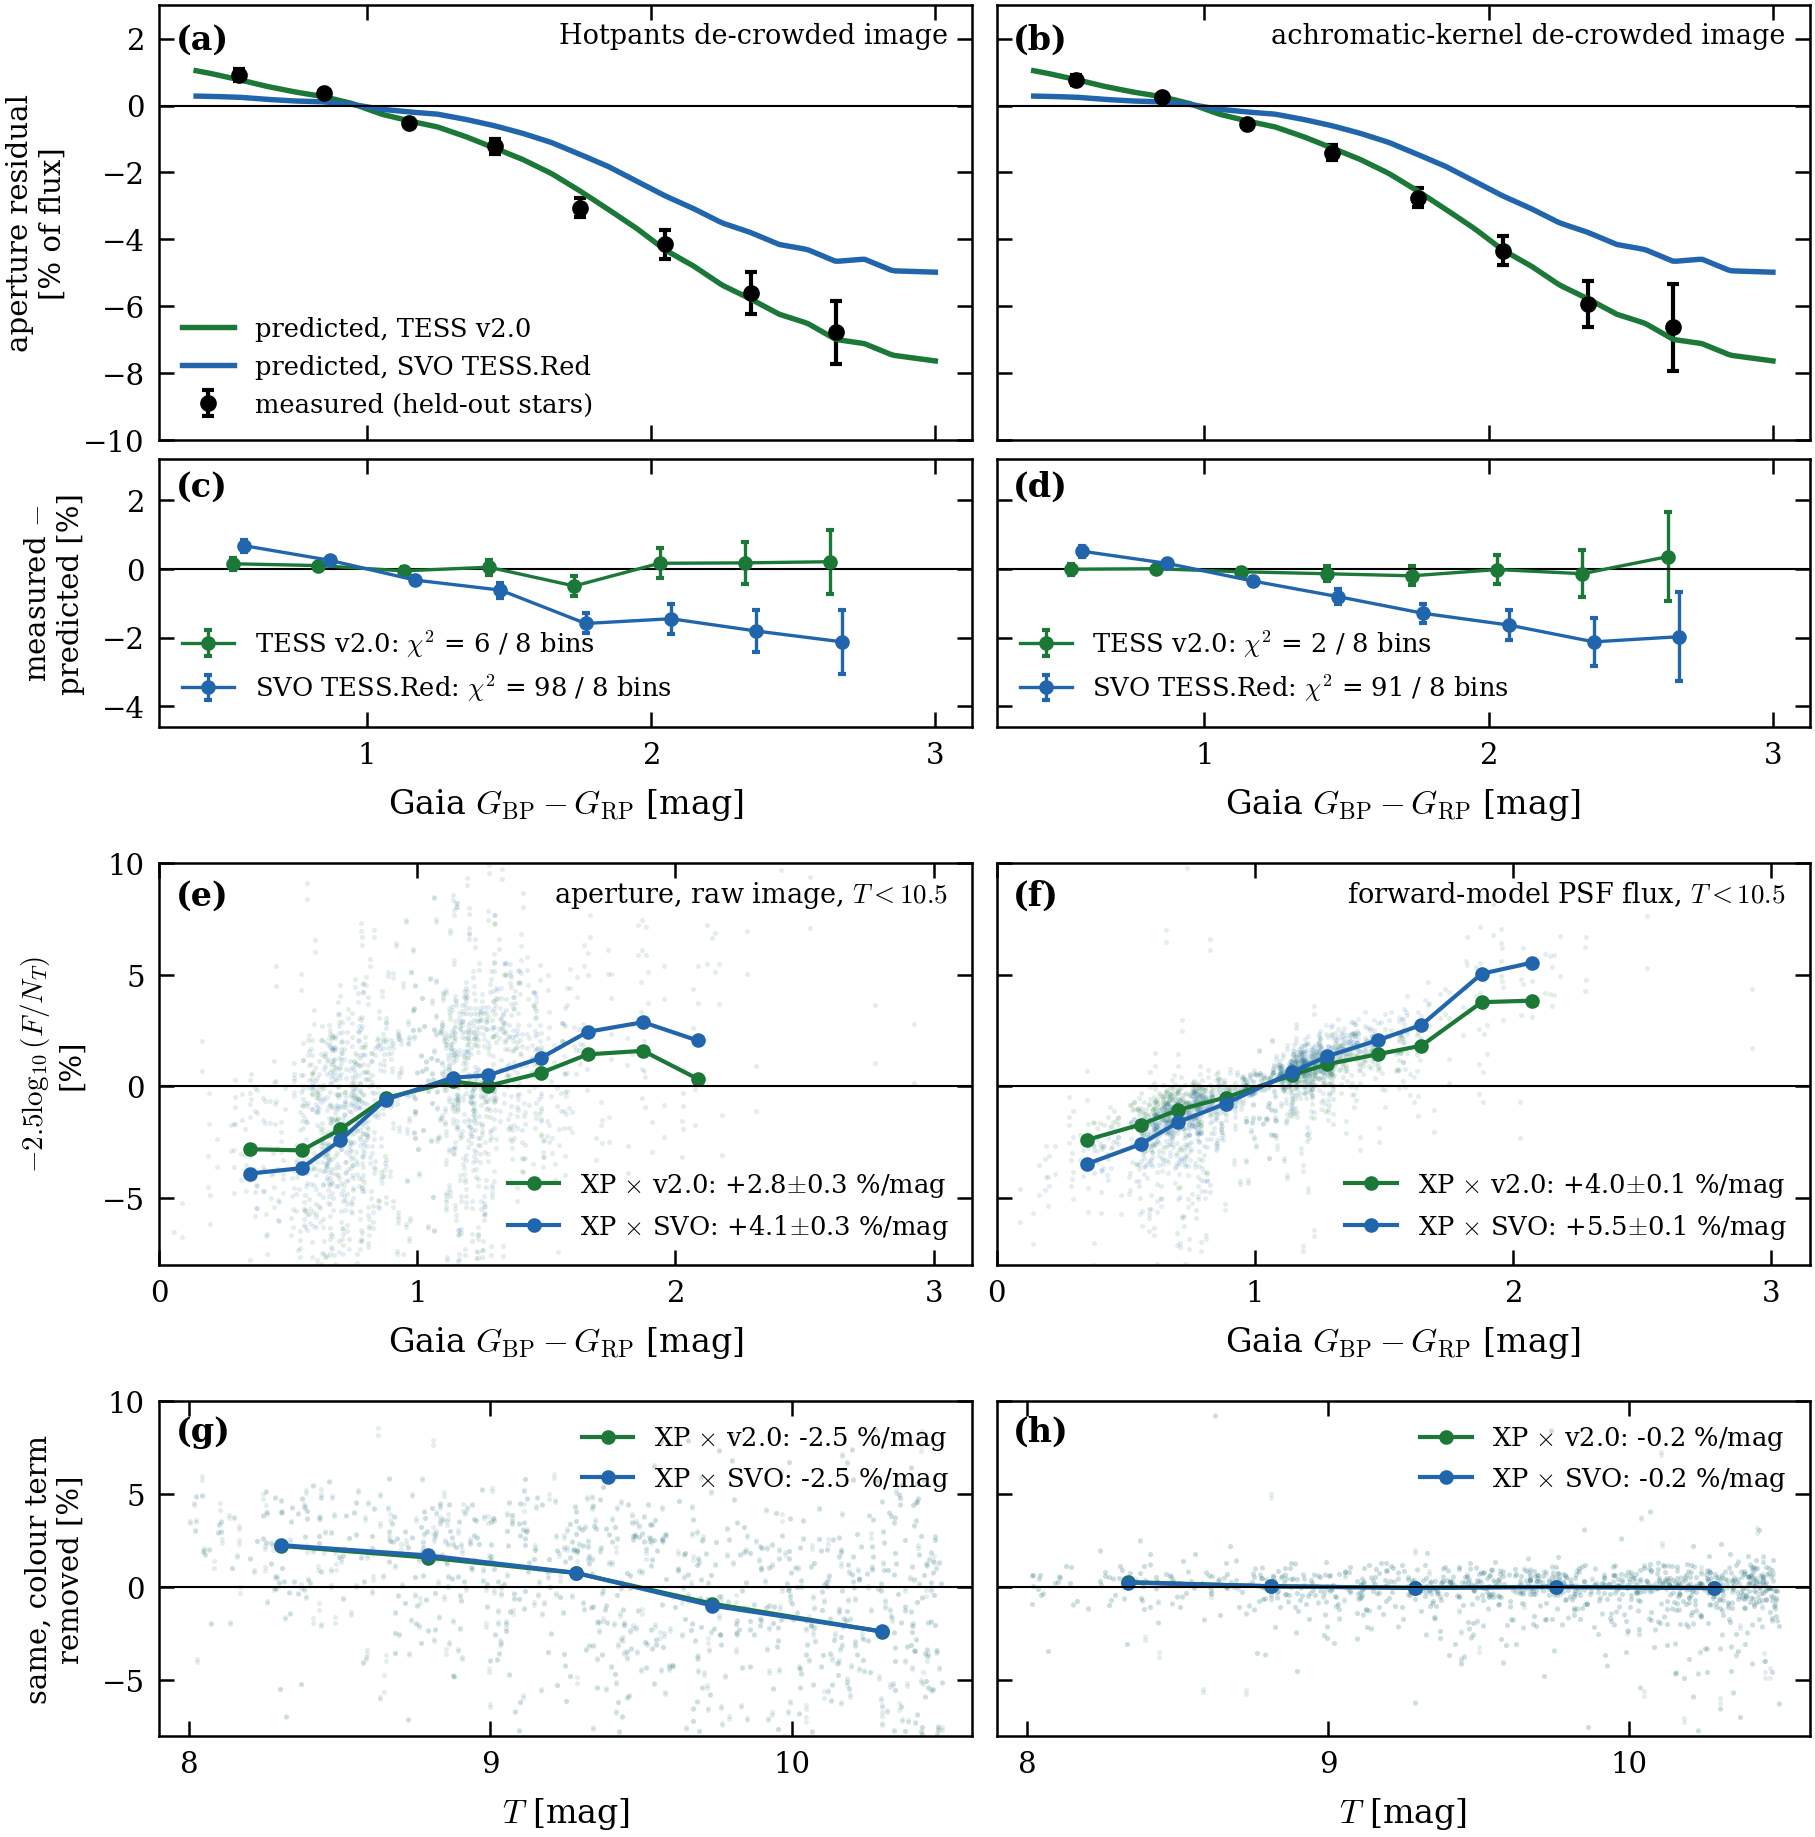
(a, b) Aperture residual of held-out stars against colour for a Hotpants and a colour-independent kernel difference image, with the prediction from the TESS response version 2.0 (green) and the SVO TESS.Red curve (blue). (c, d) Measured minus predicted; version 2.0 is preferred ($\chi^2=6$ and 2 against 98 and 91 for 8 bins). (e, f) Flux against colour for raw apertures and forward-model PSF fluxes, with the two responses. (g, h) The same with the colour term removed, against $T$.
| Spectral group | n | Previous weights | TESSreduce | Adopted weights |
|---|---|---|---|---|
| weights r,i,z,y | 0.238/0.344/0.283/0.135 | 0.256/0.276/0.358/0.112 | 0.254/0.437/0.165/0.144 | |
| O/B | 14 | +2.6 (+1.9…+3.1) | +2.7 (+2.0…+3.5) | -1.2 (-1.5…-0.8) |
| A | 18 | +1.7 (+1.3…+2.1) | +1.7 (+1.3…+2.2) | -0.7 (-1.1…-0.4) |
| F | 18 | +0.8 (+0.1…+1.1) | +0.8 (+0.1…+1.4) | -0.3 (-0.6…-0.1) |
| G/K | 43 | -0.3 (-1.6…+0.9) | -0.4 (-2.1…+1.2) | +0.1 (-0.5…+0.6) |
| K7–M3 | 24 | -3.6 (-6.8…-0.8) | -4.1 (-7.9…-0.5) | +0.1 (-0.3…+0.8) |
| M4–M6 | 10 | -8.5 (-10.2…-7.2) | -9.9 (-11.7…-8.4) | -0.1 (-0.5…+1.5) |
| late M (PHOENIX ≤2700 K) | 7 | -8.7 (-11.0…-6.7) | -9.3 (-12.5…-6.2) | +2.5 (-0.1…+4.0) |
D Colour models: physical operators against basis functions
We first modelled the colour dependence with physical operators (lateral shift, kurtosis, blur and dilation, trefoil, elongation), each moving core and wing in a fixed ratio. Each operator lowers the held-out $\chi^2$ when added: the shift dominates, kurtosis follows, and the others cost 0.4–3.9 % when removed. The operators leave structure out to 3.5 px and over-remove far-wing light of red stars, because they change core and wing together. The basis-function model of §4.4 keeps the shift and replaces the other terms by ring and coma functions; its held-out $\chi^2$ is 0.91–0.96 of the operator model at $T=10$–13 and 0.68–0.88 at $T=8$–10 and for red stars (preliminary, two folds on three fields).
E A linear peak-charge width term
We tested whether the effect of §5.3 can be absorbed by a brightness-dependent blur. For star $s$ the rendered PSF is $$P_s(x,y)=P(x,y)+\tfrac12\,\Delta\Sigma_s\left(\partial_x^2P+\partial_y^2P\right),\qquad \Delta\Sigma_s=b\,\frac{q_s}{10^{4}\,{\rm e^-}} ,$$ where $P$ is the fitted ePSF after the colour terms, $q_s$ the peak charge per 2-s read of §5.3 (computed once from the starting fluxes and held fixed) and $b$ one scalar per fit (px$^2$ per $10^4$ e$^-$), trained together with the ePSF, colour terms and WCS.
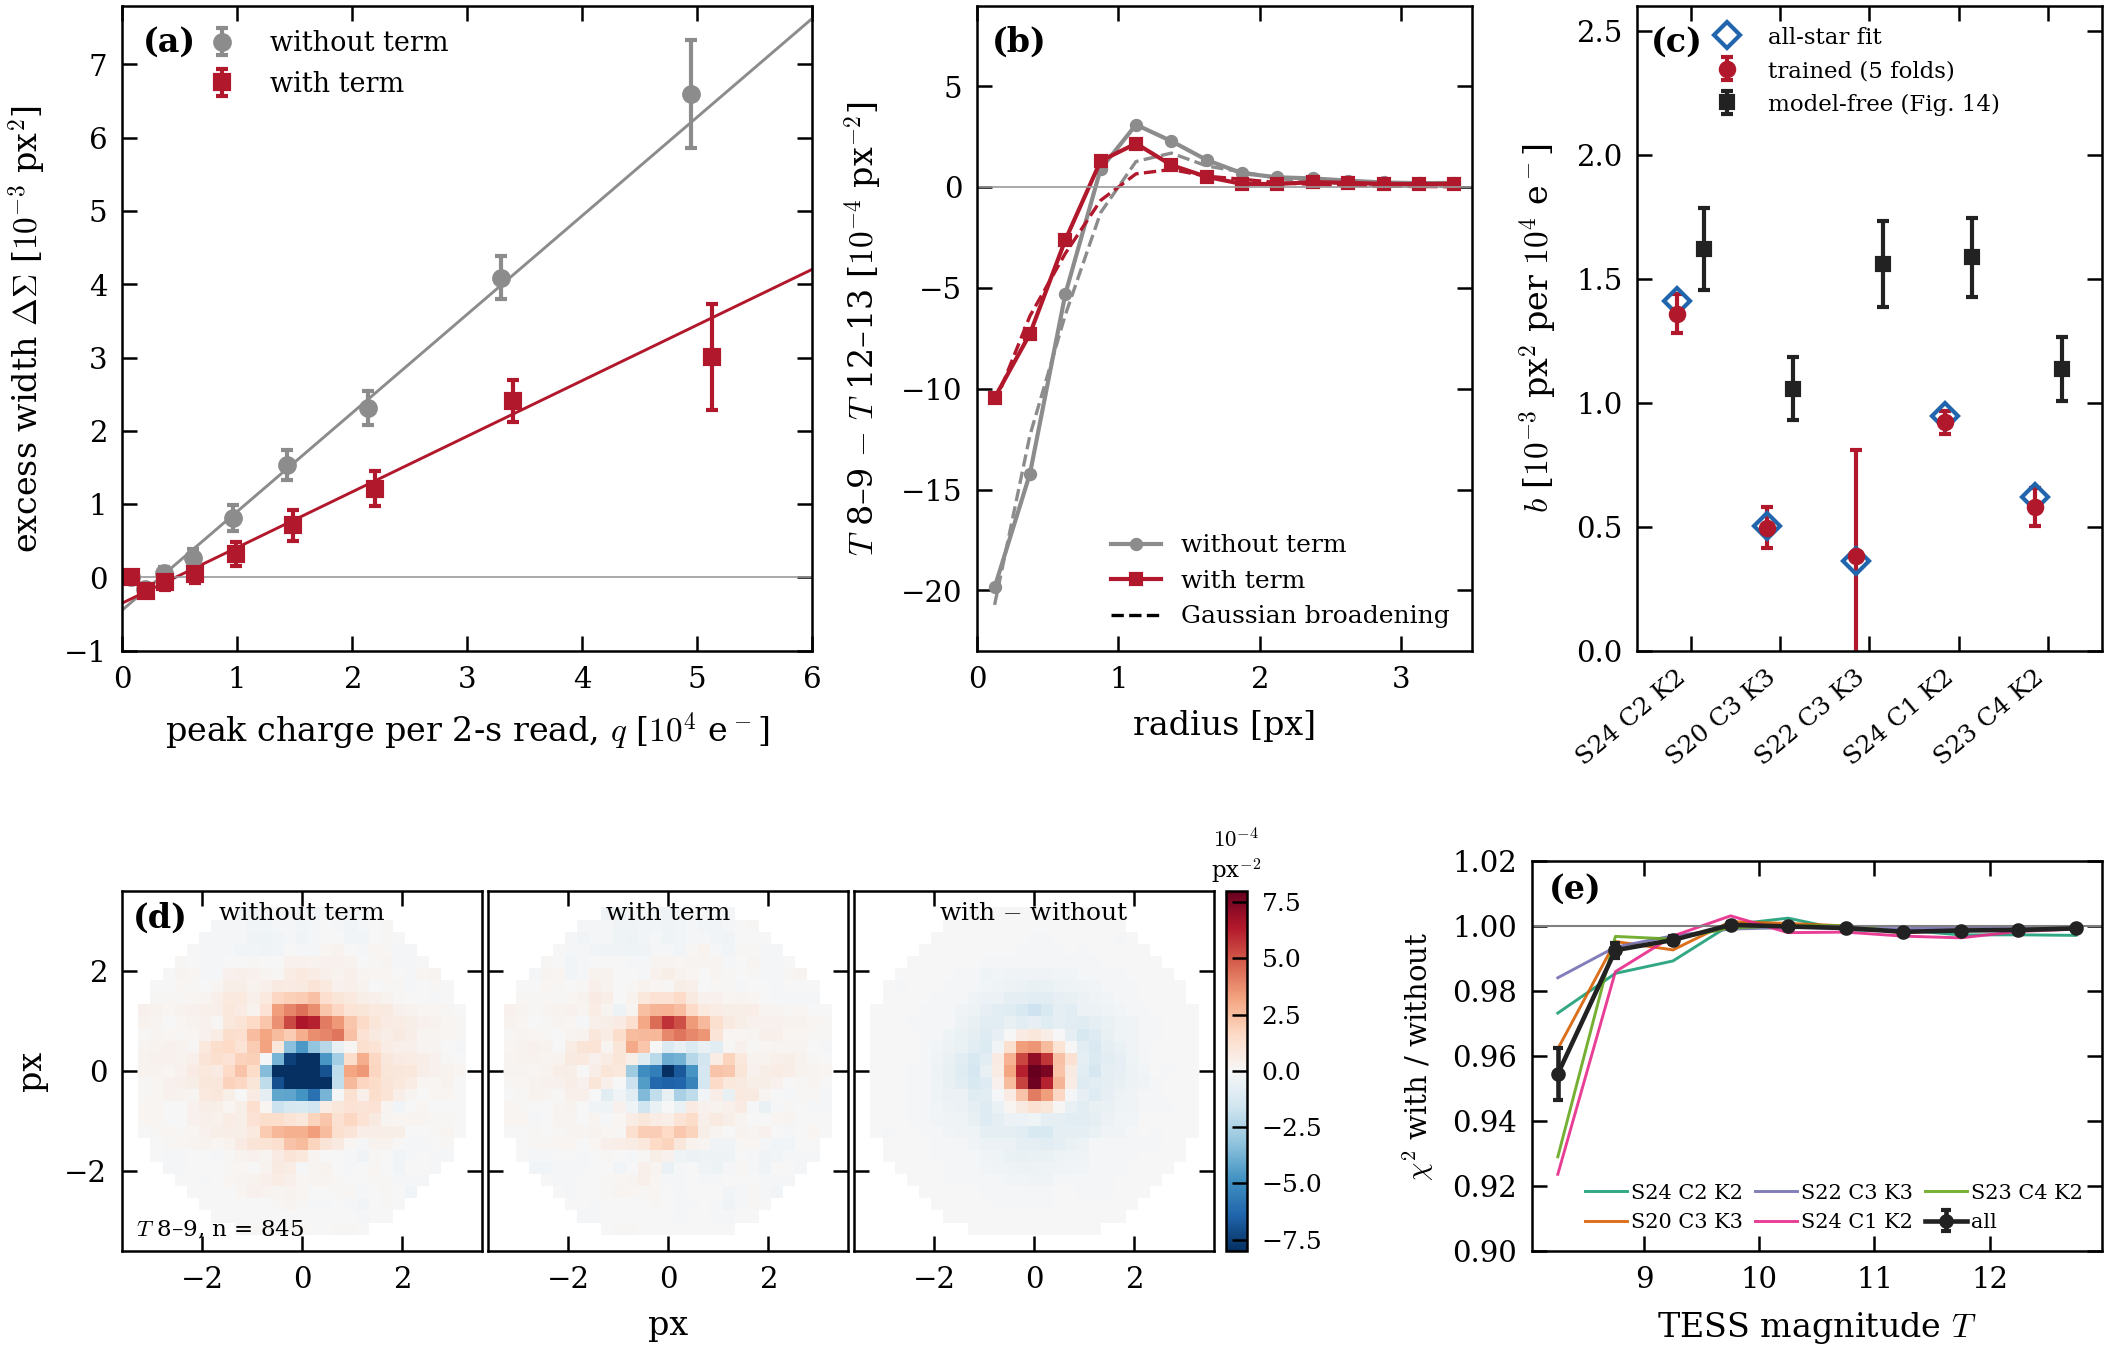
- The term removes about half of the observed broadening: the pooled slope falls from $(1.34\pm0.07)$ to $(0.72\pm0.06)\times10^{-3}$ px$^2$ per $10^4$ e$^-$. The trained $b$ is below the model-free slope in every field, and it is poorly pinned in a single image (held-out $\chi^2$ is flat in $b$ between about 0.4 and $1.4\times10^{-3}$).
- Injected values of $b$ are recovered without bias, and the null case gives no spurious $b$.
- The held-out $\chi^2$ falls by $1.2\pm0.2$ % at $T=8$–10.5 and 0.15 % at $T=10.5$–13. PSF magnitudes change by $-0.6$ mmag at $T\approx8$ and $+0.2$ mmag at $T\approx13$; aperture fluxes within 3 and 5 px by at most 0.35 ppt.
- A threshold in $q$ (zero below $3\times10^3$ e$^-$) recovers most of the missing amplitude (preliminary).
We do not adopt the term: it captures only half of the effect, its single-image coefficient is poorly determined and differs between fields, and it failed a pre-registered gate on the pooled median $\chi^2$ ratio (0.9990 against the required 0.994). A complete model is future work.
(a) Excess width against peak charge, all fields pooled, without (grey) and with (red) the term. (b) Azimuthal profile of the $T=8$–9 minus $T=12$–13 stack difference, without and with the term. (c) Coefficient $b$ per field, trained (red), from all-star fits (blue) and the model-free slope of Fig. 14 (black). (d) Stacked residuals at $T=8$–9 without and with the term. (e) Ratio of held-out $\chi^2$ per star, with over without the term, per 0.5-mag bin.
F Template core deficit near PS1 saturation
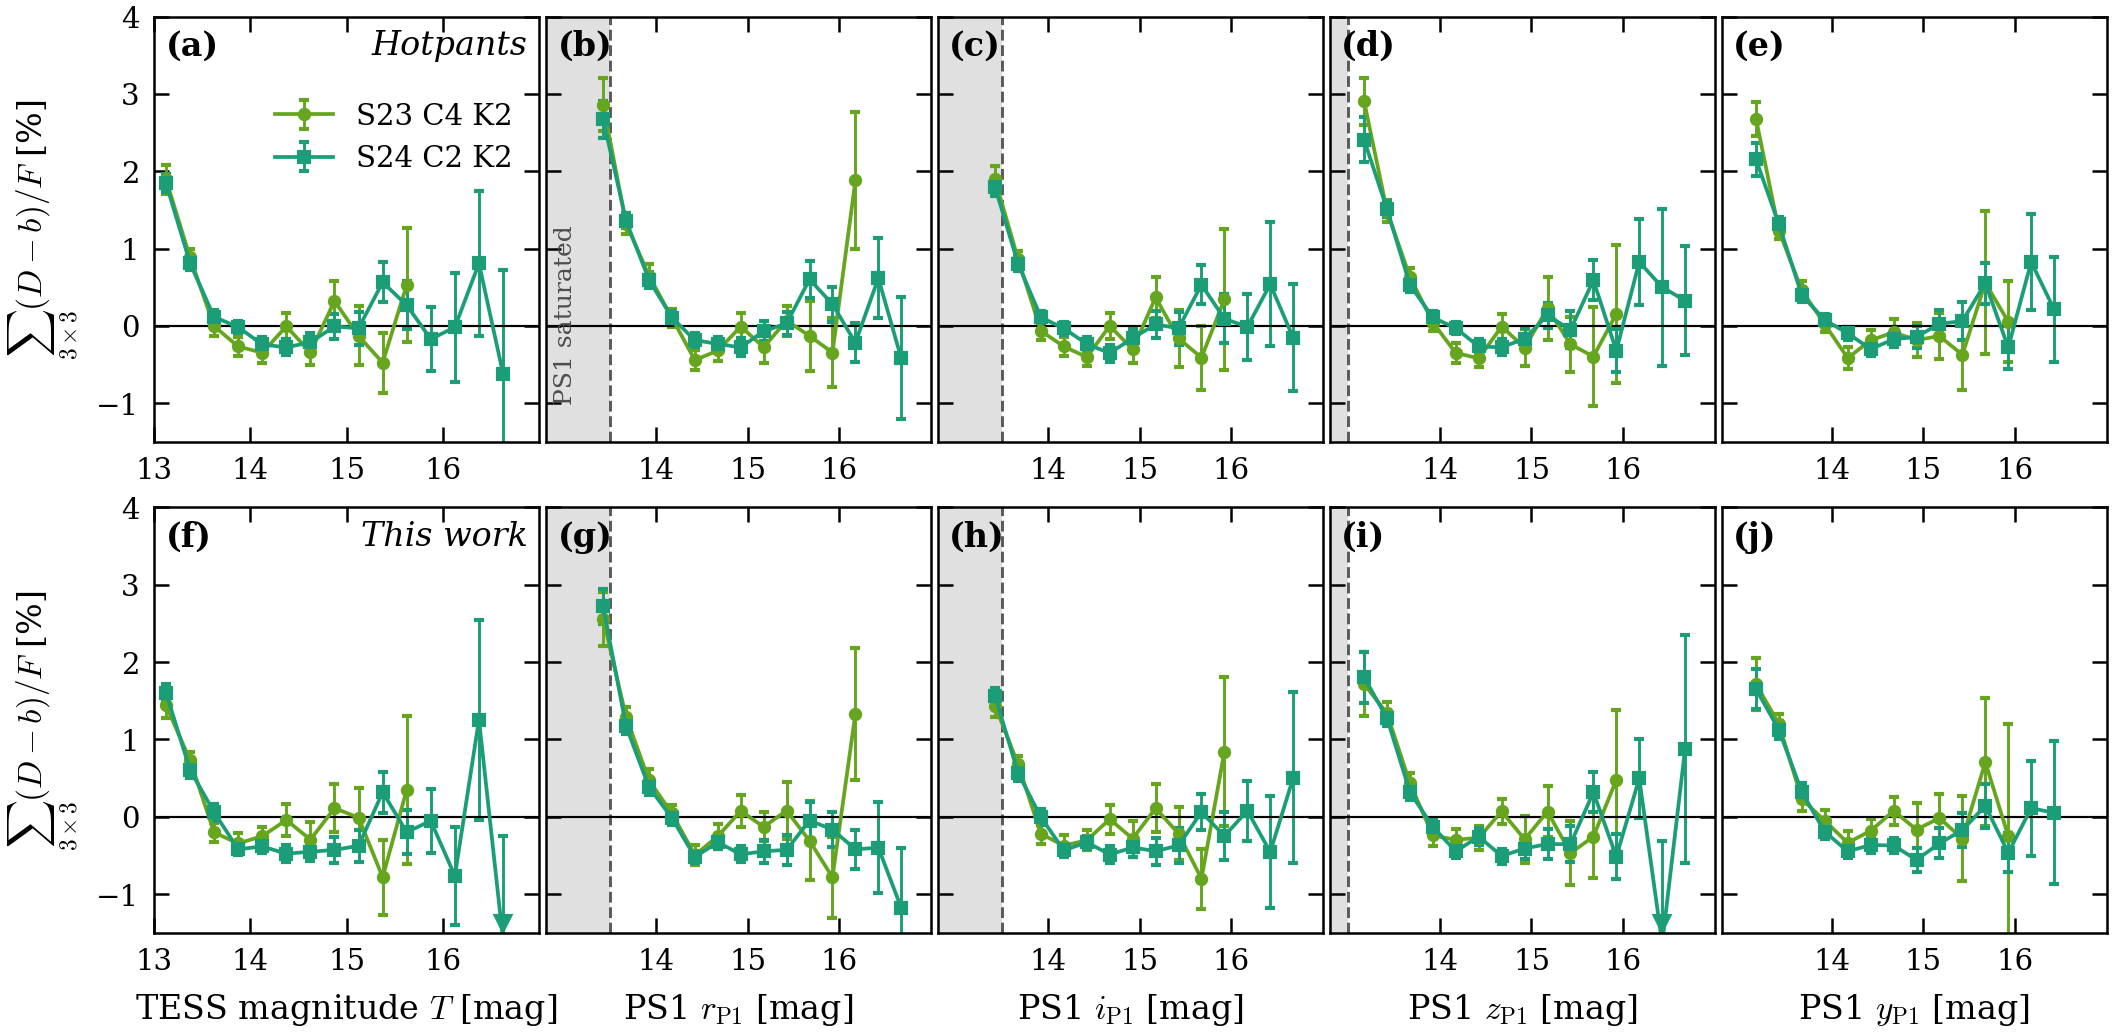
- Mid-colour stars just fainter than the bright-star removal limit show a 1.5–3 % positive core residual: the data are brighter than the template. It is gone by $T\approx14$, the same in two fields and with both Hotpants and the per-band kernels, so it is a property of the PS1 template, not of the subtraction.
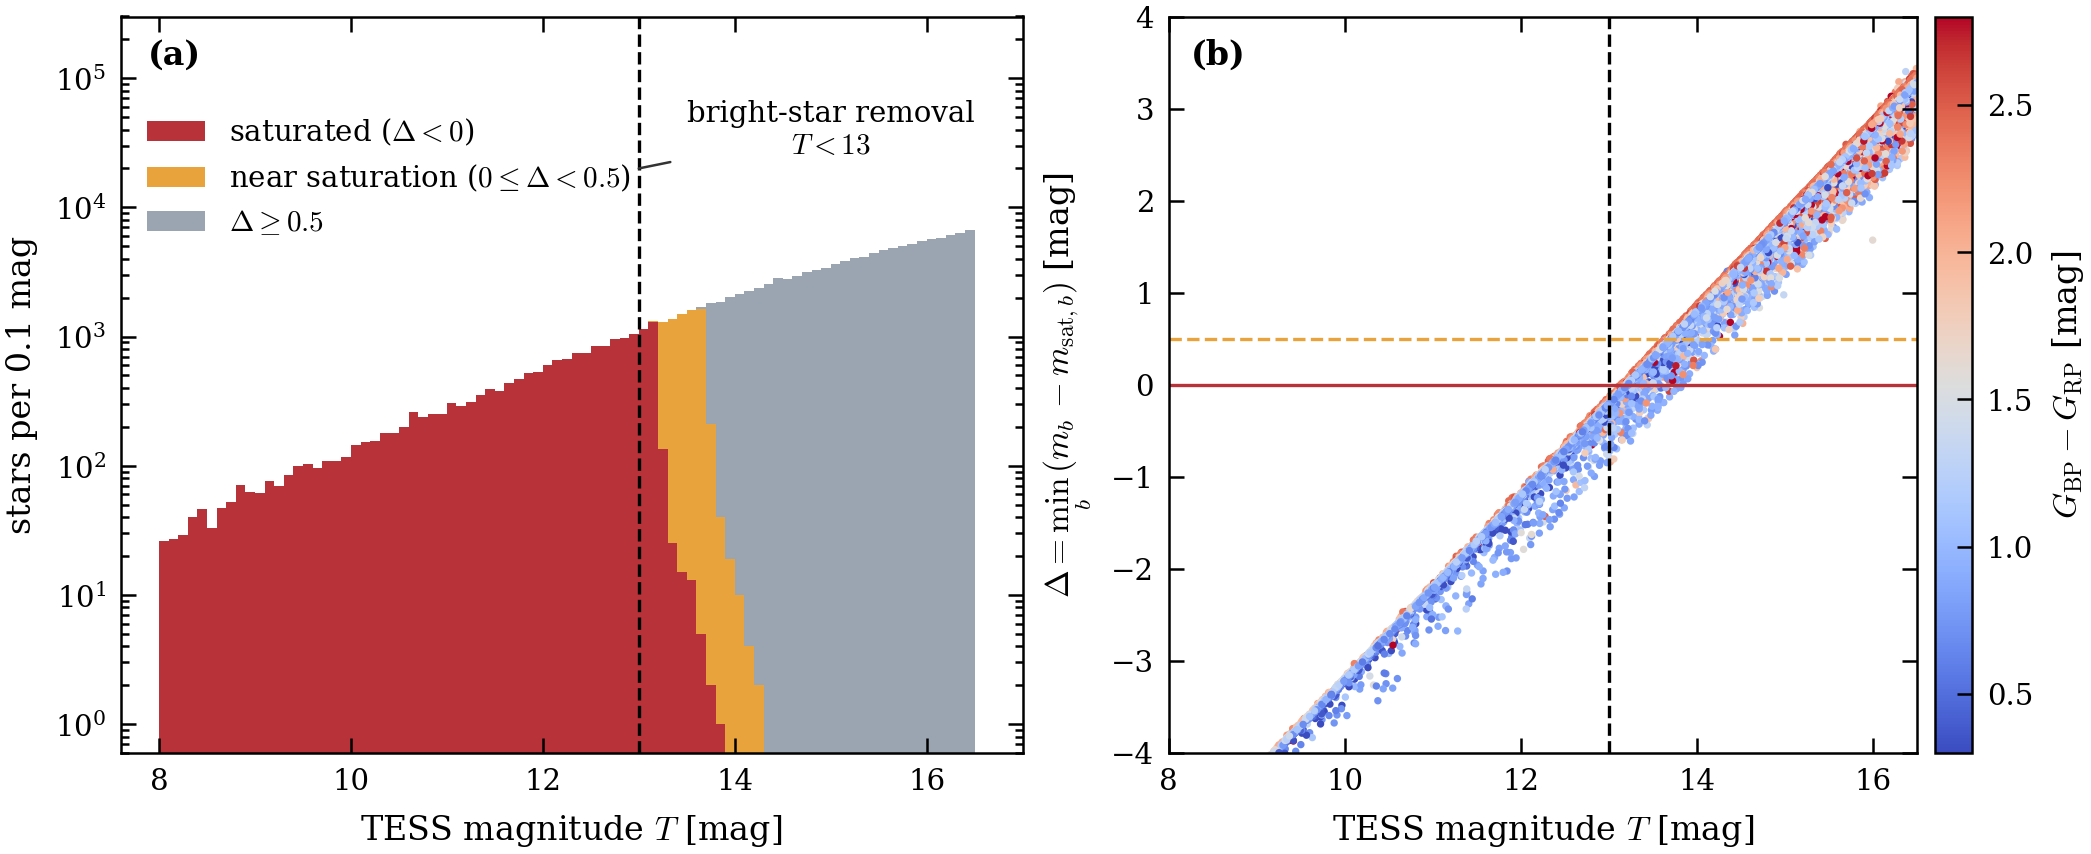
- Stars saturated in at least one PS1 band persist to $T\approx13.9$, and stars within 0.5 mag of saturation to $T\approx14.2$, beyond the current removal limit of $T<13$. In $r$ the excess starts at the $r$ saturation line; in $z$ and $y$ it starts 0.5–1.5 mag fainter than their limits.
- Our measured onset is near $i\approx14.1$, with no excess at $i=14.1$–15. This implies a removal limit of $T<13.7$ (99 %) or $T<13.95$ (99.9 %). The pipeline is unchanged; this is a future-work line.
- Rest et al. (2014, §5.3.1) find deep stacks fainter than nightly stacks by $0.017\pm0.0013$ mag in $i$ for the brightest bin, "most likely the result of imperfect stacking algorithms of stars close to or at the saturation limit"; we cite this for the mechanism and sign only. Tonry et al. (2018) quote accurate photometry only for stars fainter than $m\sim14$; Chambers et al. (2016) note non-linearity from about 40,000 counts.
- A plausible reading, labelled as such: the seeing spread (peak proportional to flux over FWHM$^2$) moves the single-exposure limit of about 13.5 to about 14.1 in the stack, matching where our excess ends.
Core residual of stars with $0.8\le G_{\rm BP}-G_{\rm RP}<1.5$ against TESS magnitude and against PS1 $r,i,z,y$ magnitude, for Hotpants and for the per-band kernels, in two fields. Shaded regions and dashed lines mark the PS1 saturation levels. Both difference images show the same 1–3 % positive residual for $T\lesssim13.7$, which falls to zero about 0.5 mag fainter than saturation in $r$ and $i$.
(a) Stars per 0.1 mag in S24 C2 K2, stacked by status: saturated in at least one band, within 0.5 mag of saturation, and farther. The dashed line marks the removal limit $T<13$. (b) Distance to saturation $\Delta=\min_b(m_b-m_{{\rm sat},b})$ for each star, coloured by $G_{\rm BP}-G_{\rm RP}$, where $m_b$ is the Gaia-XP synthetic PS1 magnitude and $m_{{\rm sat},b}$ the saturation level. Saturated stars reach $T\approx13.9$ and near-saturated stars $T\approx14.2$.