Current-generation five-fold A3 models · inspected 2026-10-04 · no new fitting
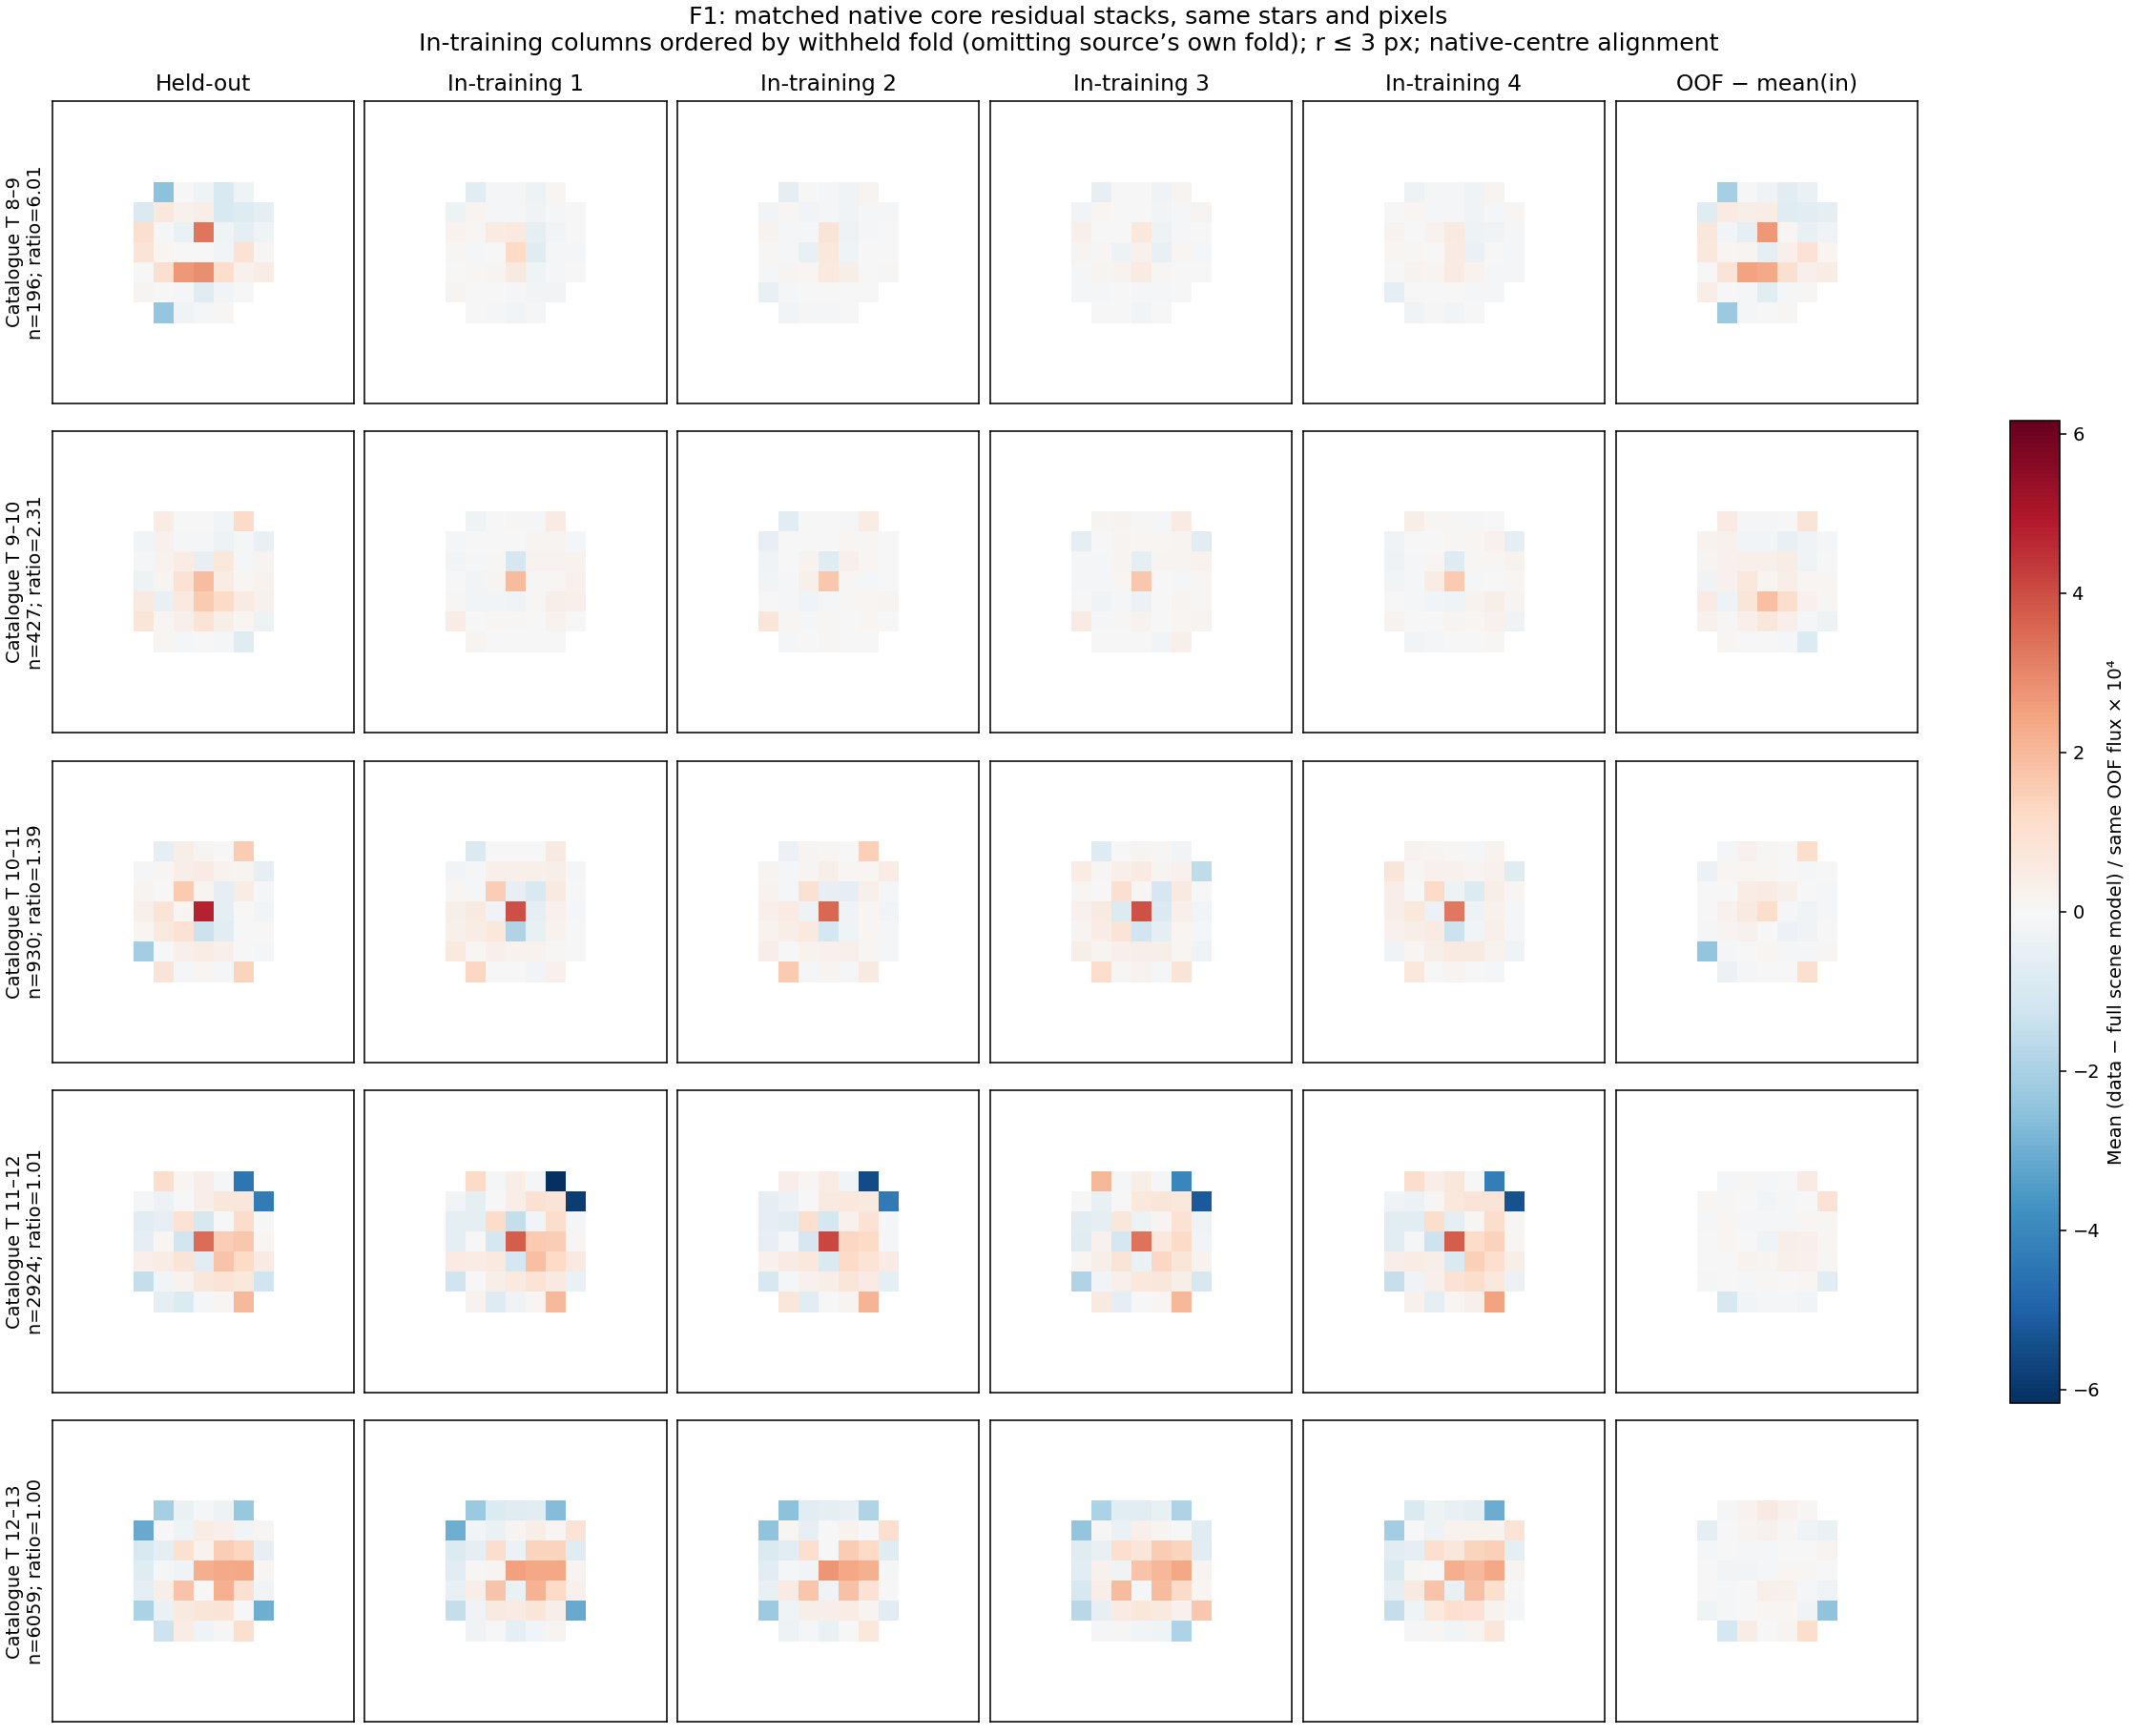
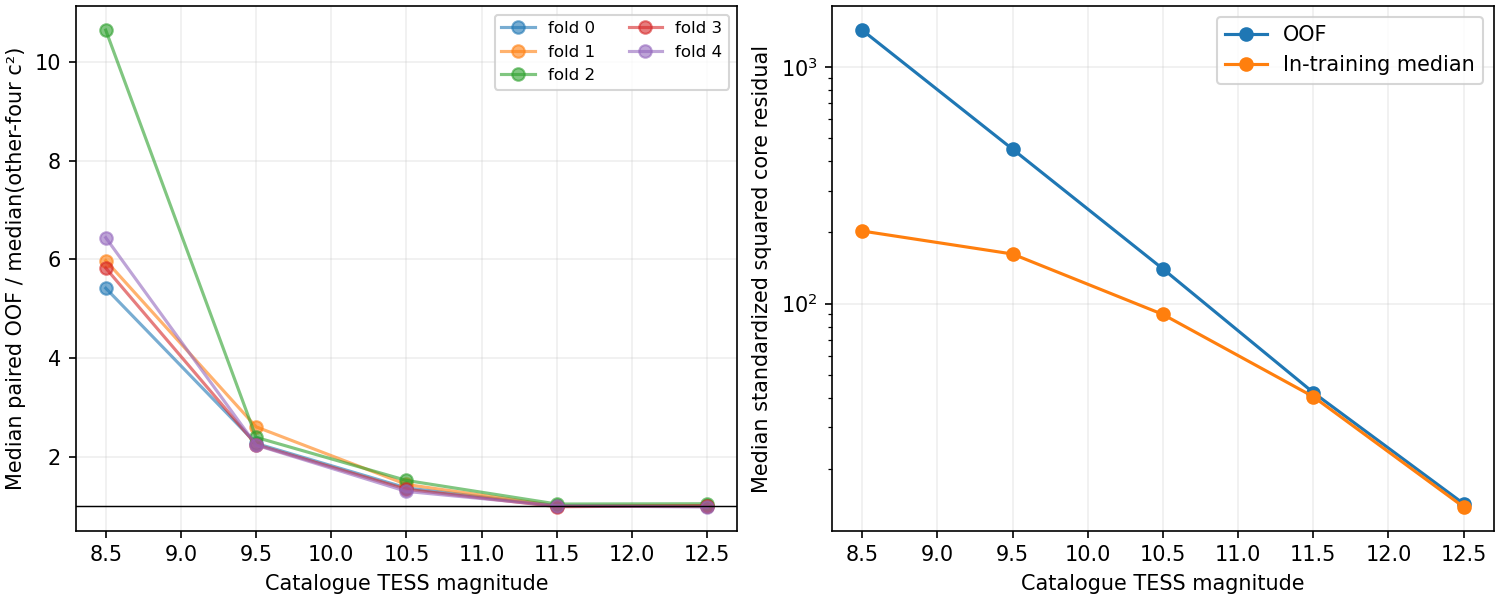
Conclusion: F1 has a visible brightness-dependent held-out training gap on the same pixels. Fainter bins retain common residual structure even where the ratio is near one. These conditional comparisons do not isolate a unique cause or establish improved photometry.
Full methods, equations and provenance · Inspection manifest: all 60 grid PNGs · Shared residual-grid page: 30 K5 tabs published · Parent crossfit directory
| Catalogue T | Sources | Median paired OOF/in-training |
|---|---|---|
| 8-9 | 196 | 6.006 |
| 9-10 | 427 | 2.309 |
| 10-11 | 930 | 1.392 |
| 11-12 | 2924 | 1.006 |
| 12-13 | 6059 | 1.004 |
The comparator is each source’s median c² from the other four fold models, all evaluated on the same unmodified scene. c² is the mean standardized squared core residual; no degrees-of-freedom correction. Fluxes and nuisance prior calibration are conditional on the evaluation scene.
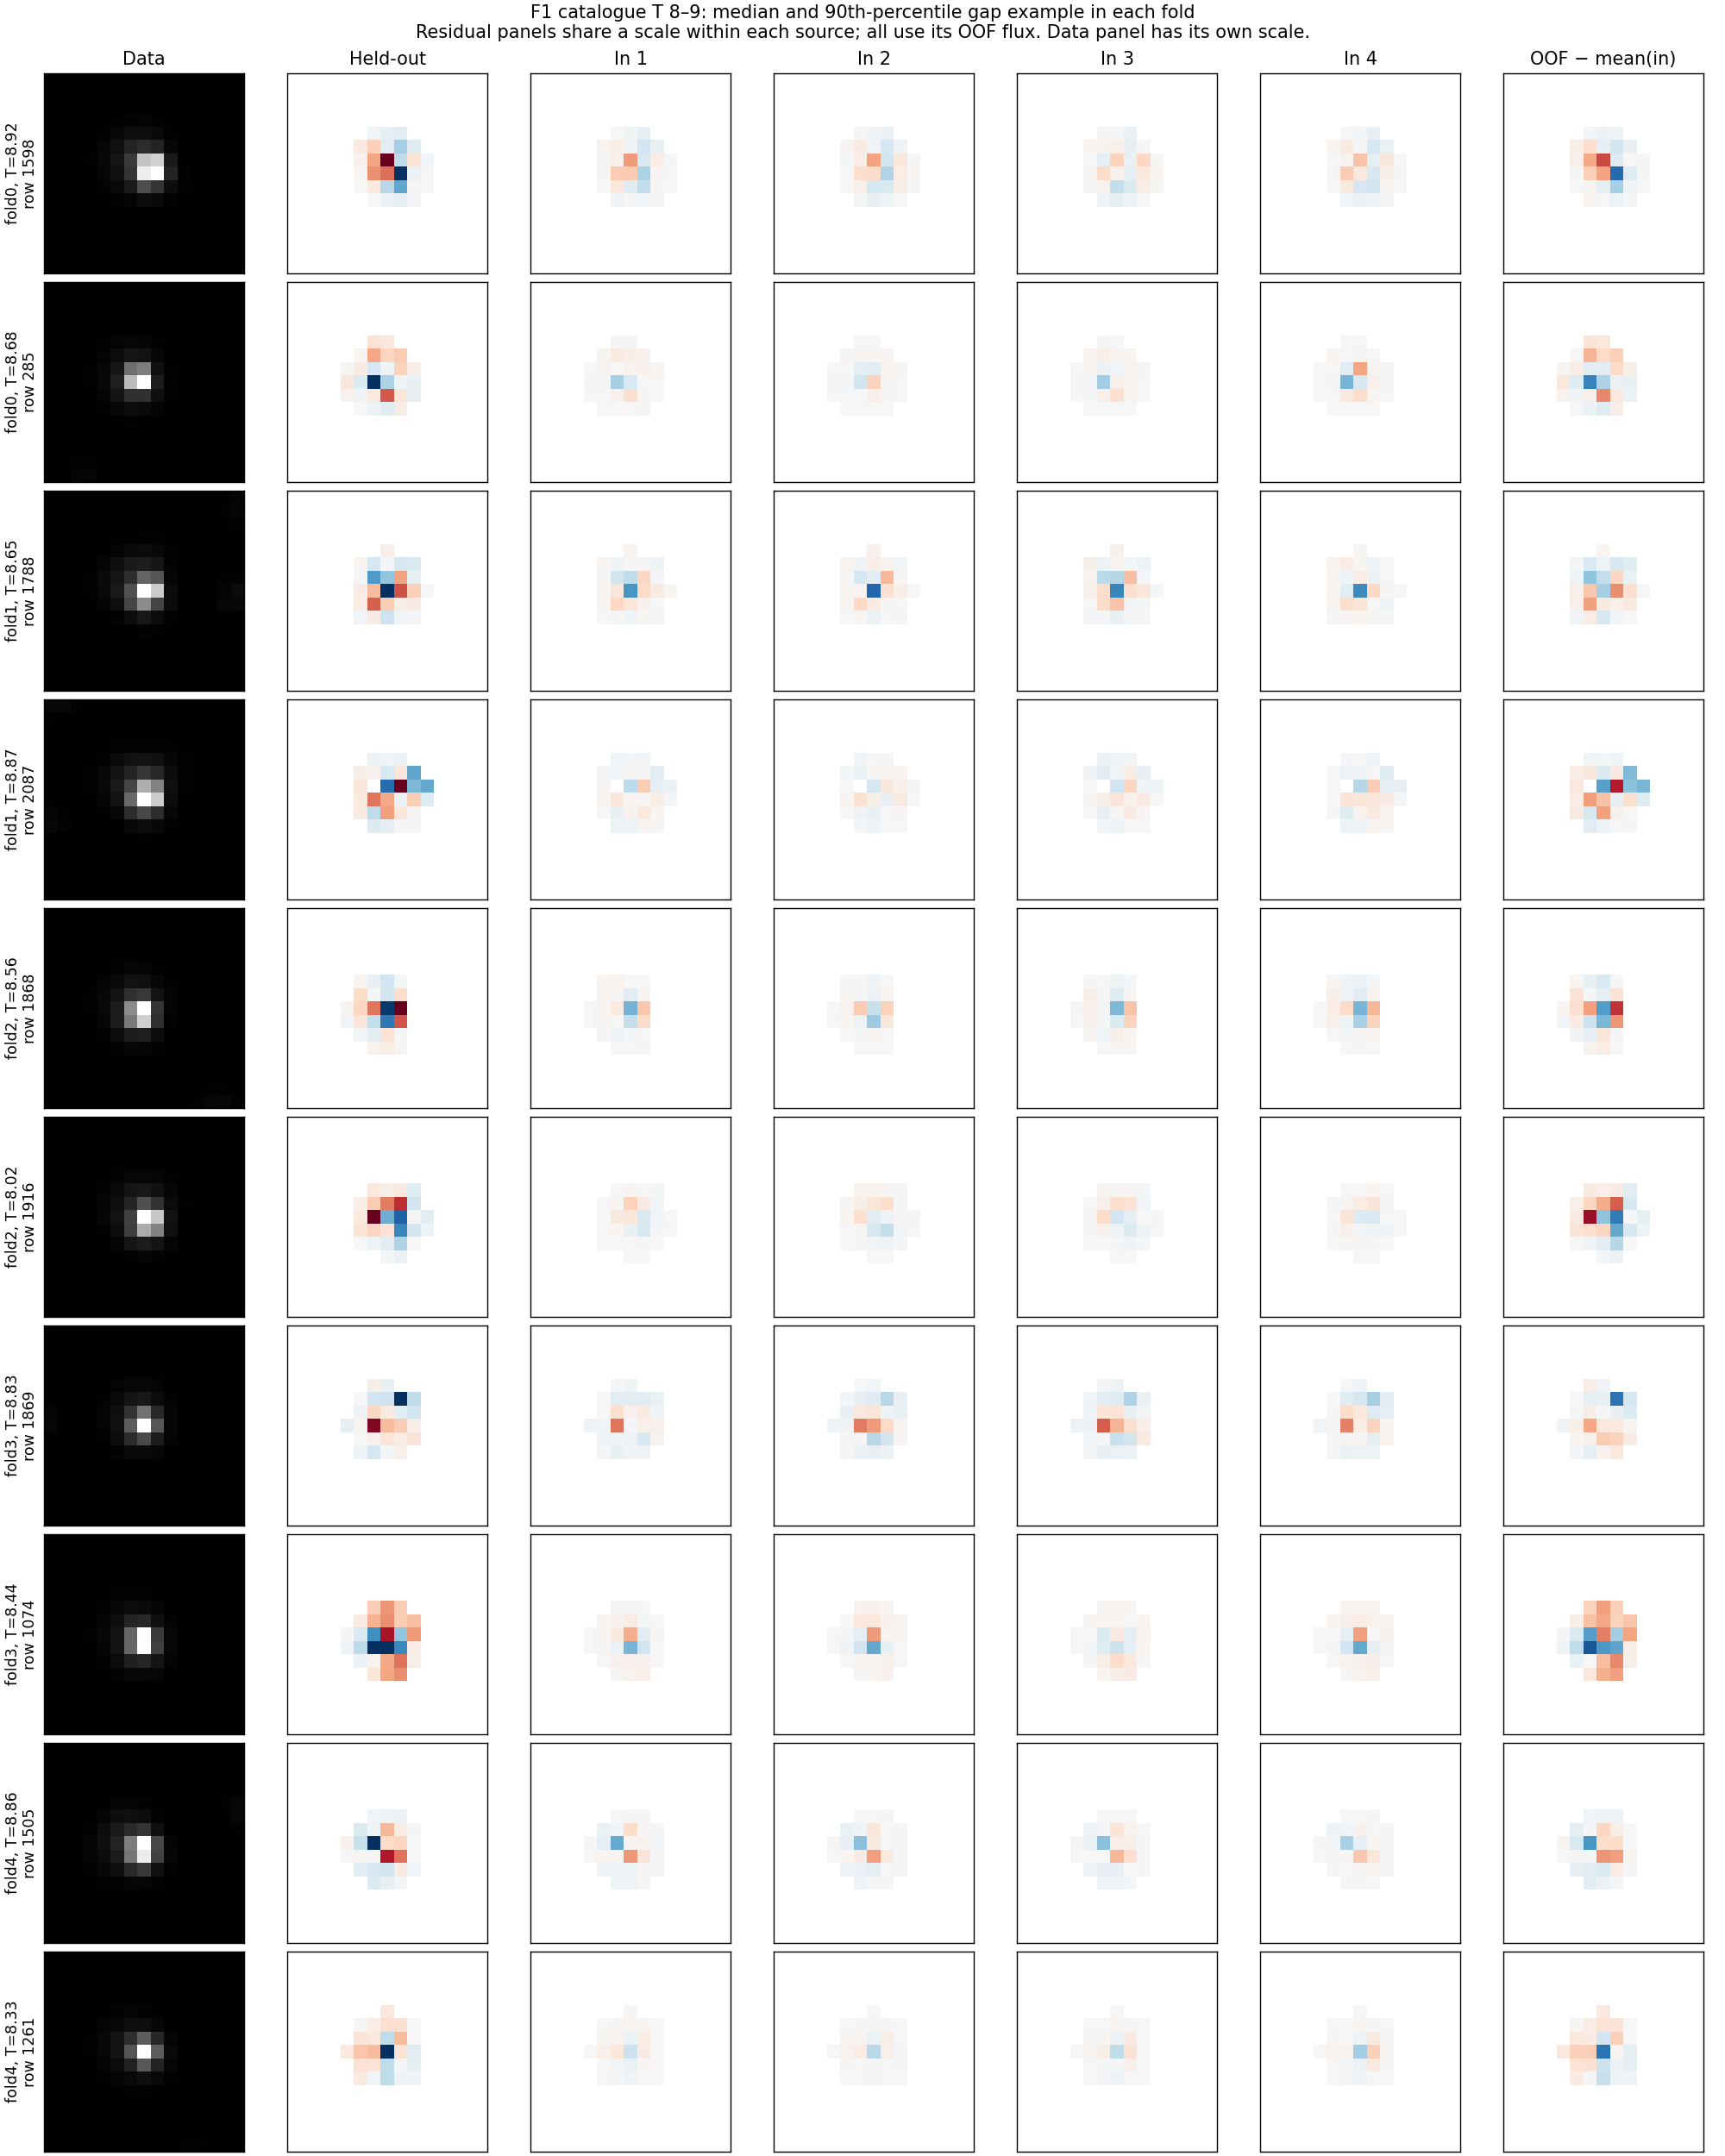
Select any source. Native residuals use exactly the same physical core mask and held-out flux denominator for every model. The residual colour scale is shared across the selected source’s six panels; outside-core pixels are white. Red is positive, blue negative; data uses grayscale. No recentering or interpolation.
All six panels share one grayscale intensity range. Only originally valid pixels are shown.
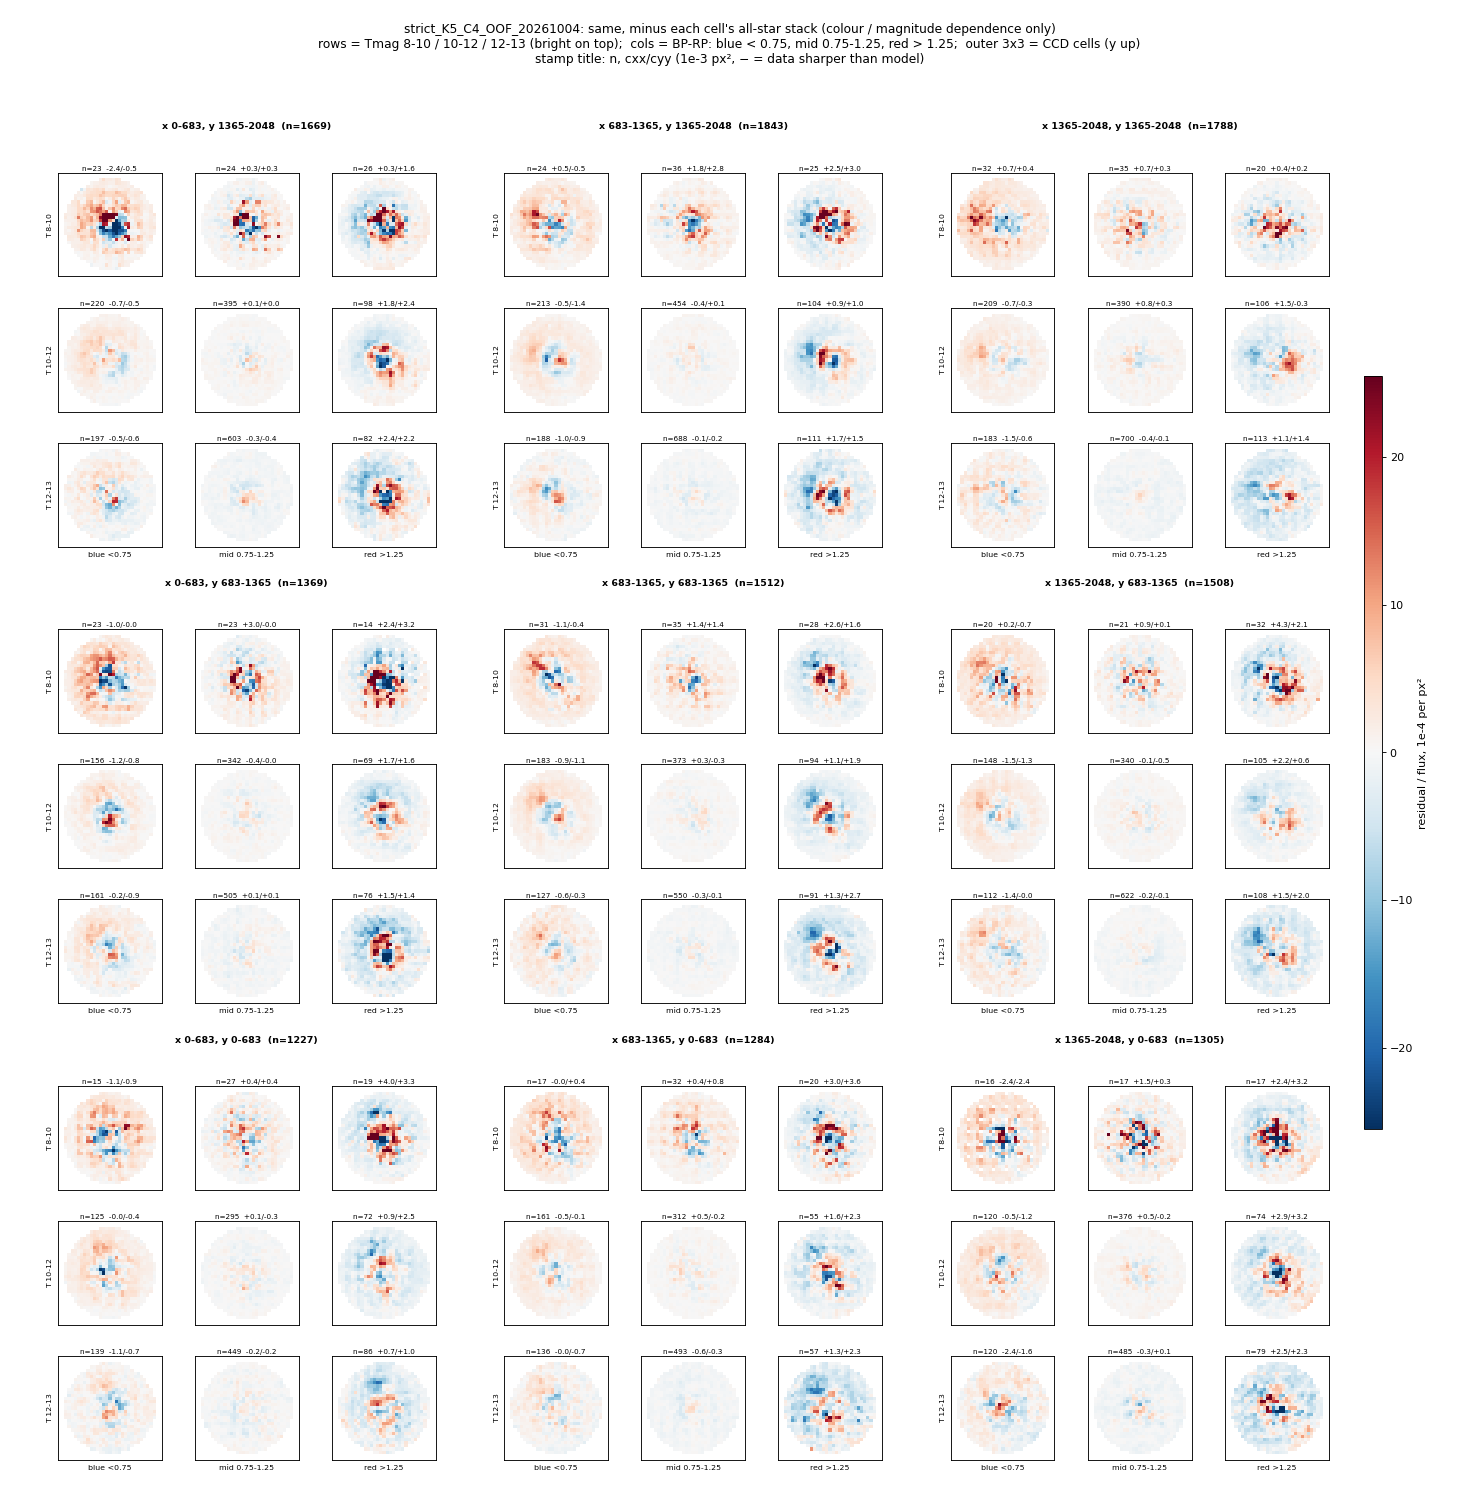
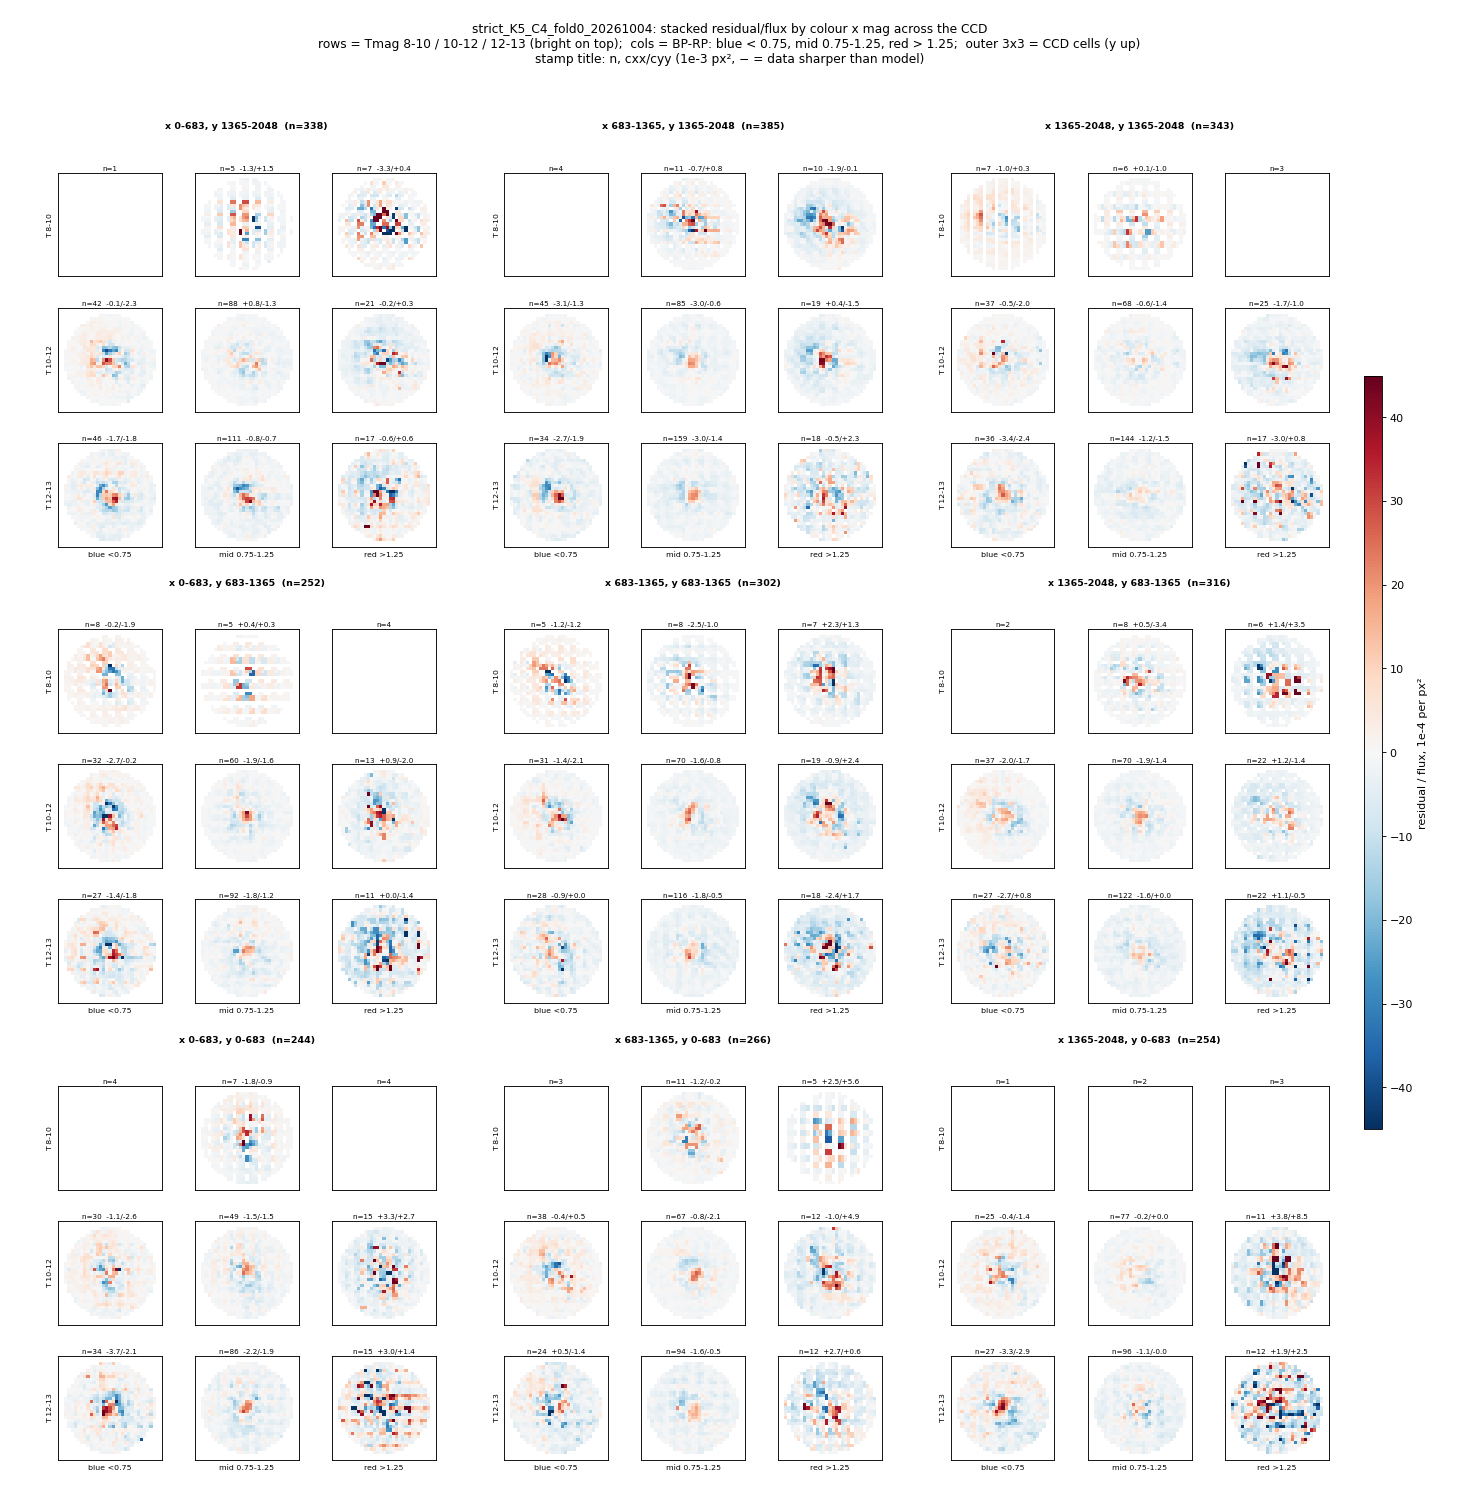
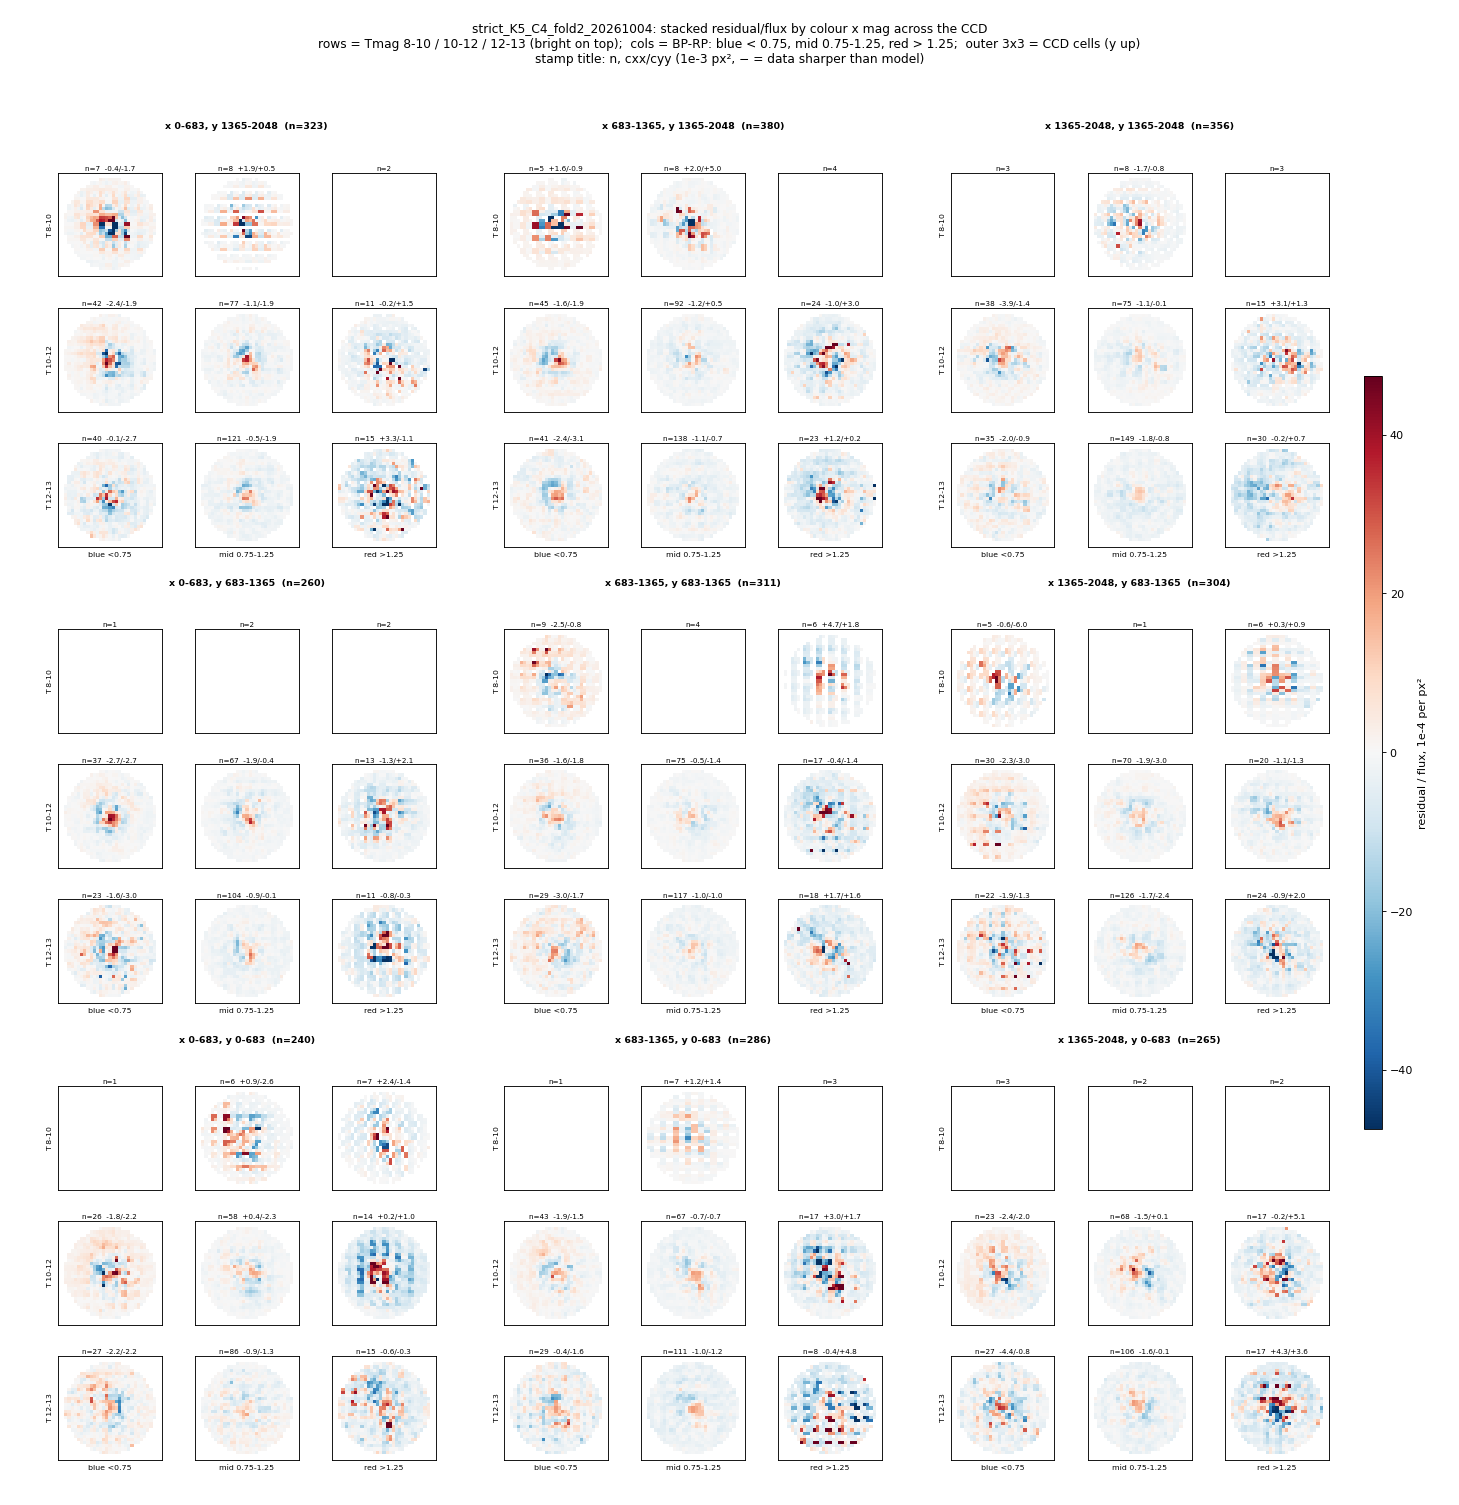
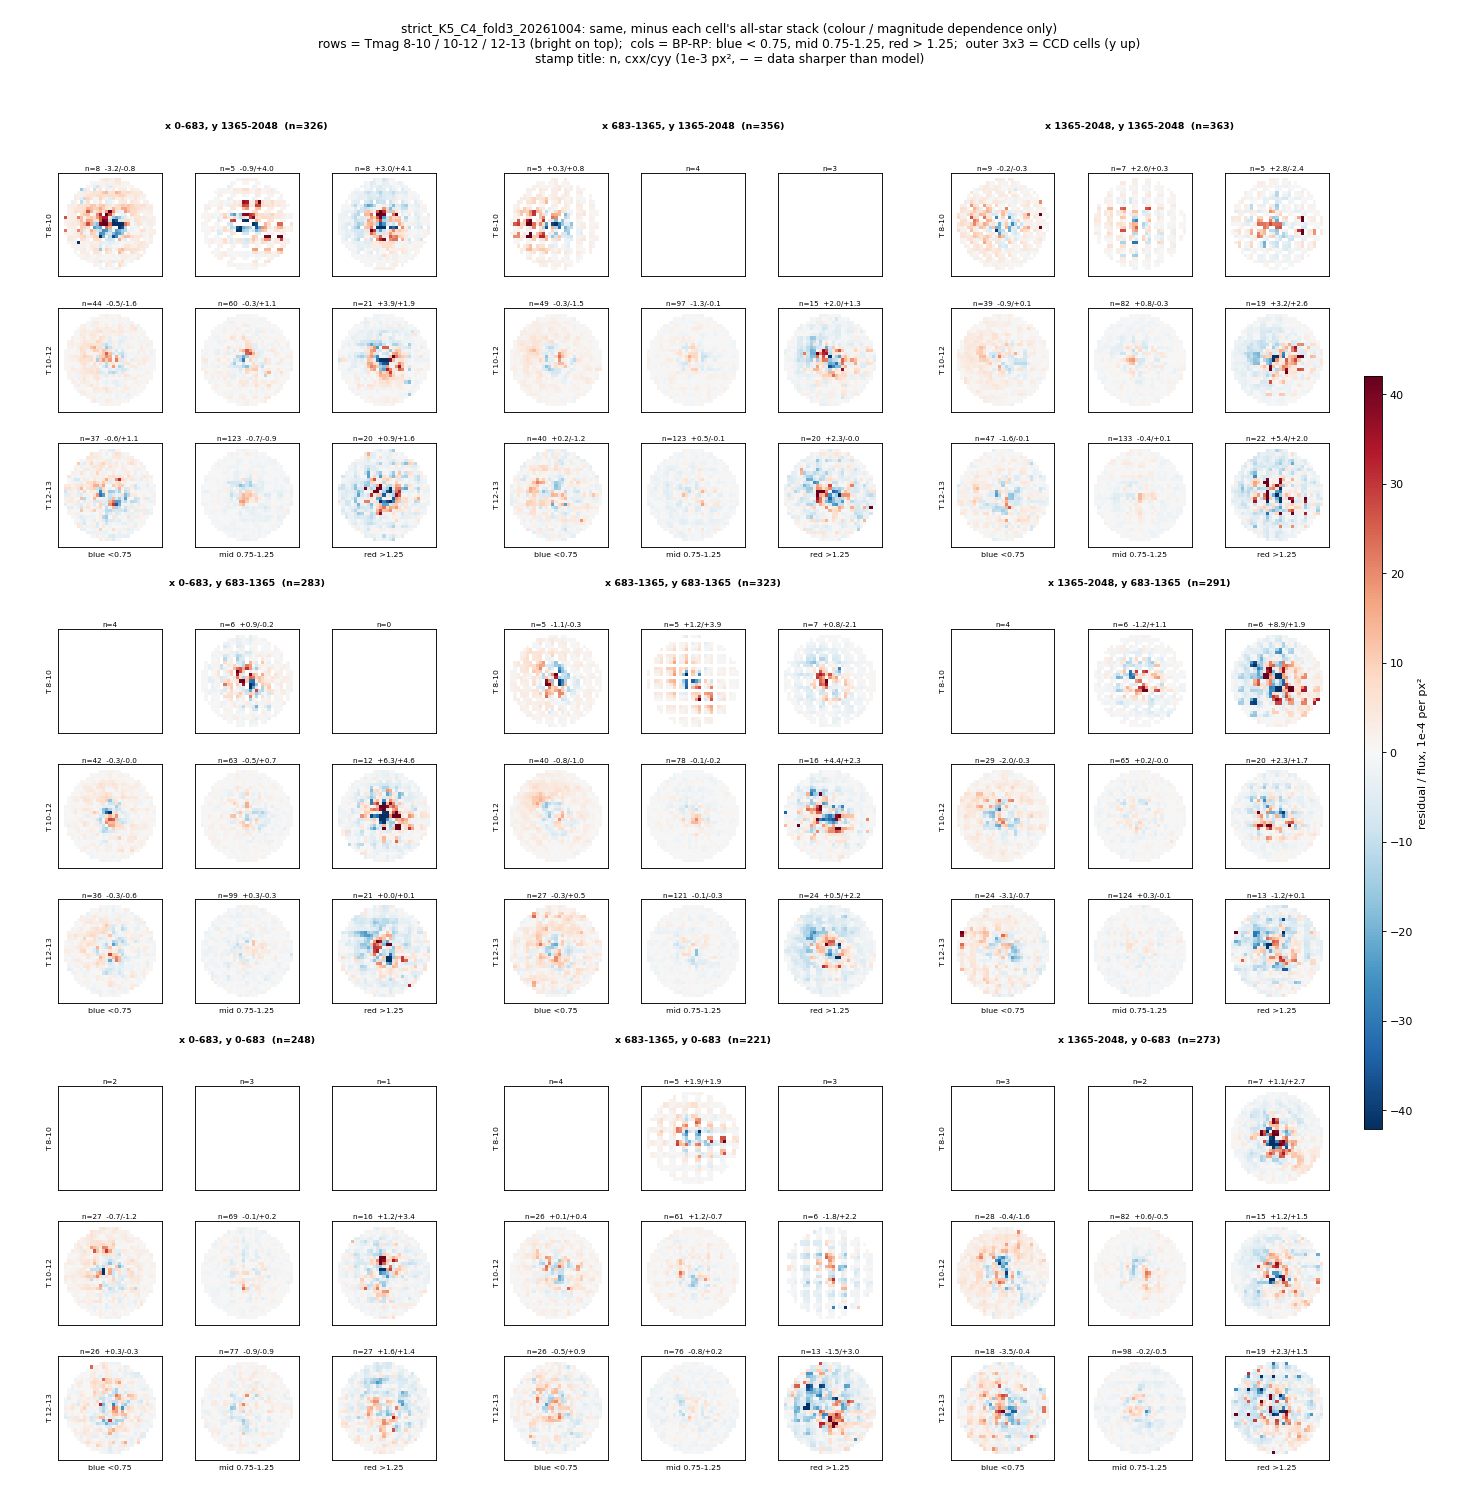
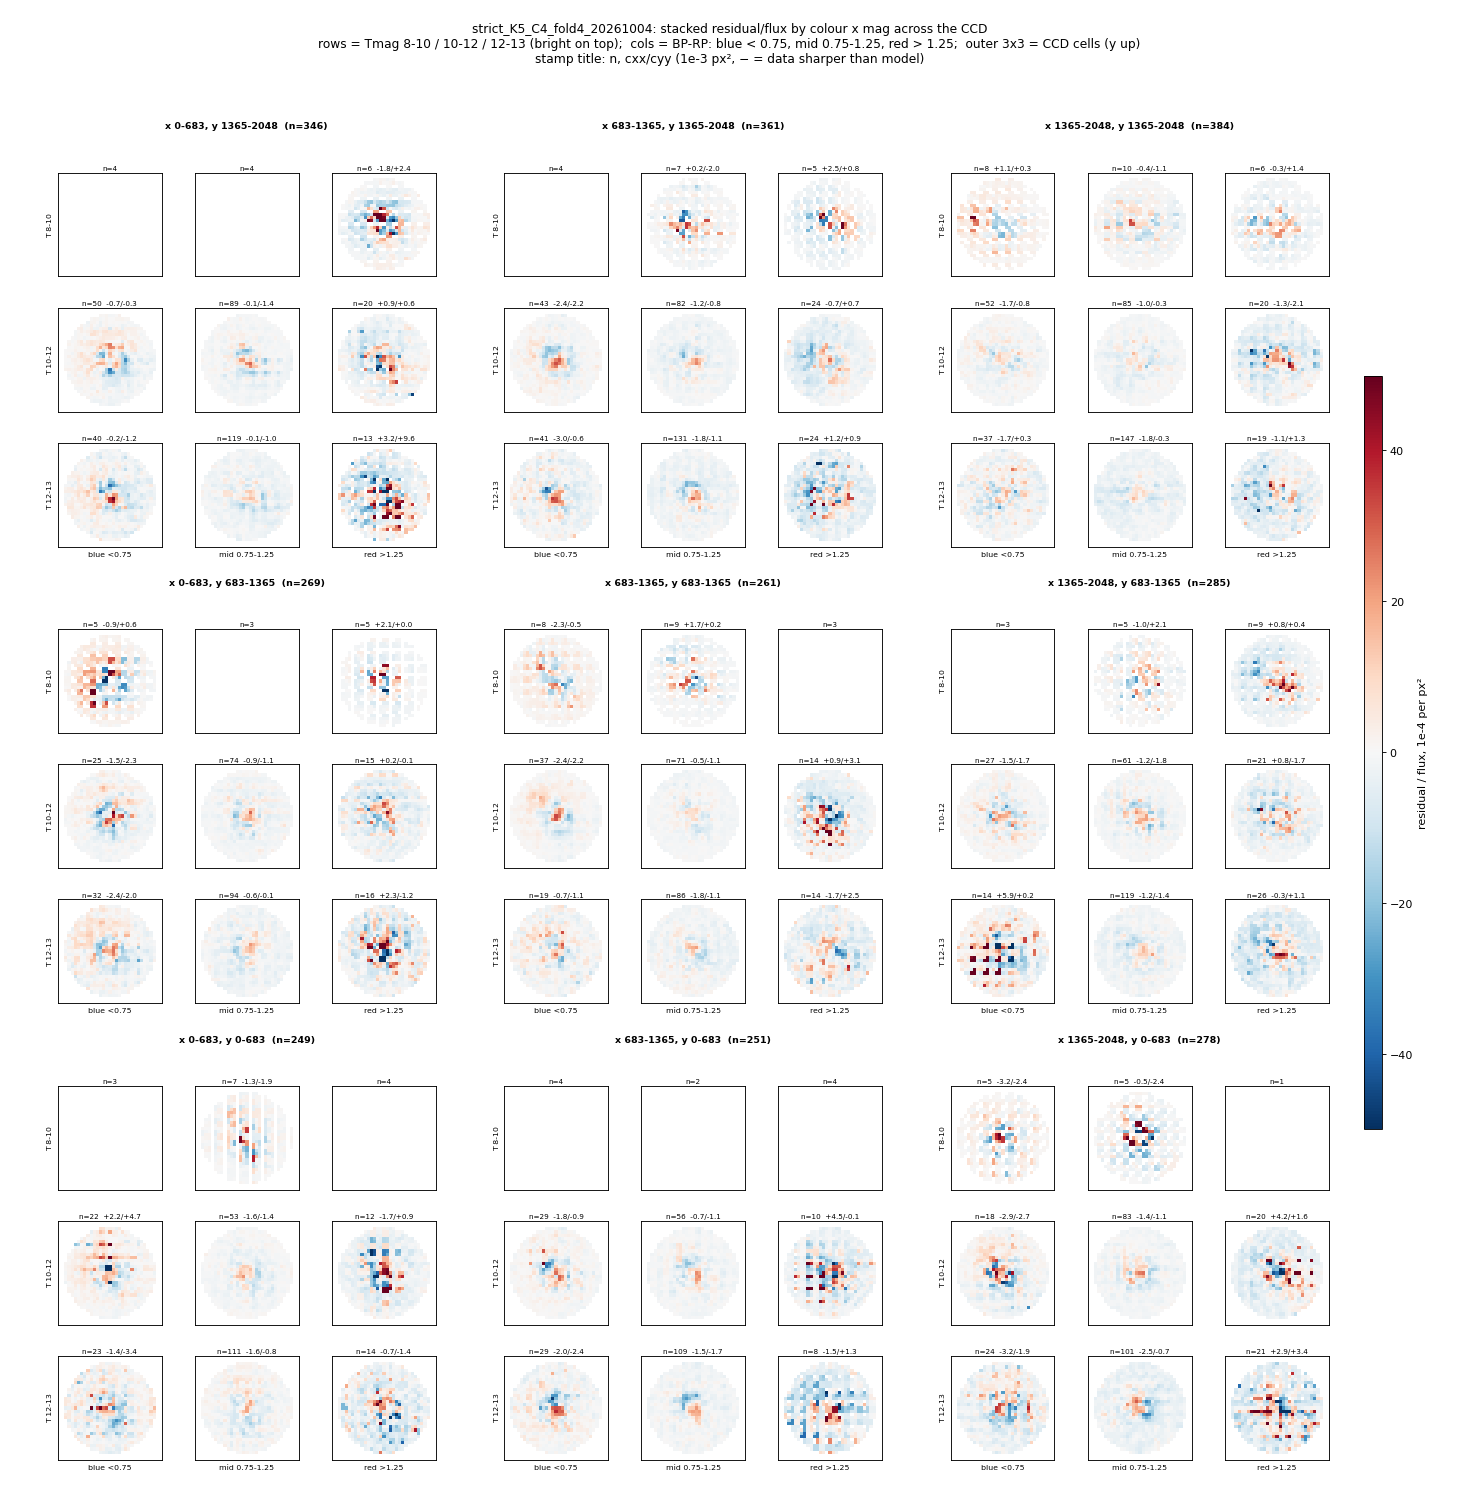
Absolute grids retain positive central cores in many blue/mid-colour faint bins and asymmetric red-bin residuals, strongest toward the right and lower CCD cells. Relative grids remove much of the common blue/mid-colour structure but retain red-bin asymmetry. Fold panels repeat the populated-cell patterns with substantial sparse-bin sampling stripes.
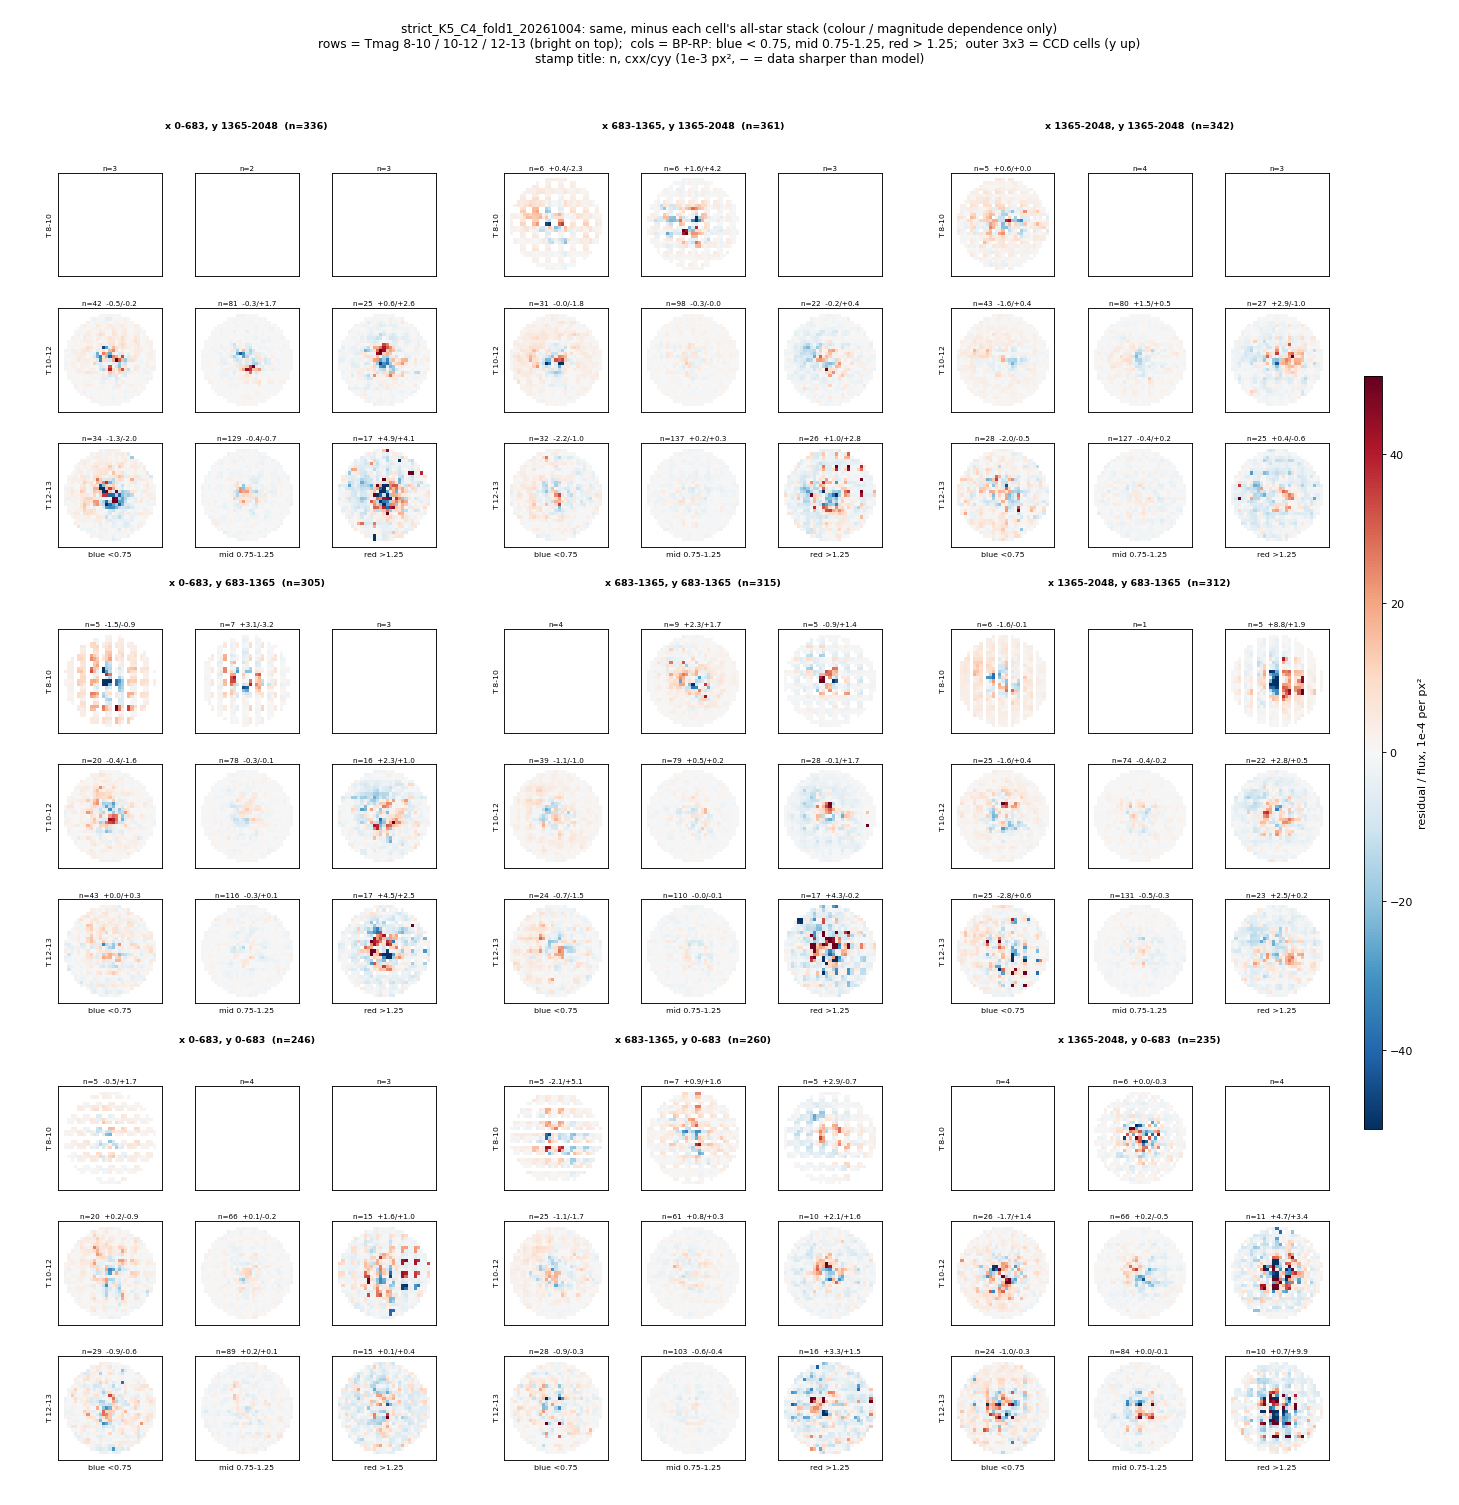
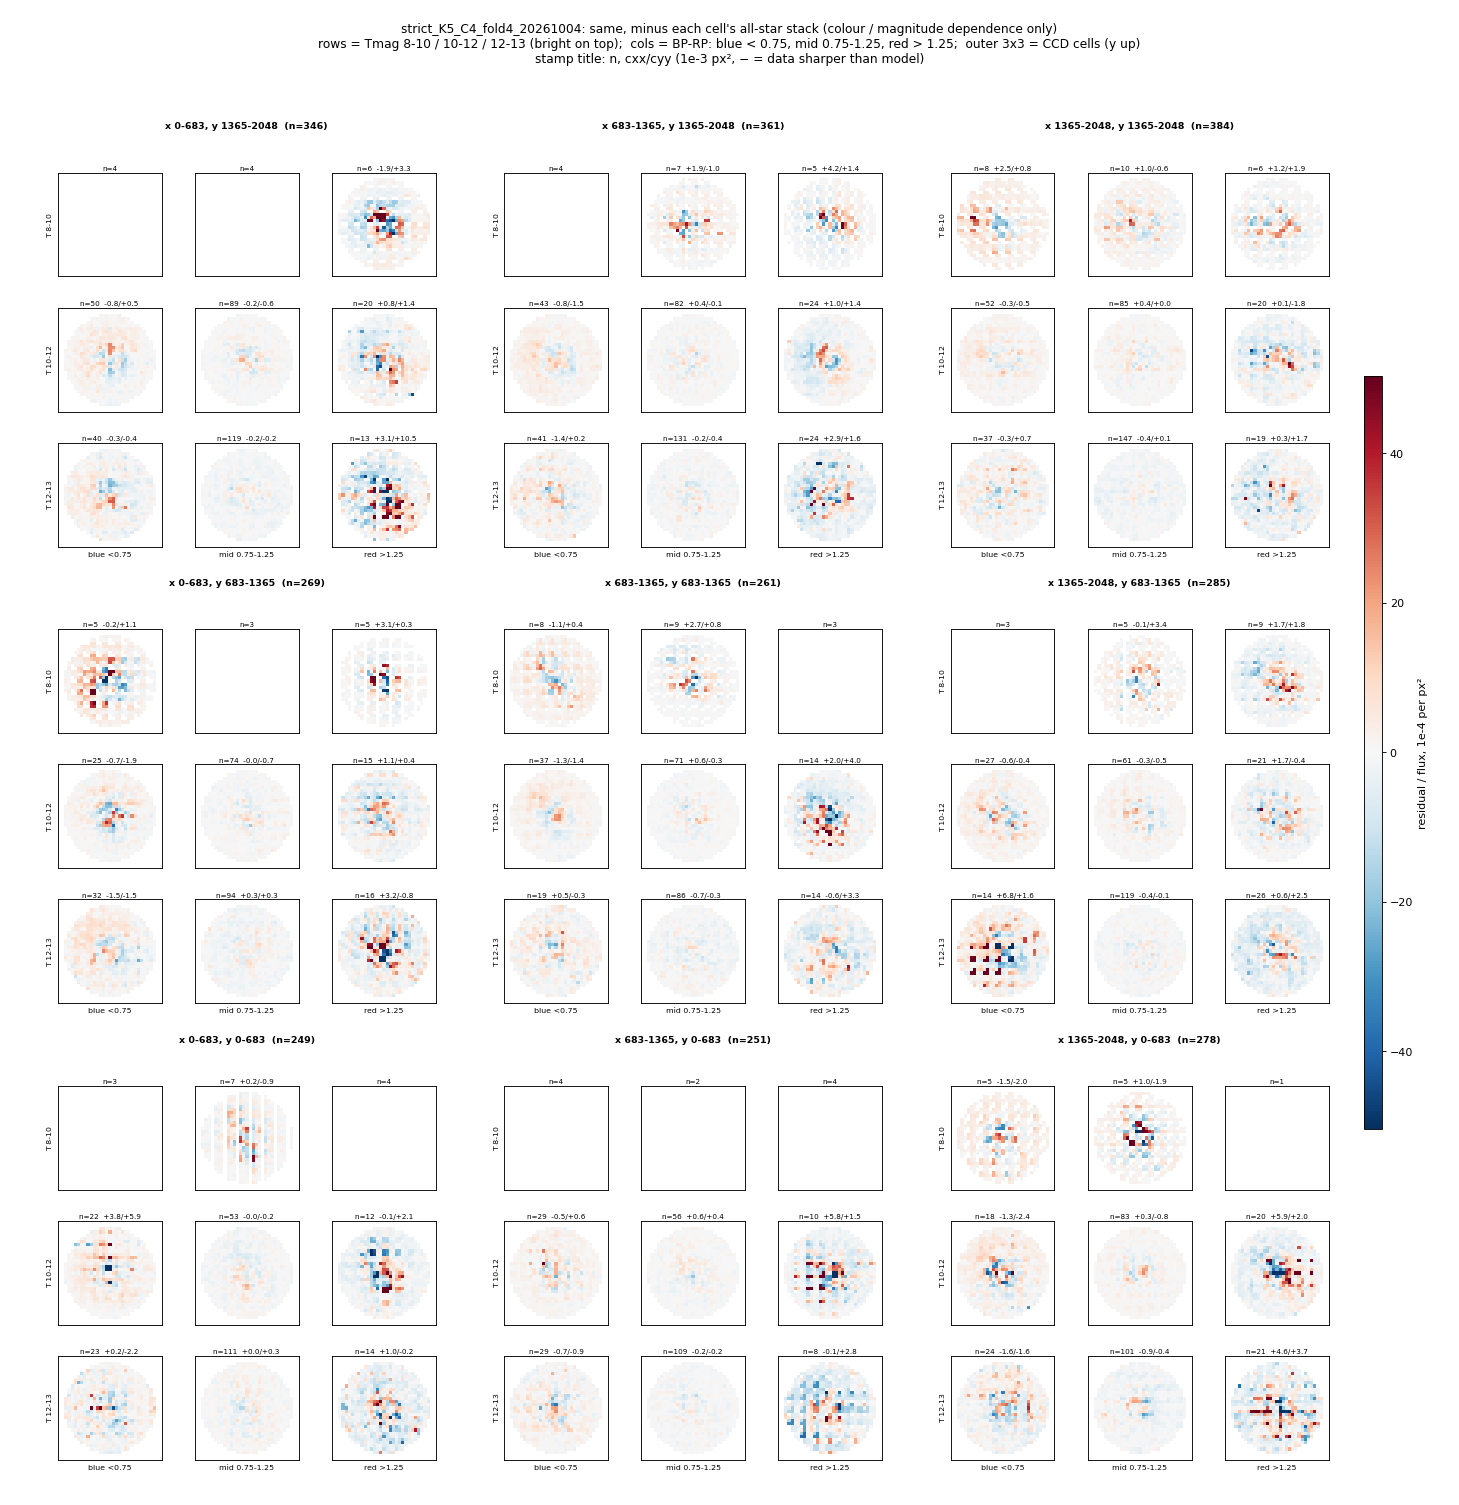
Display bins: Gaia BP−RP and fitted-flux-derived TESS magnitude, not catalogue T / fitted XP u. The relative grid subtracts each cell’s all-star stack. Colour limits vary between images; sparse or blank bins are not null detections.
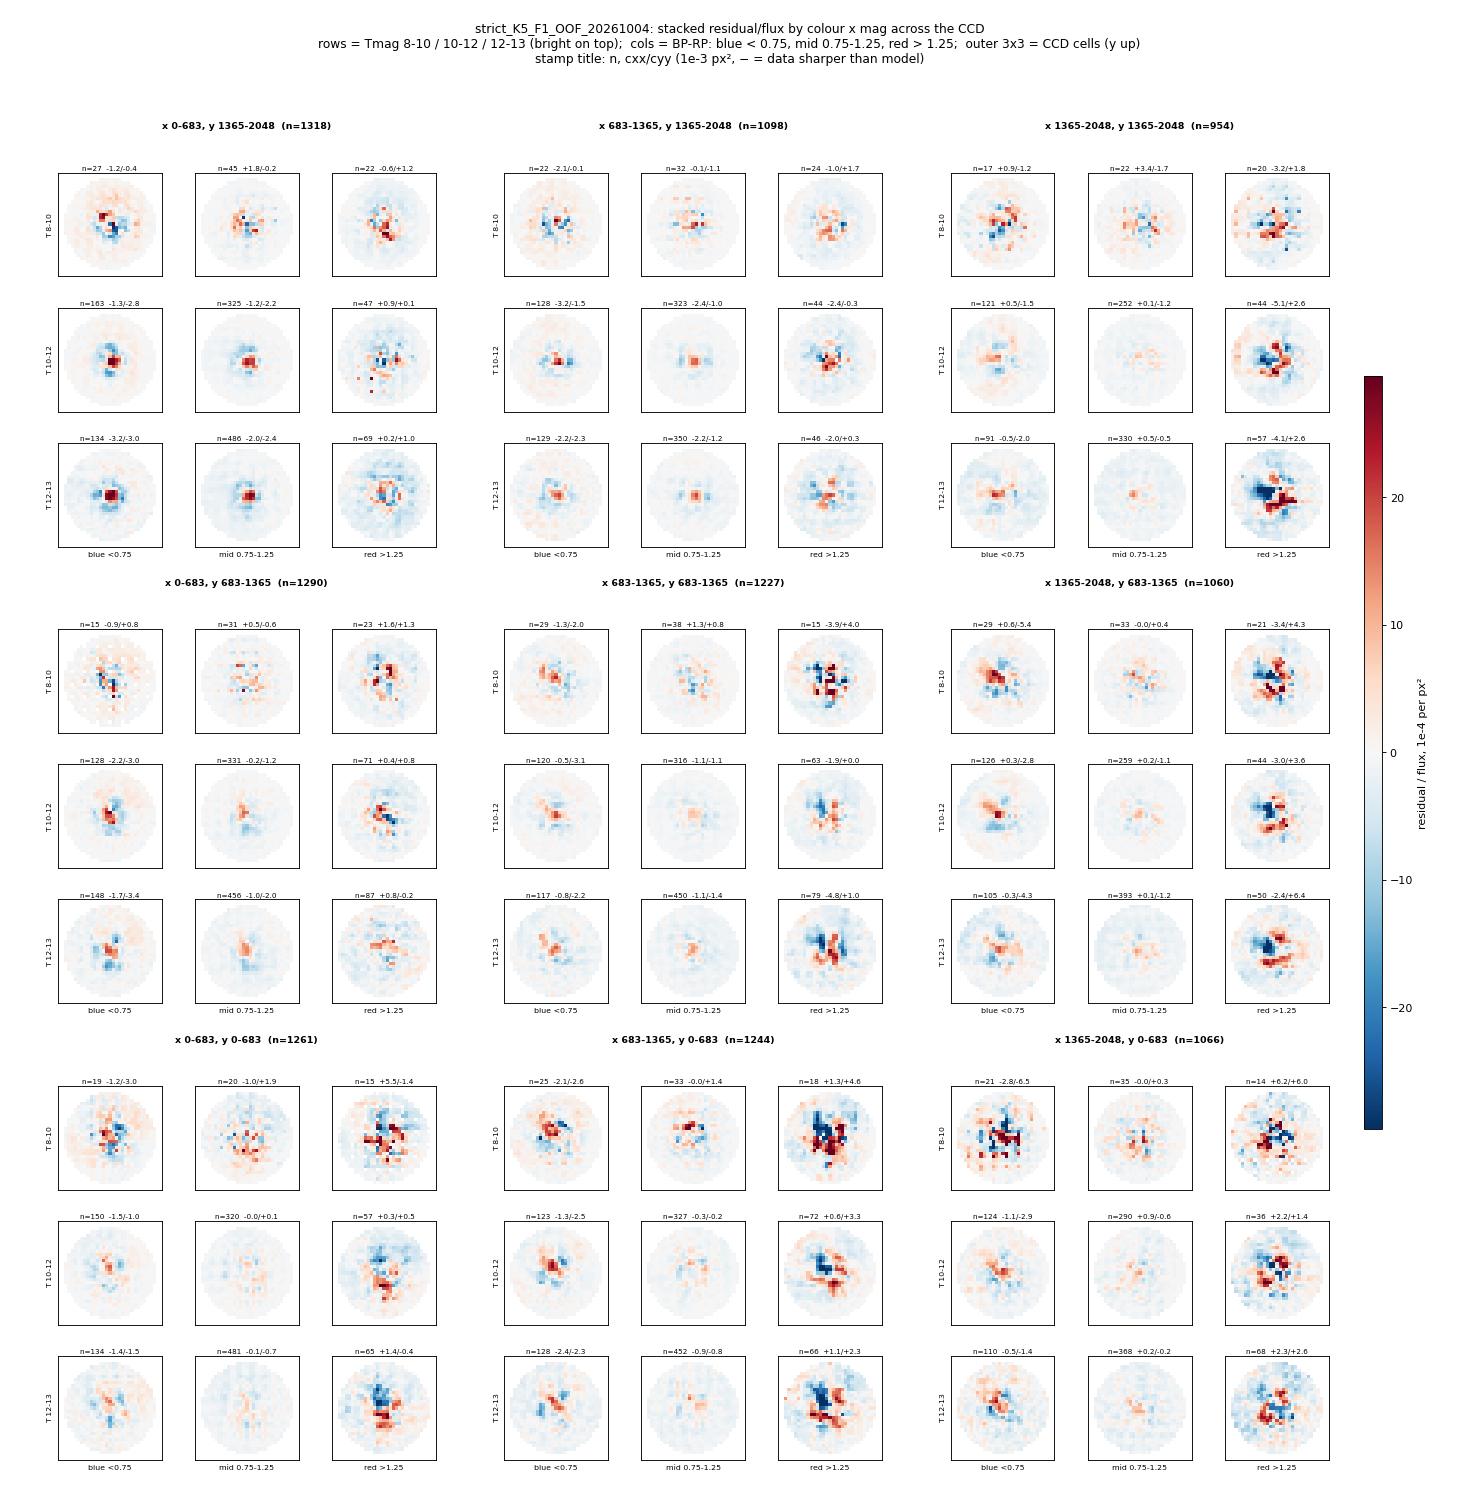
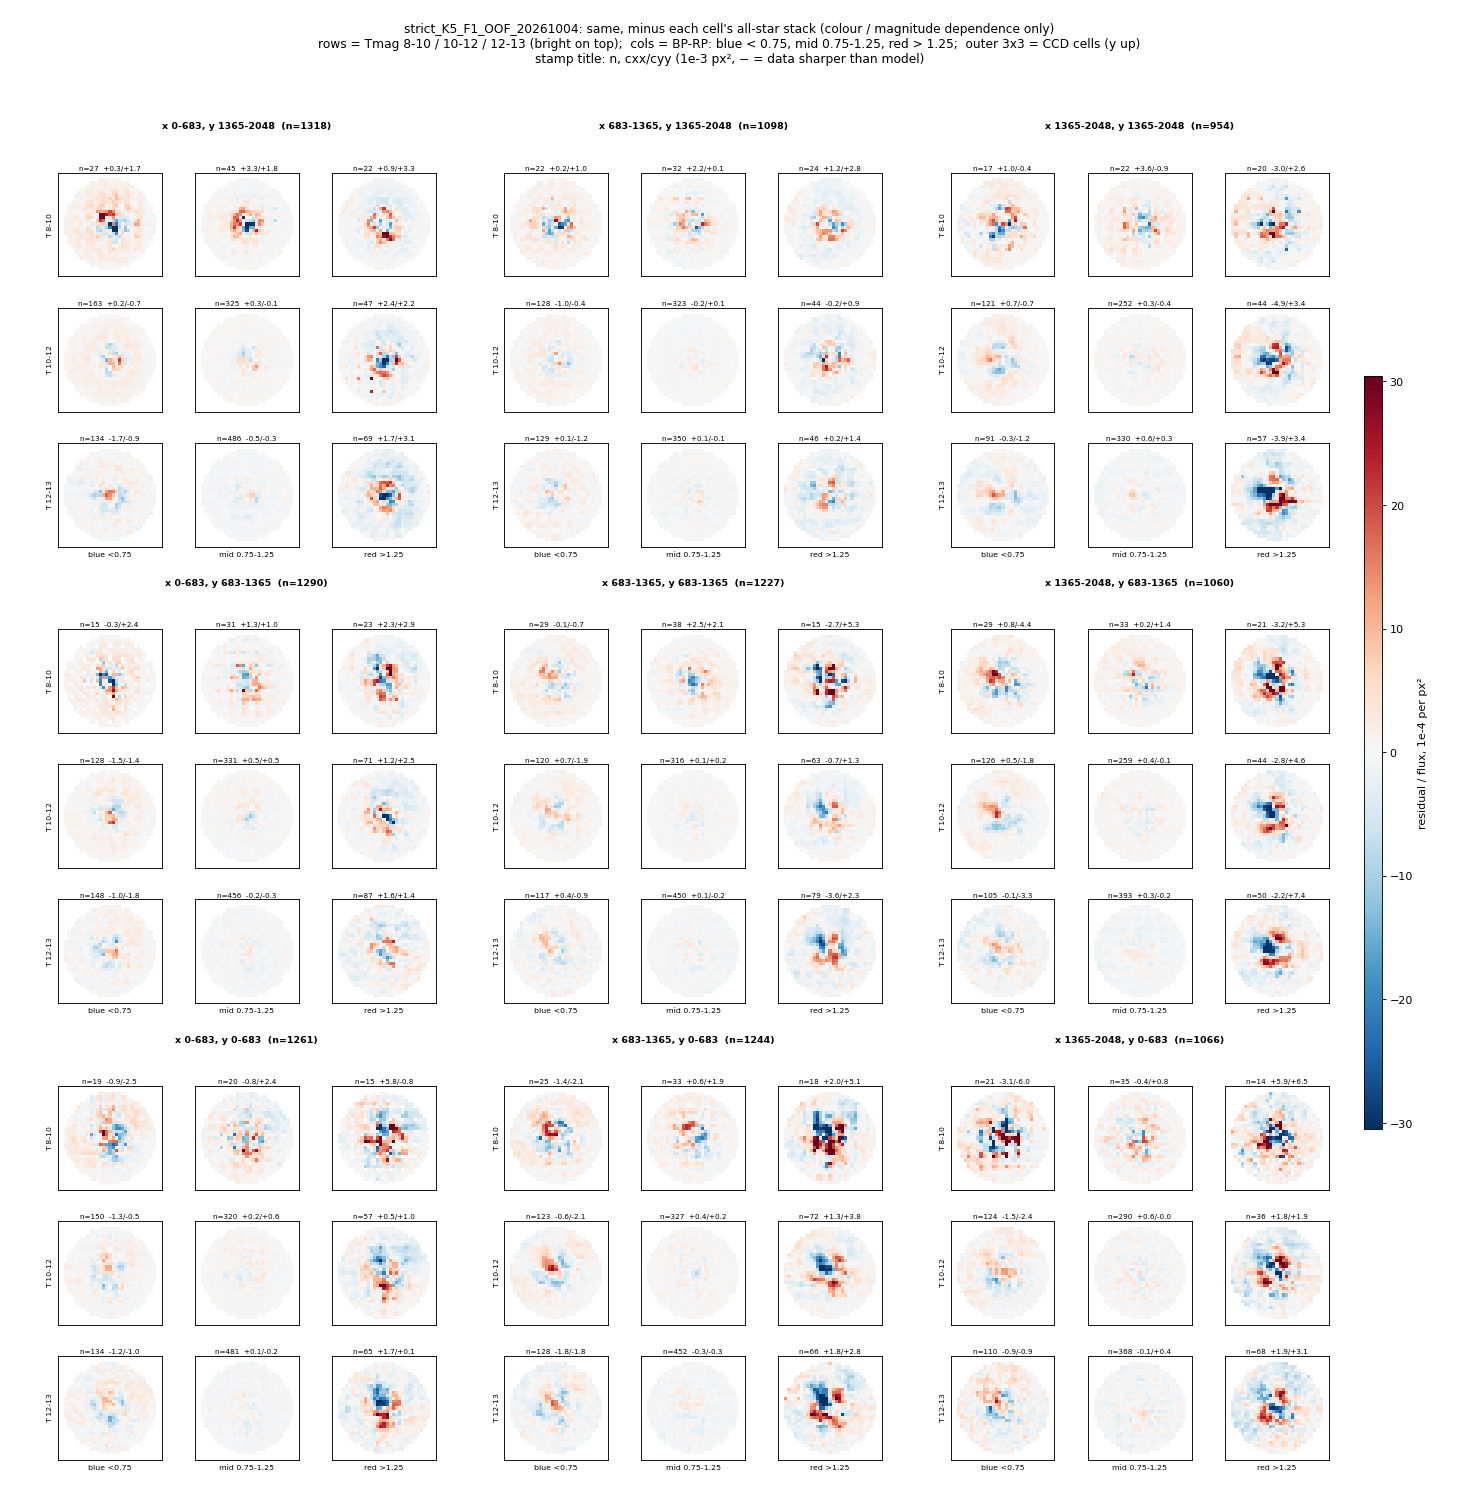
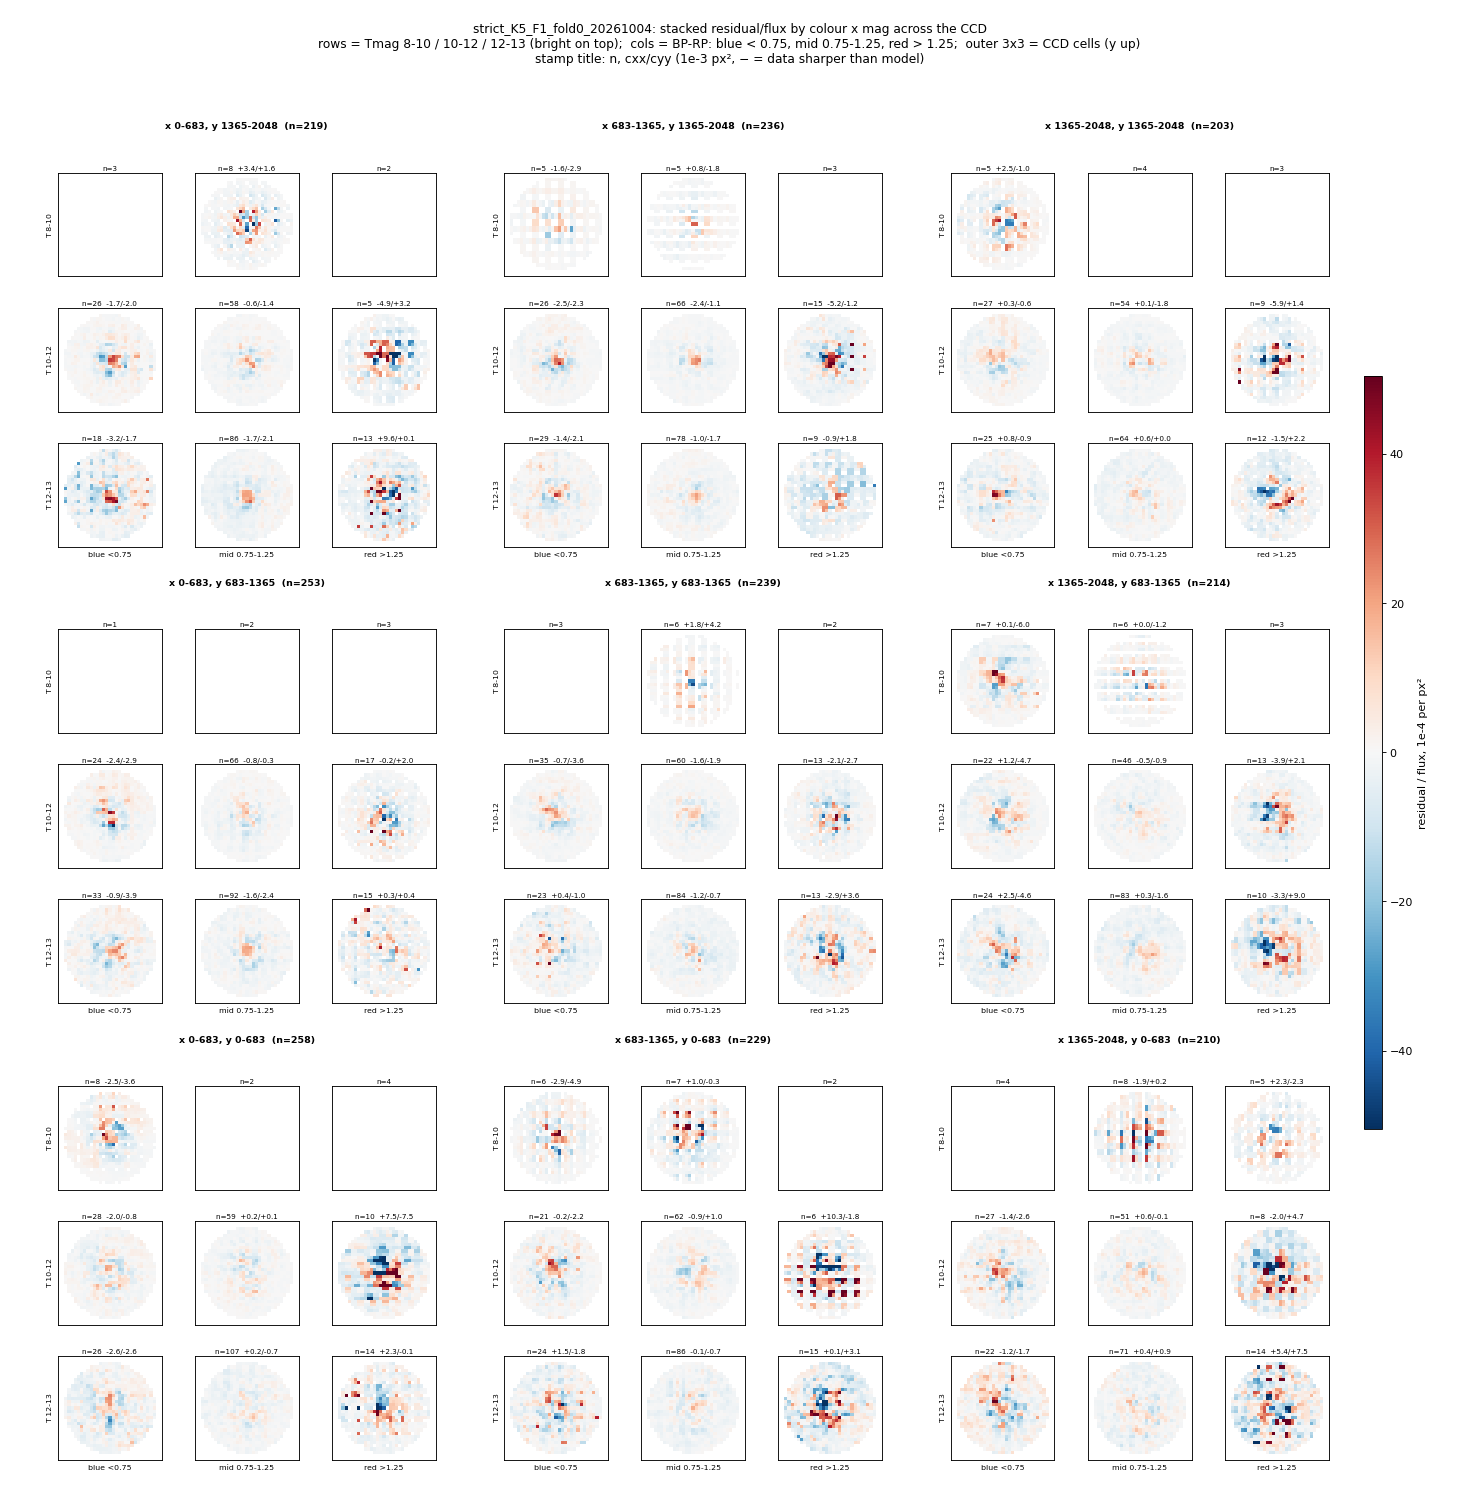
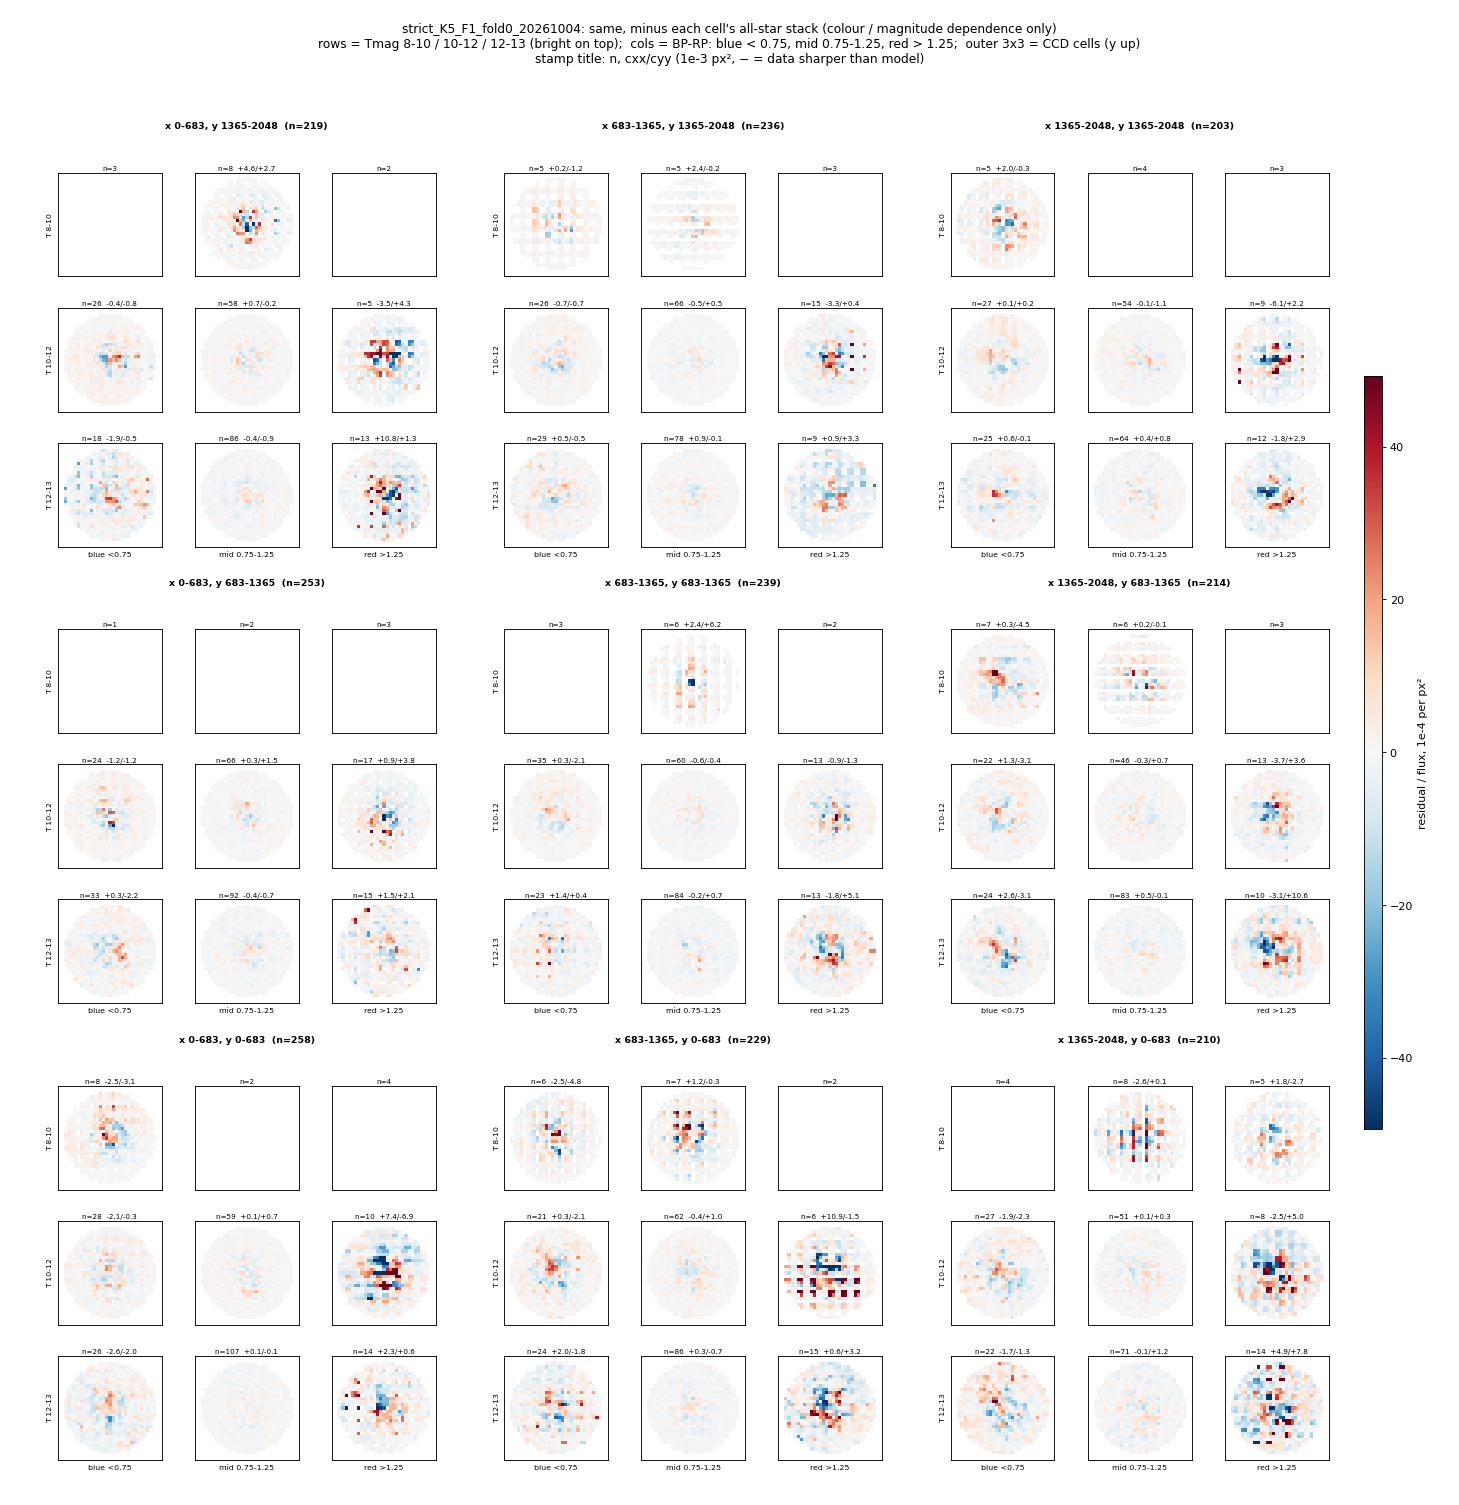
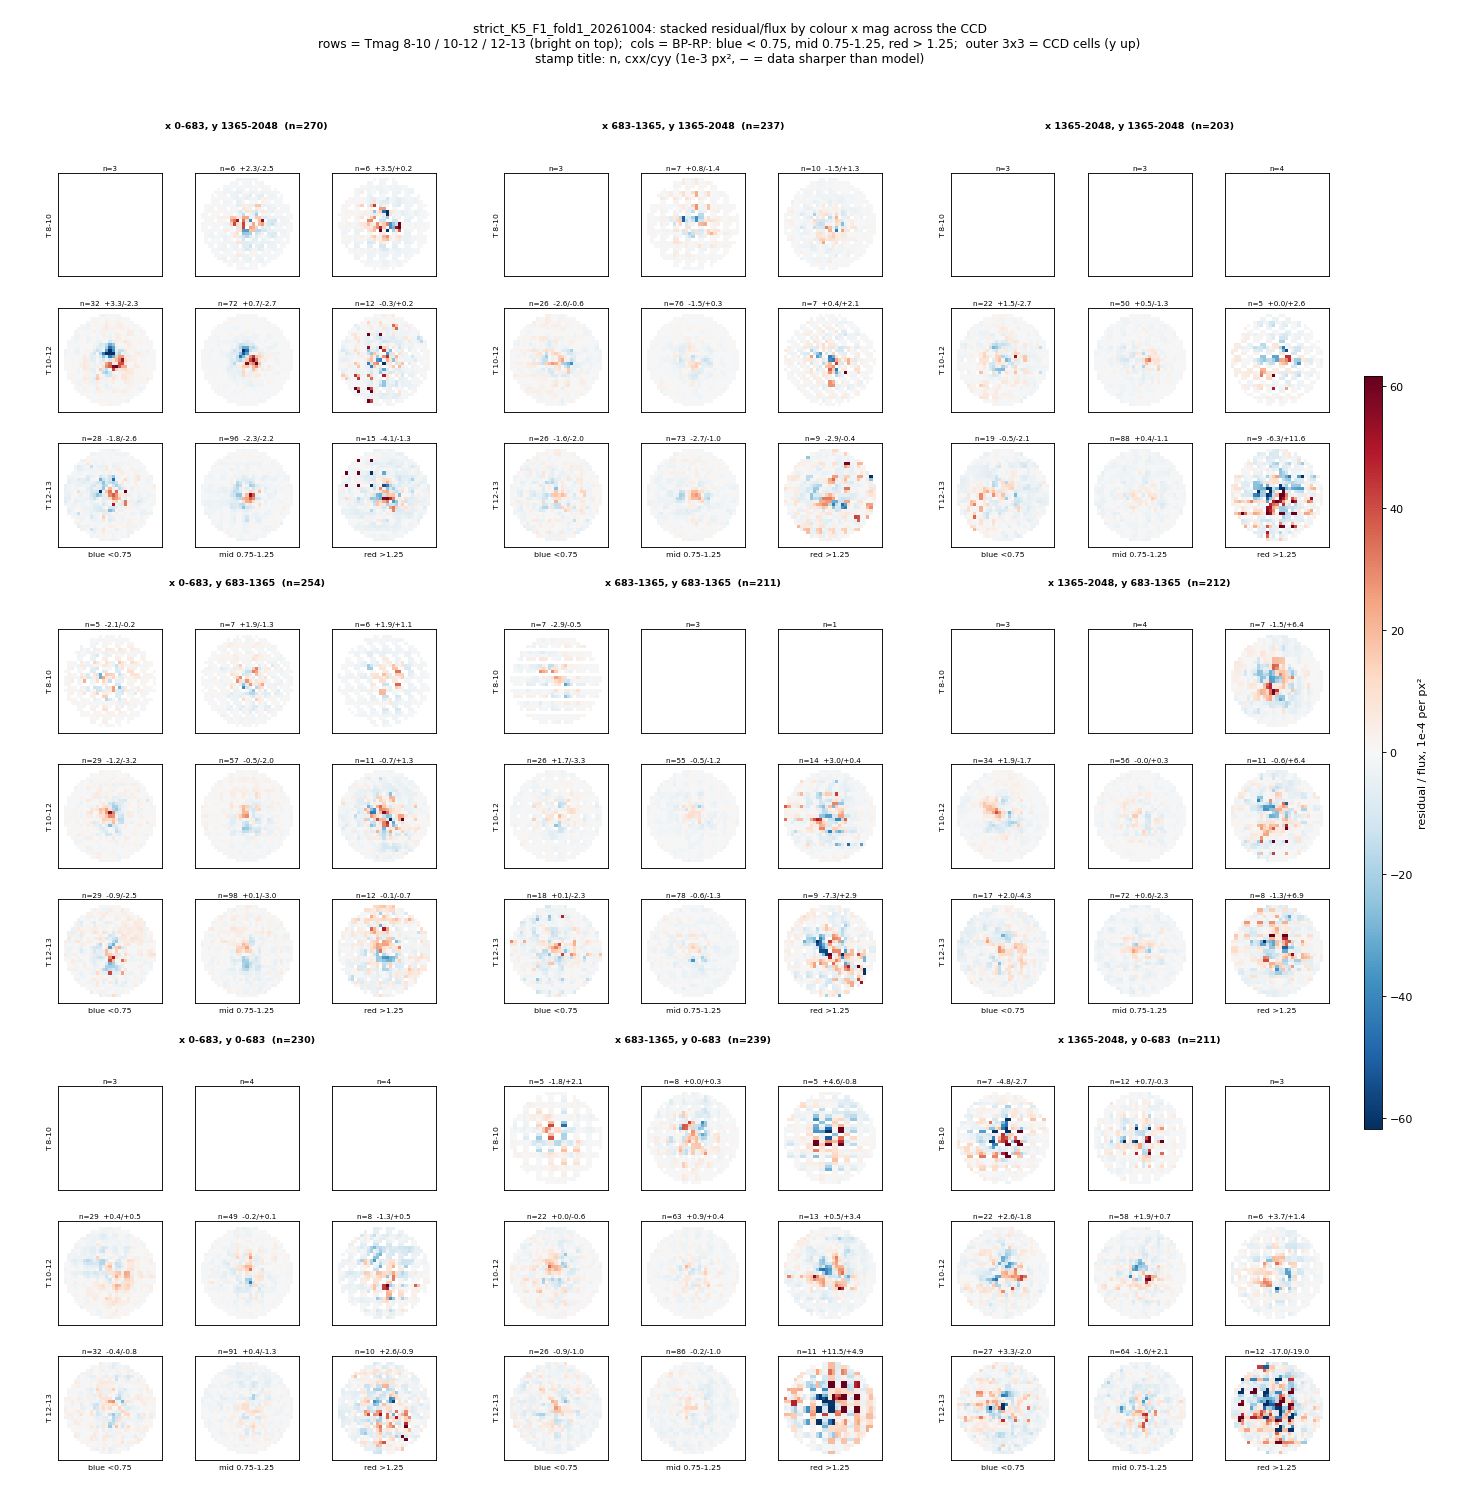
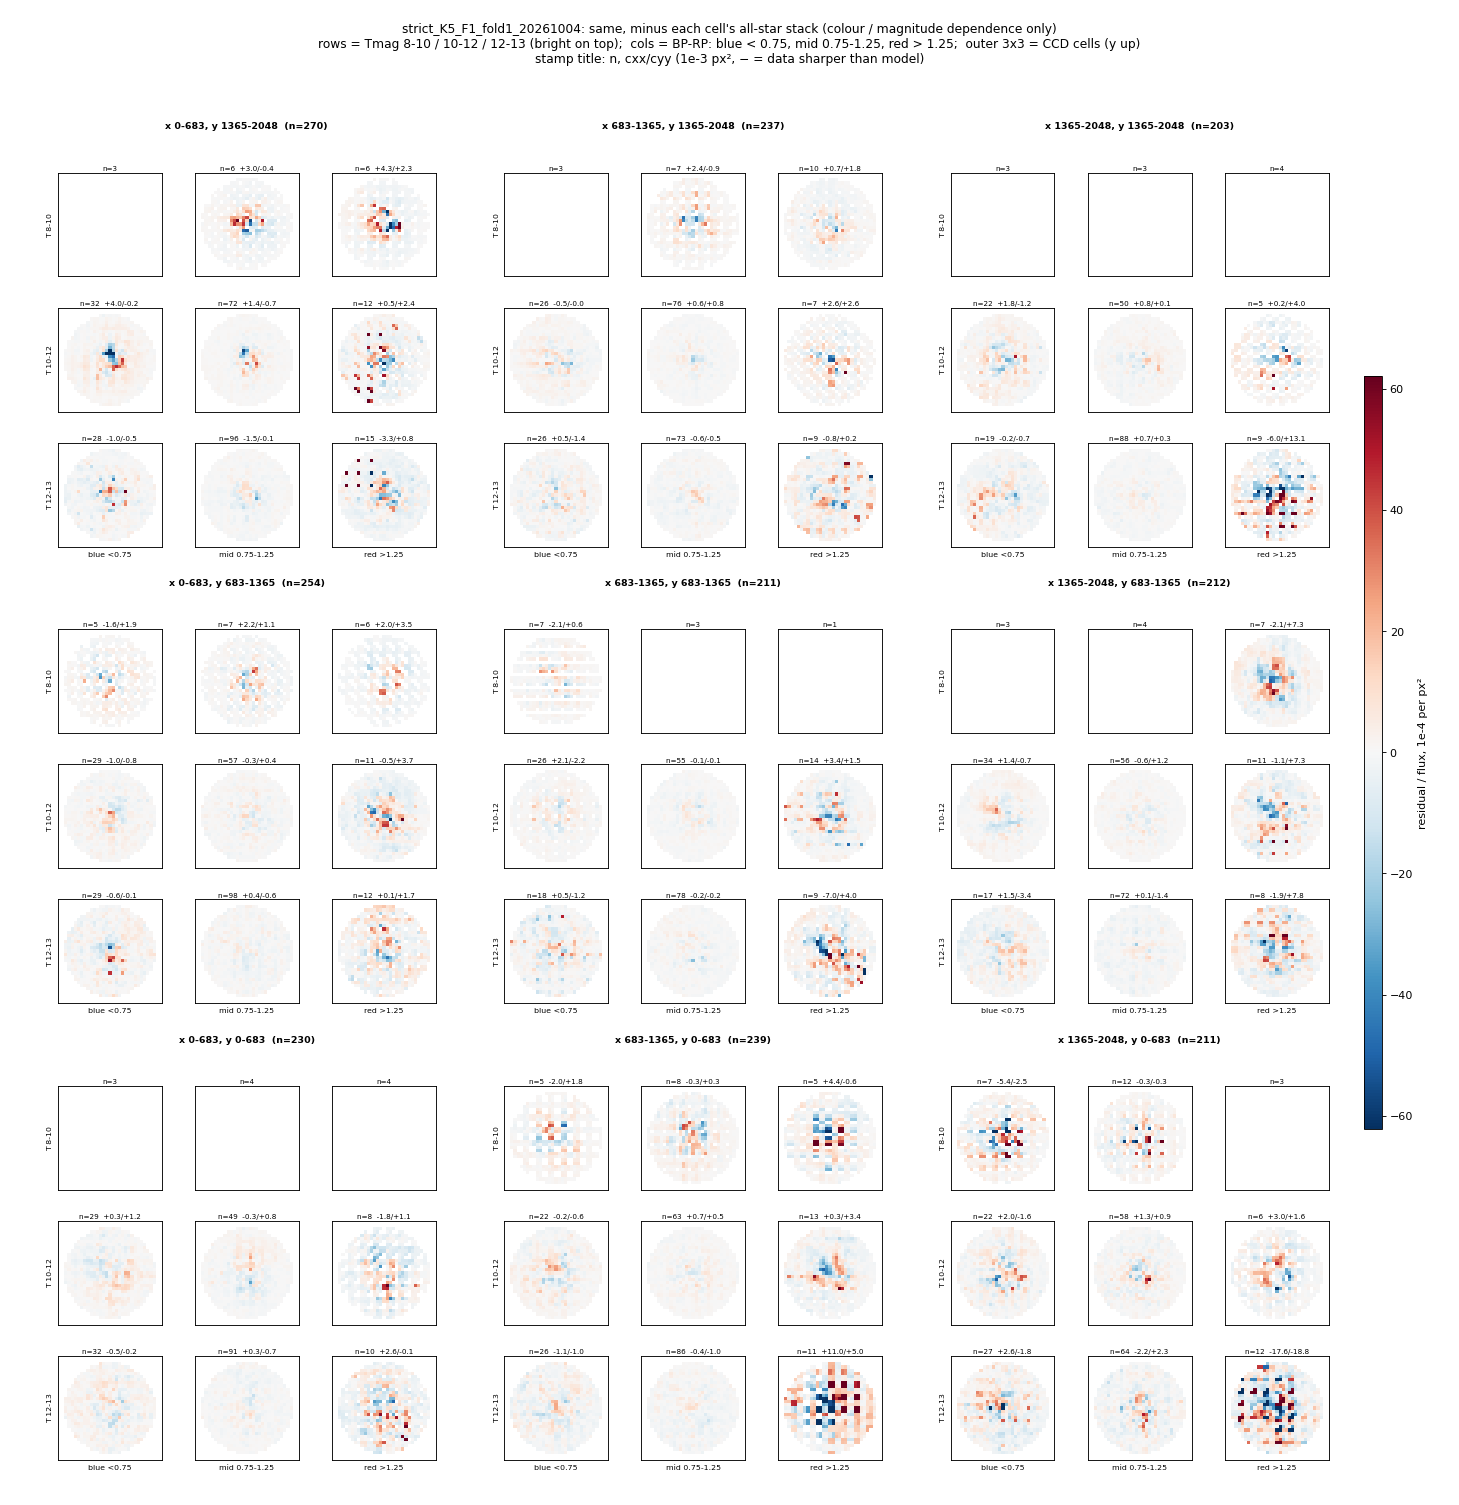
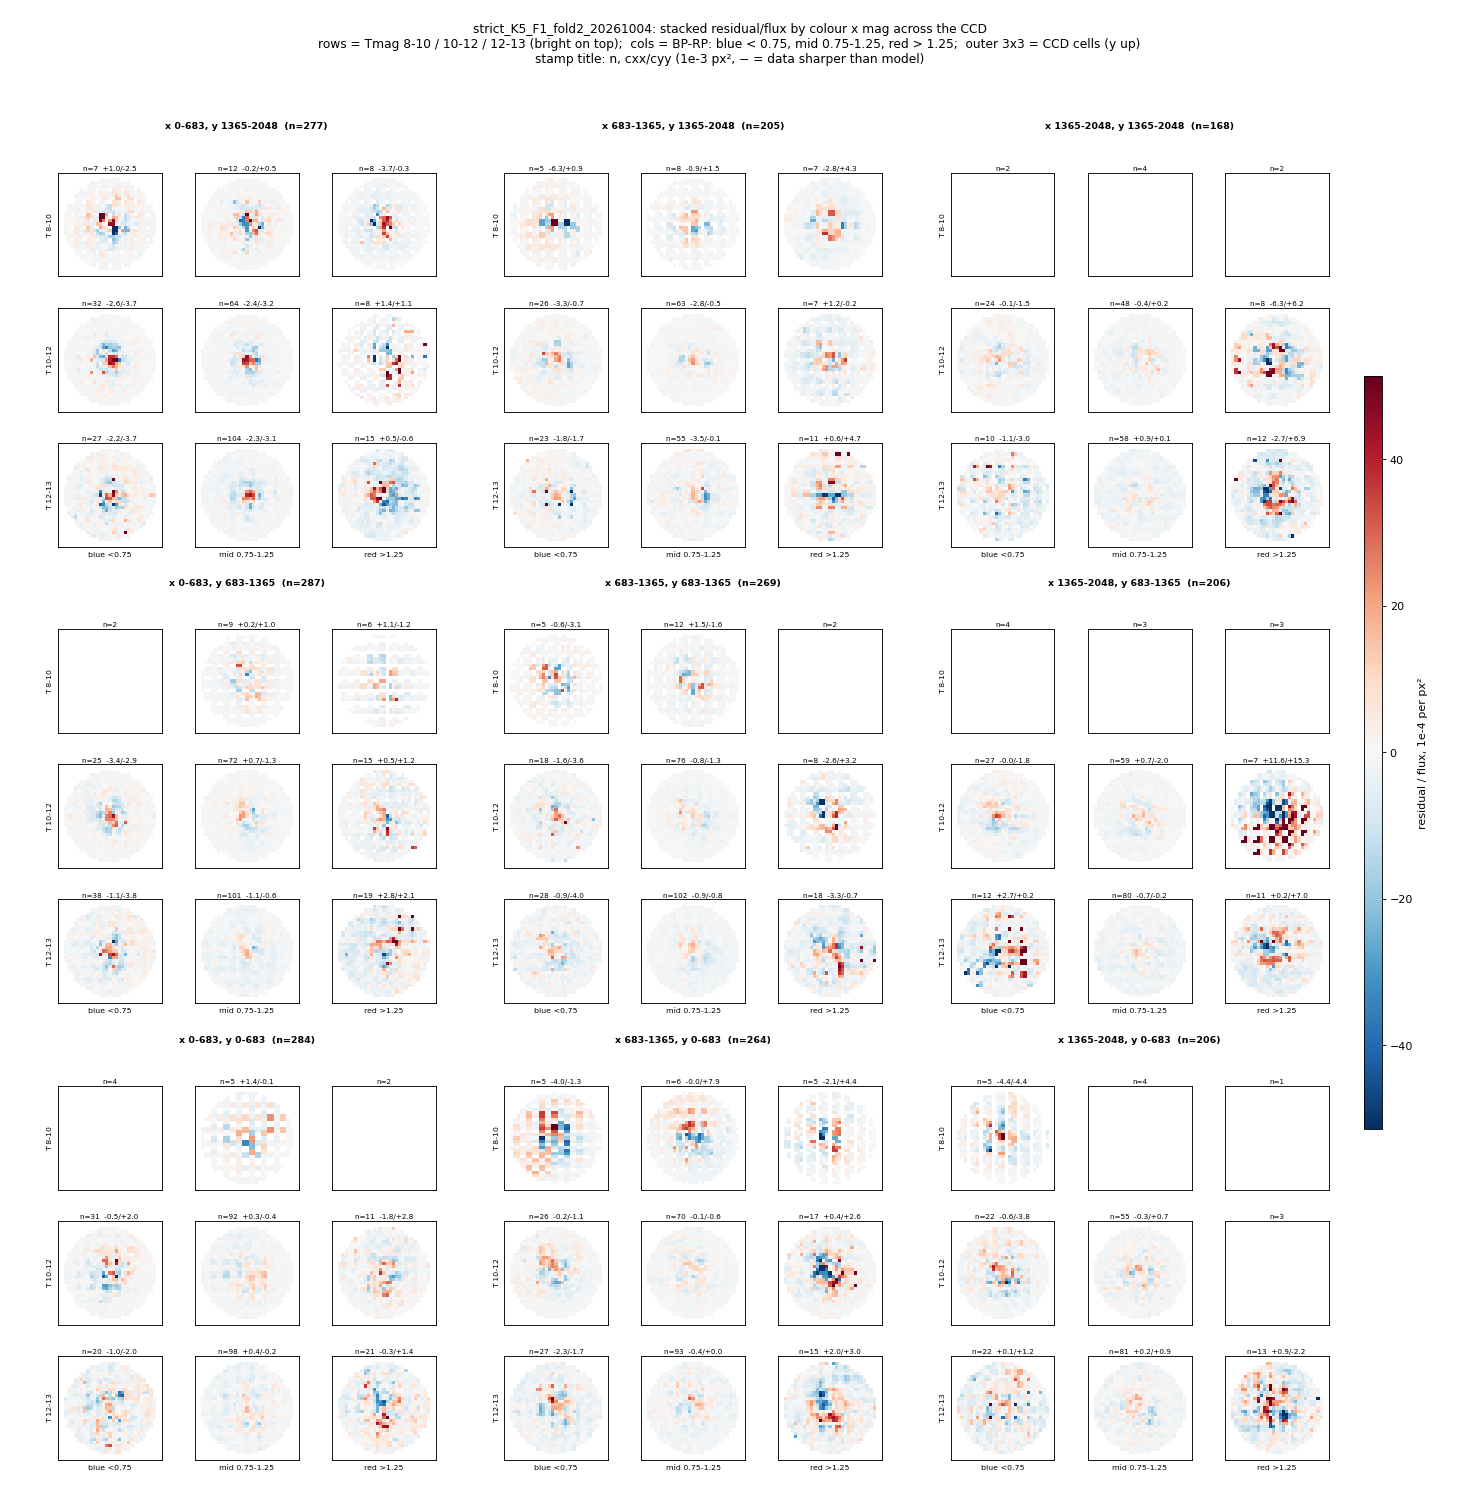
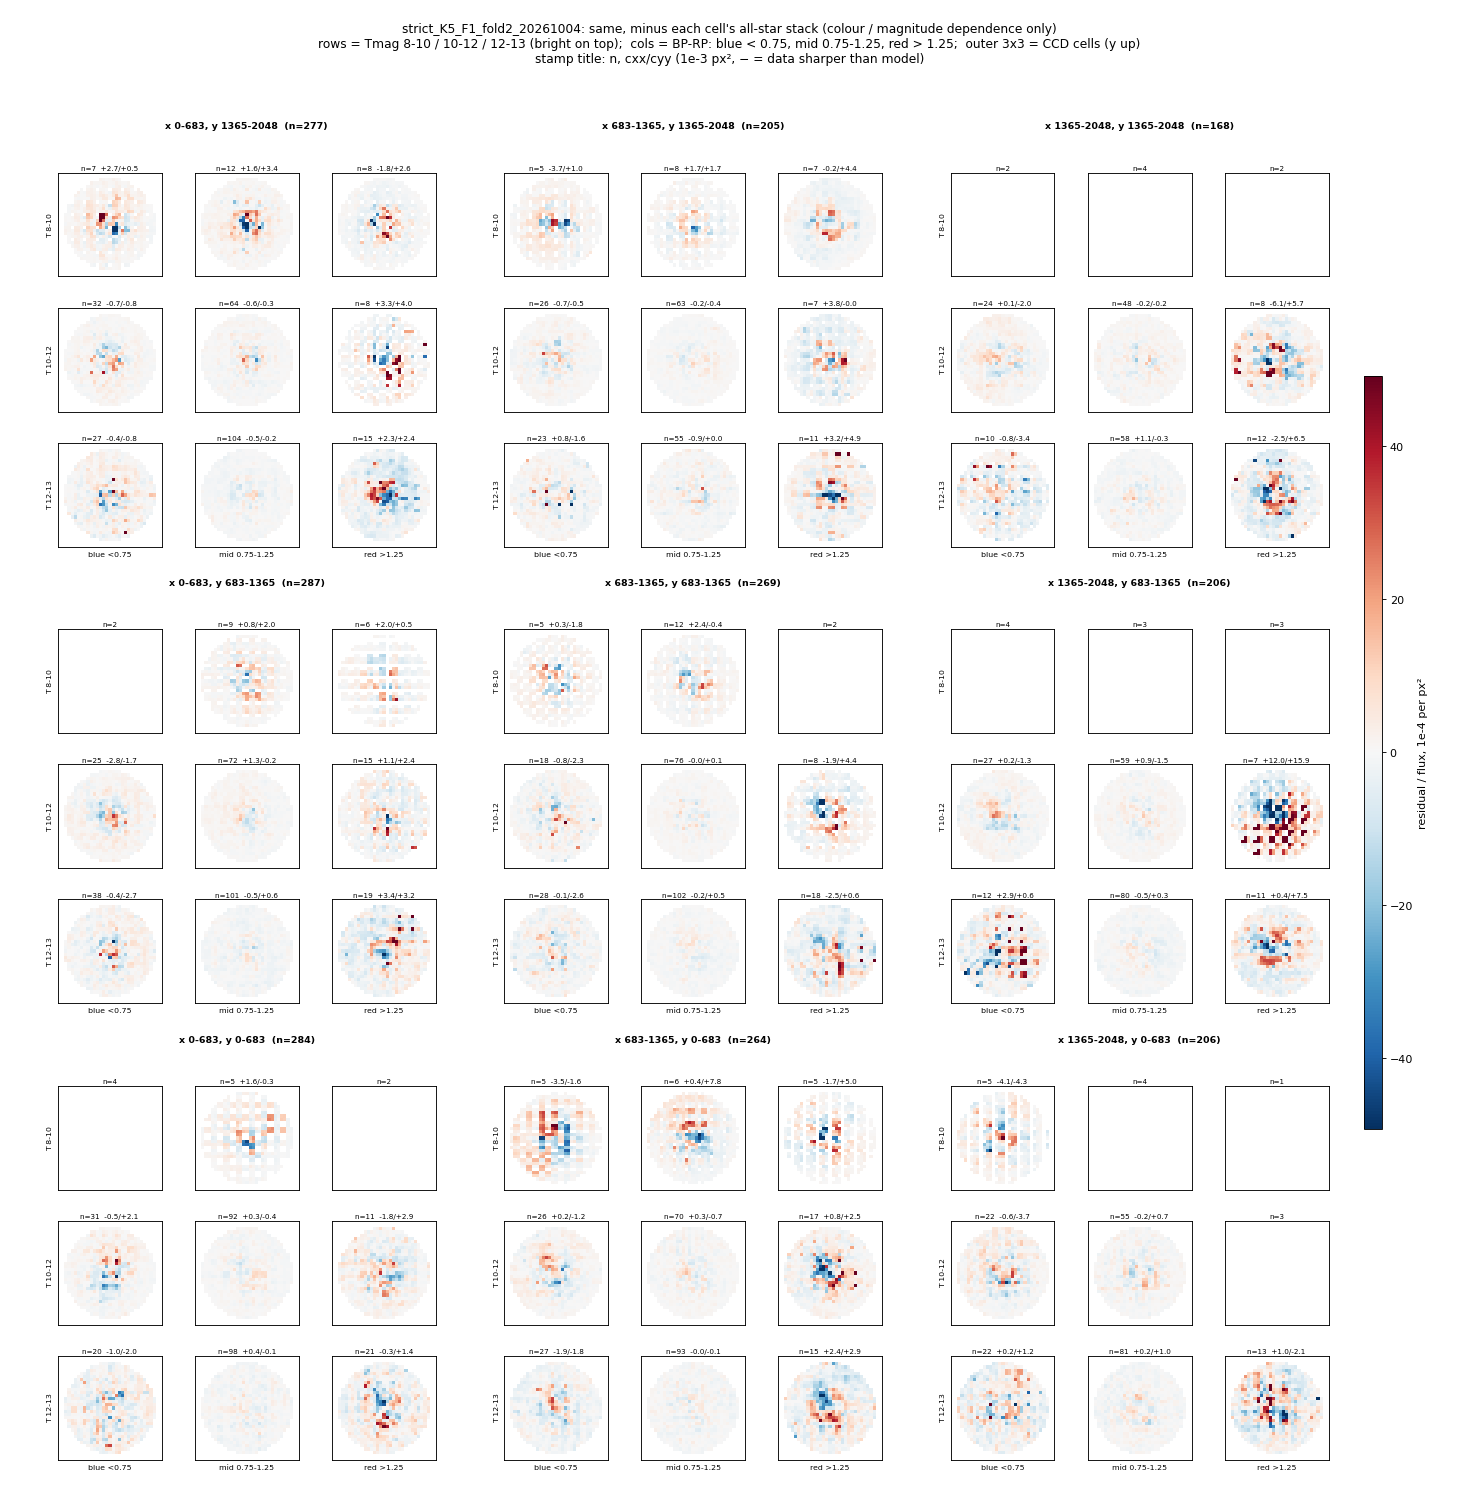
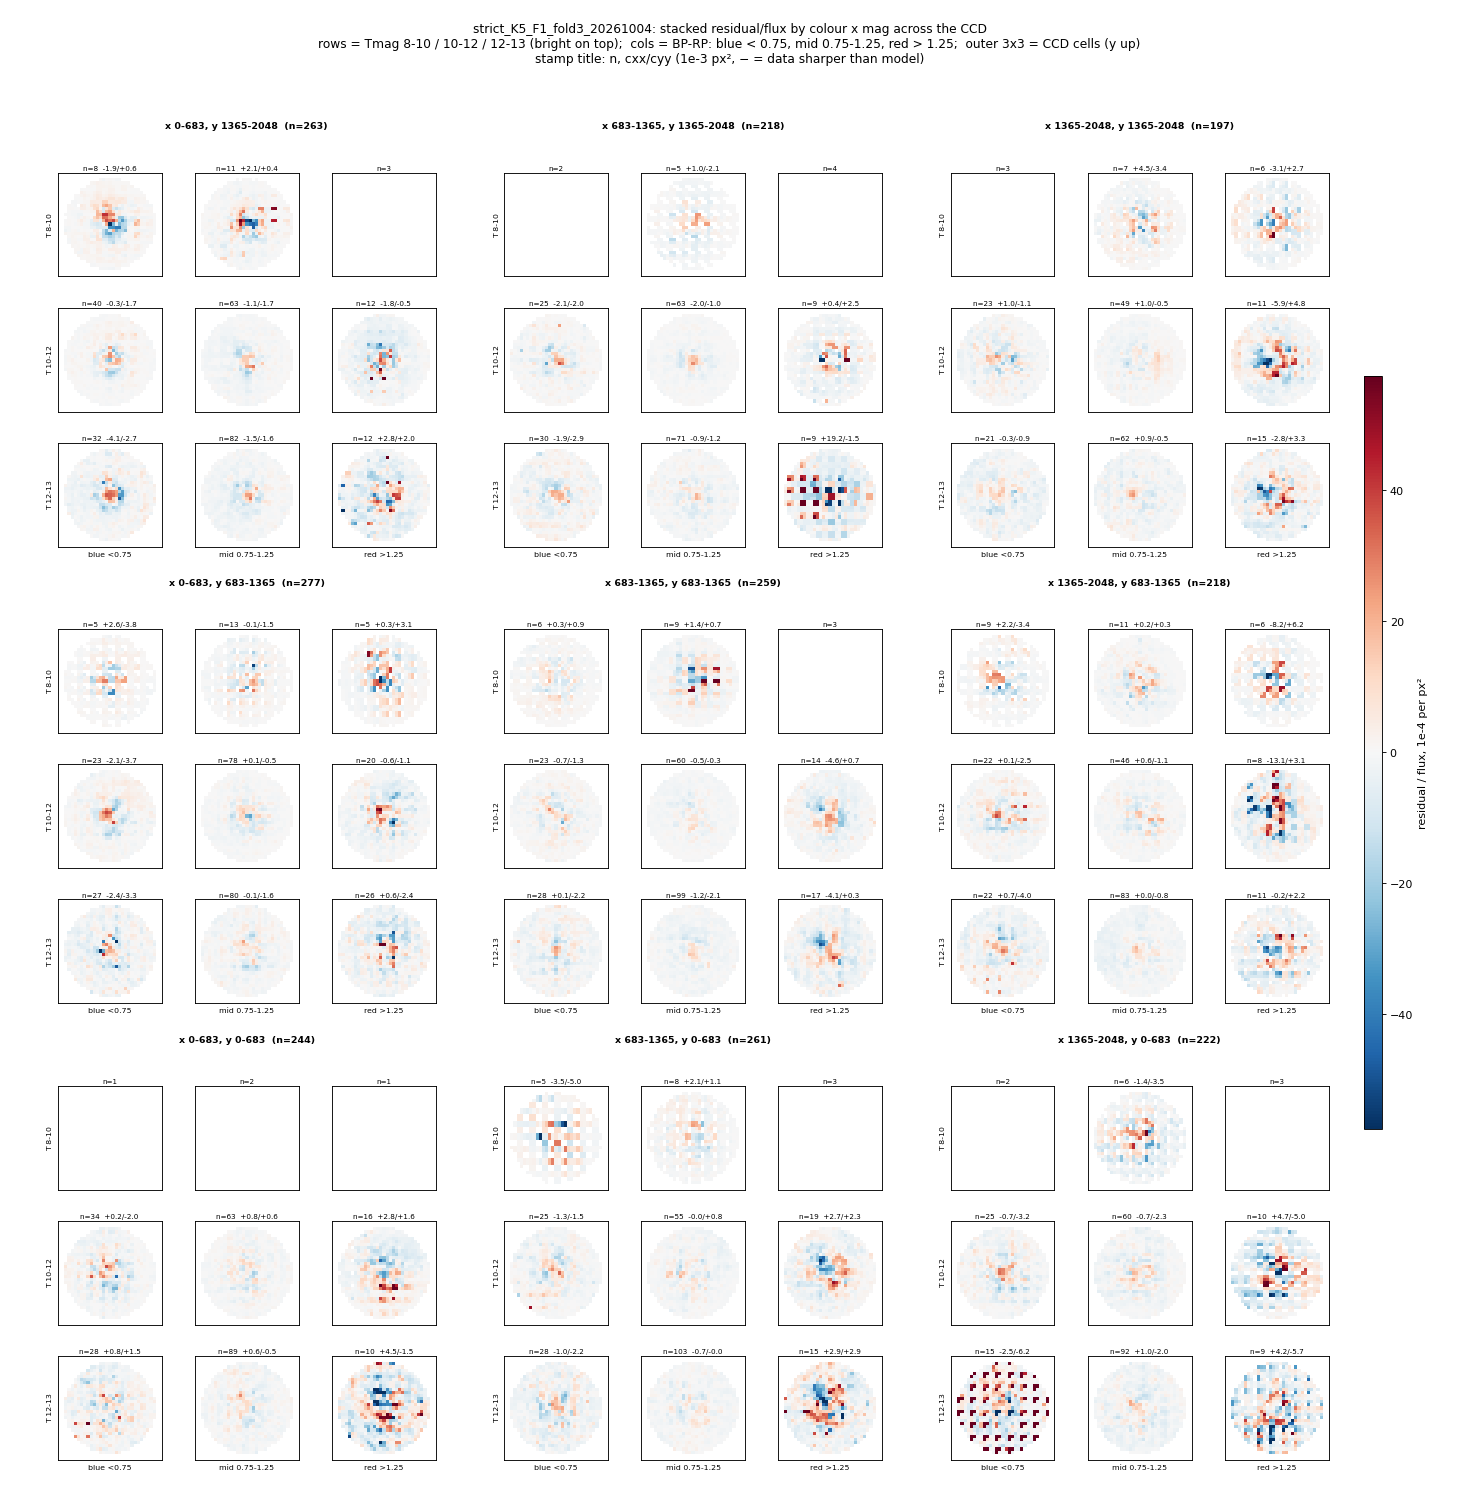
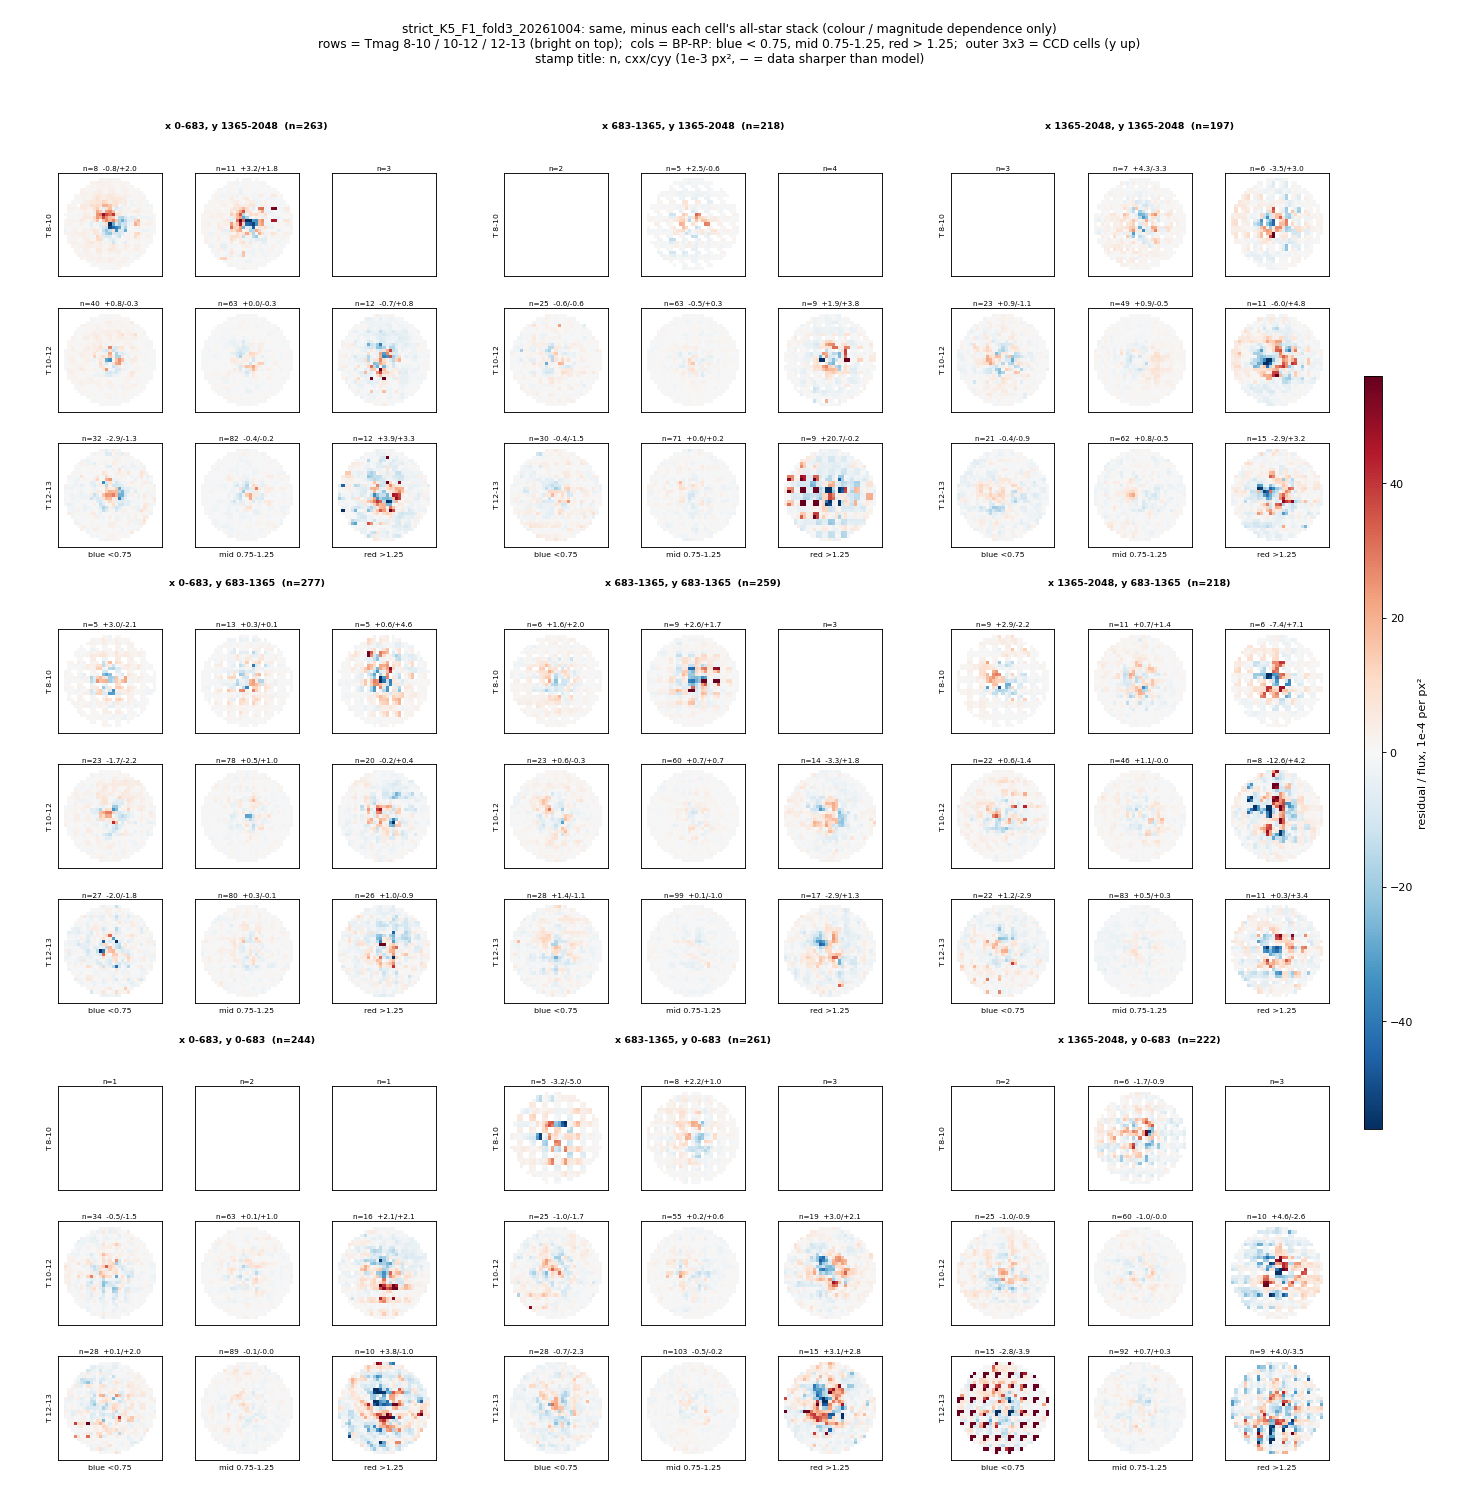
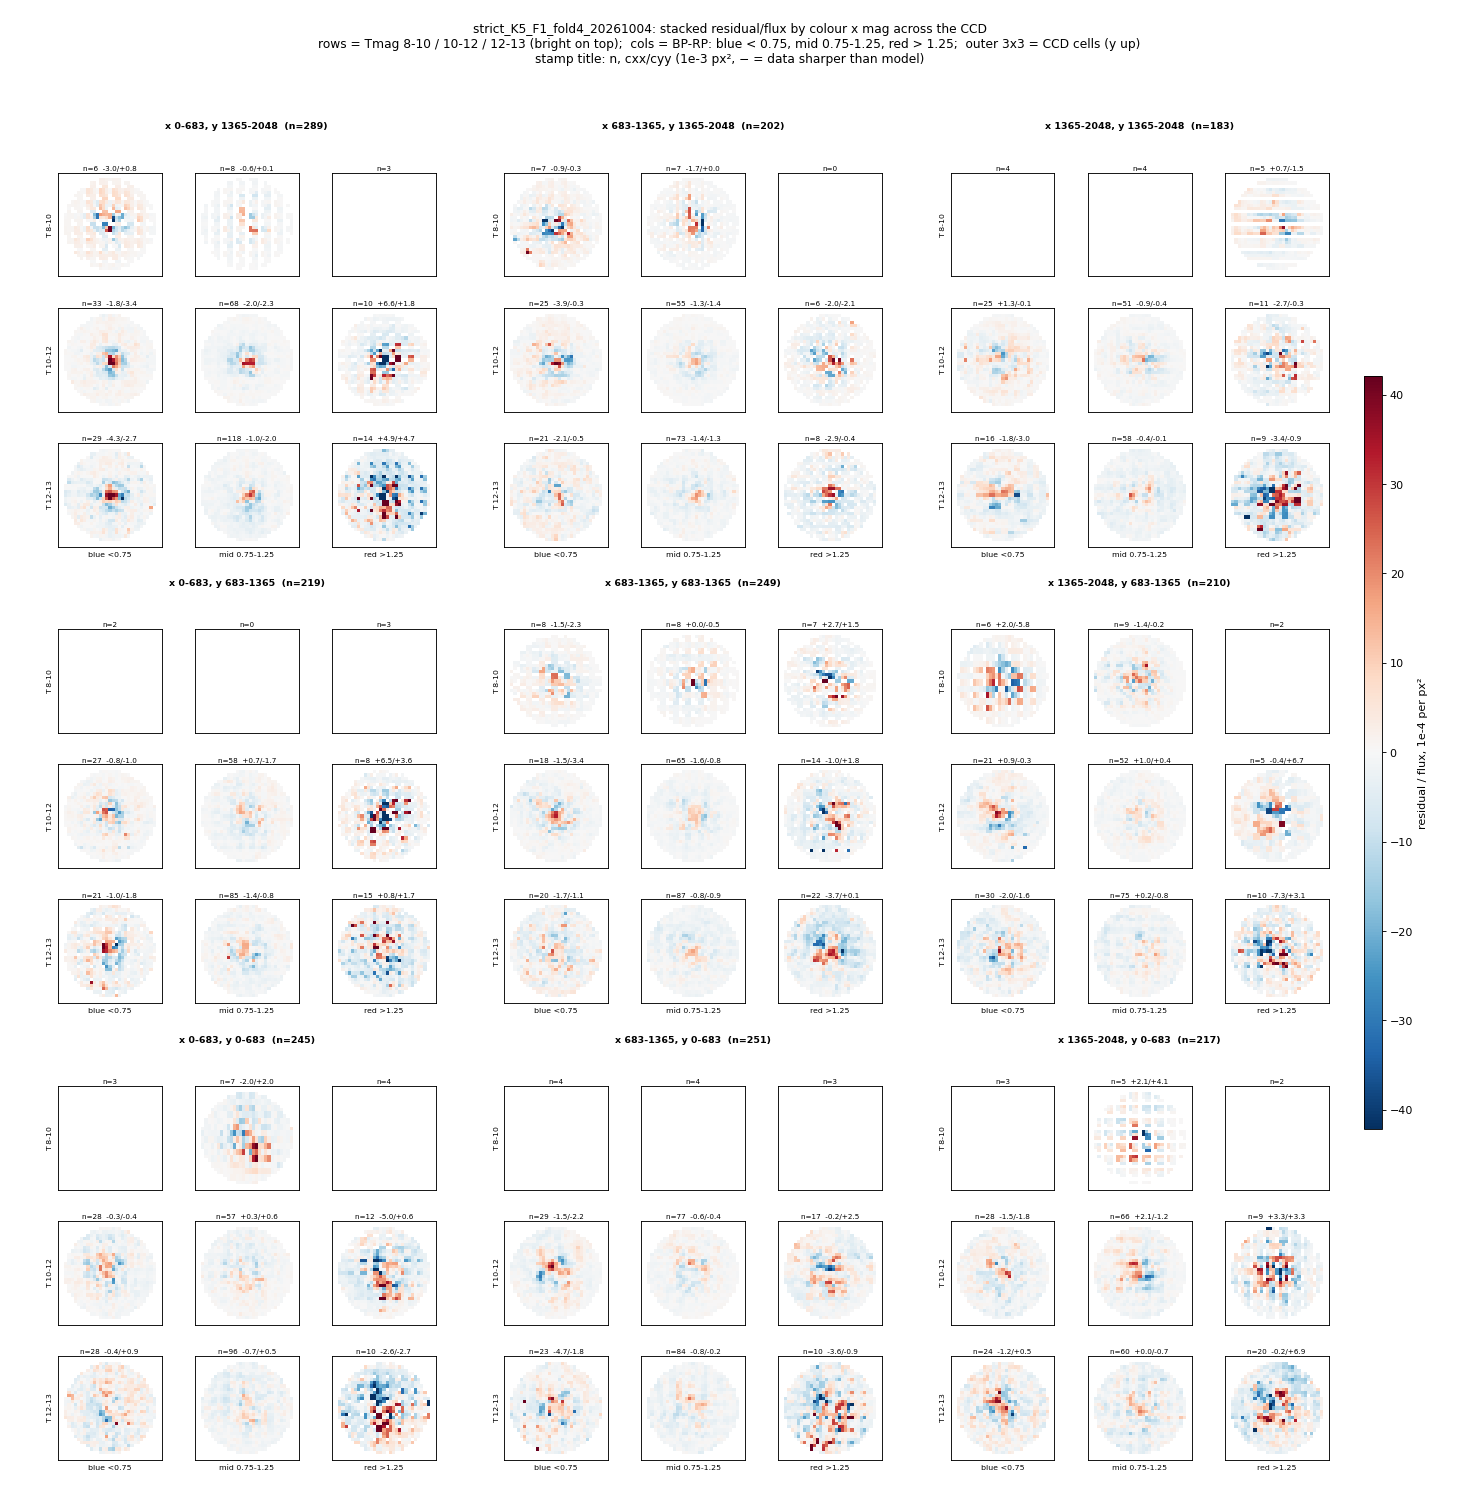
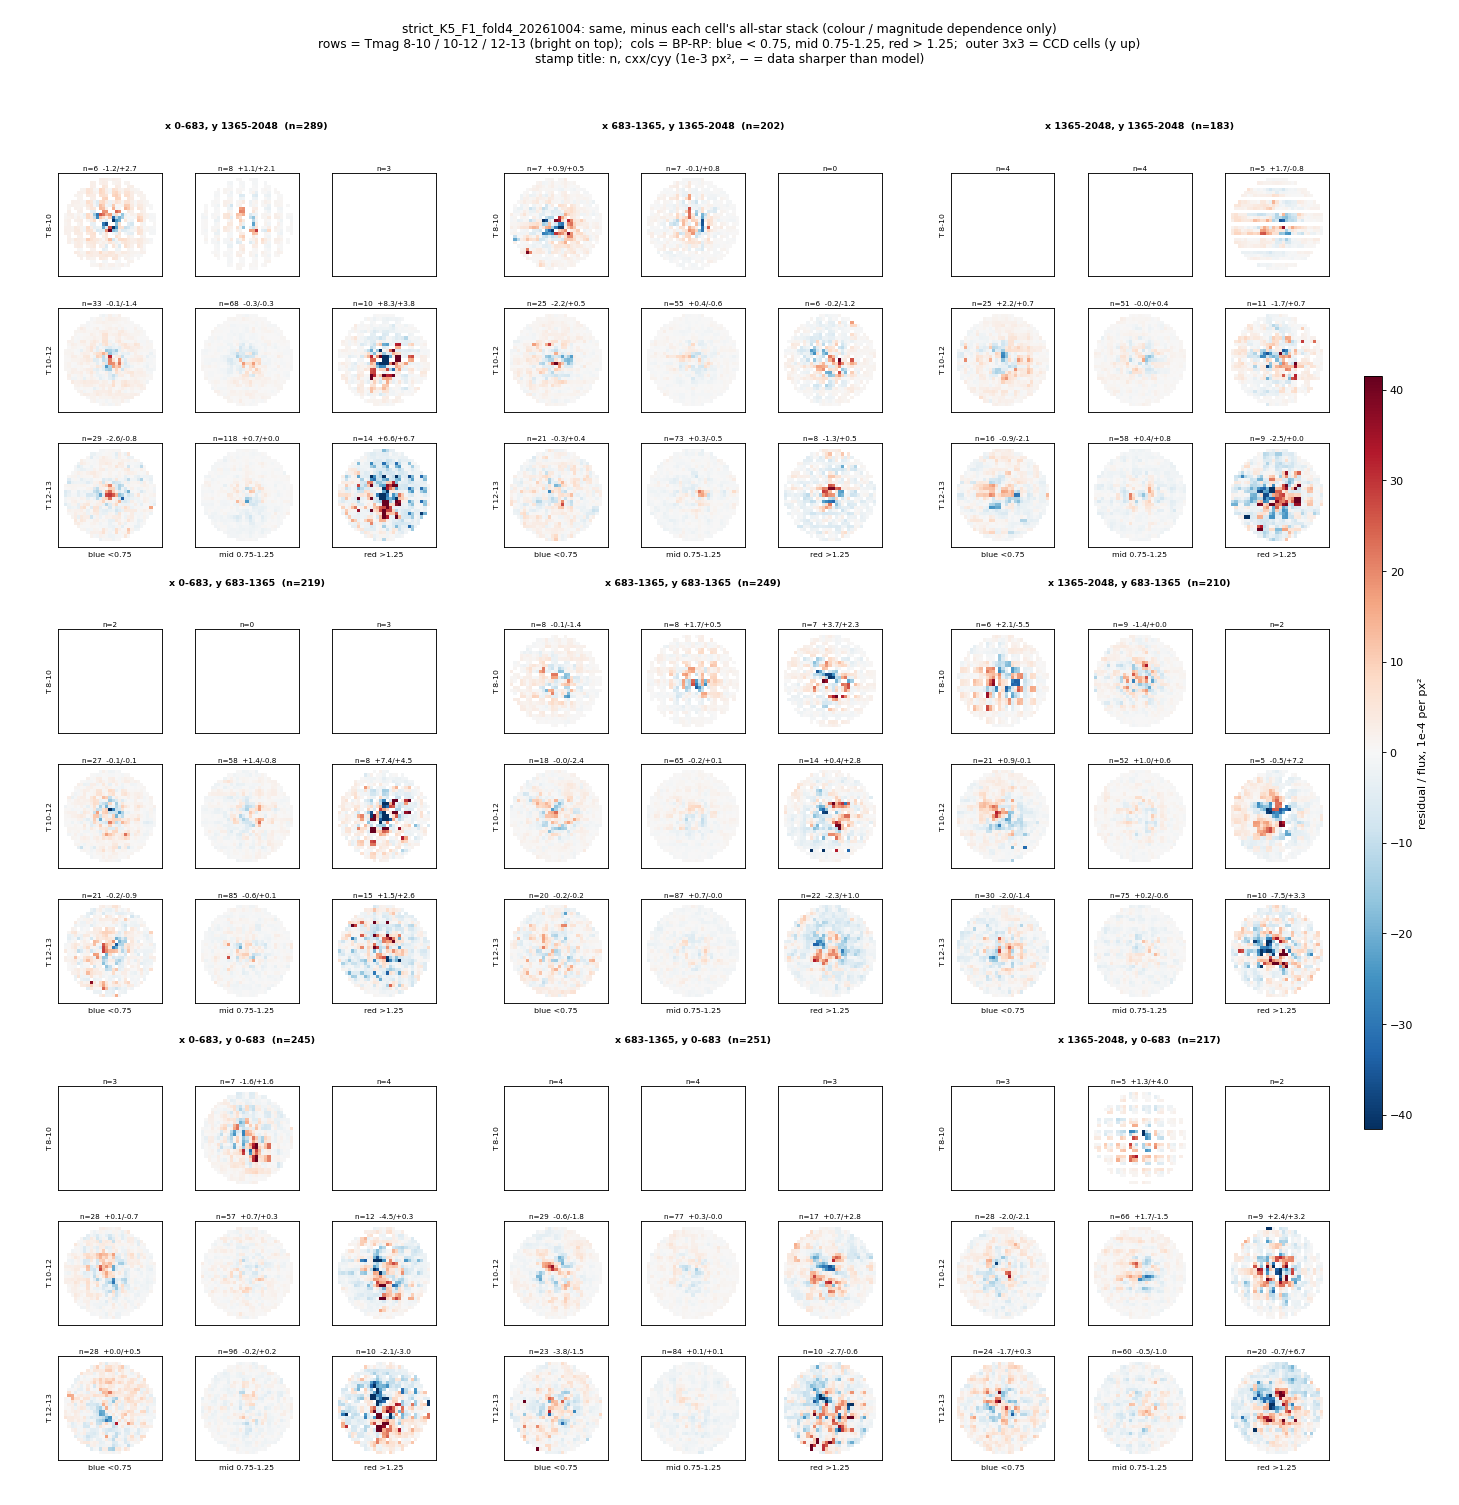
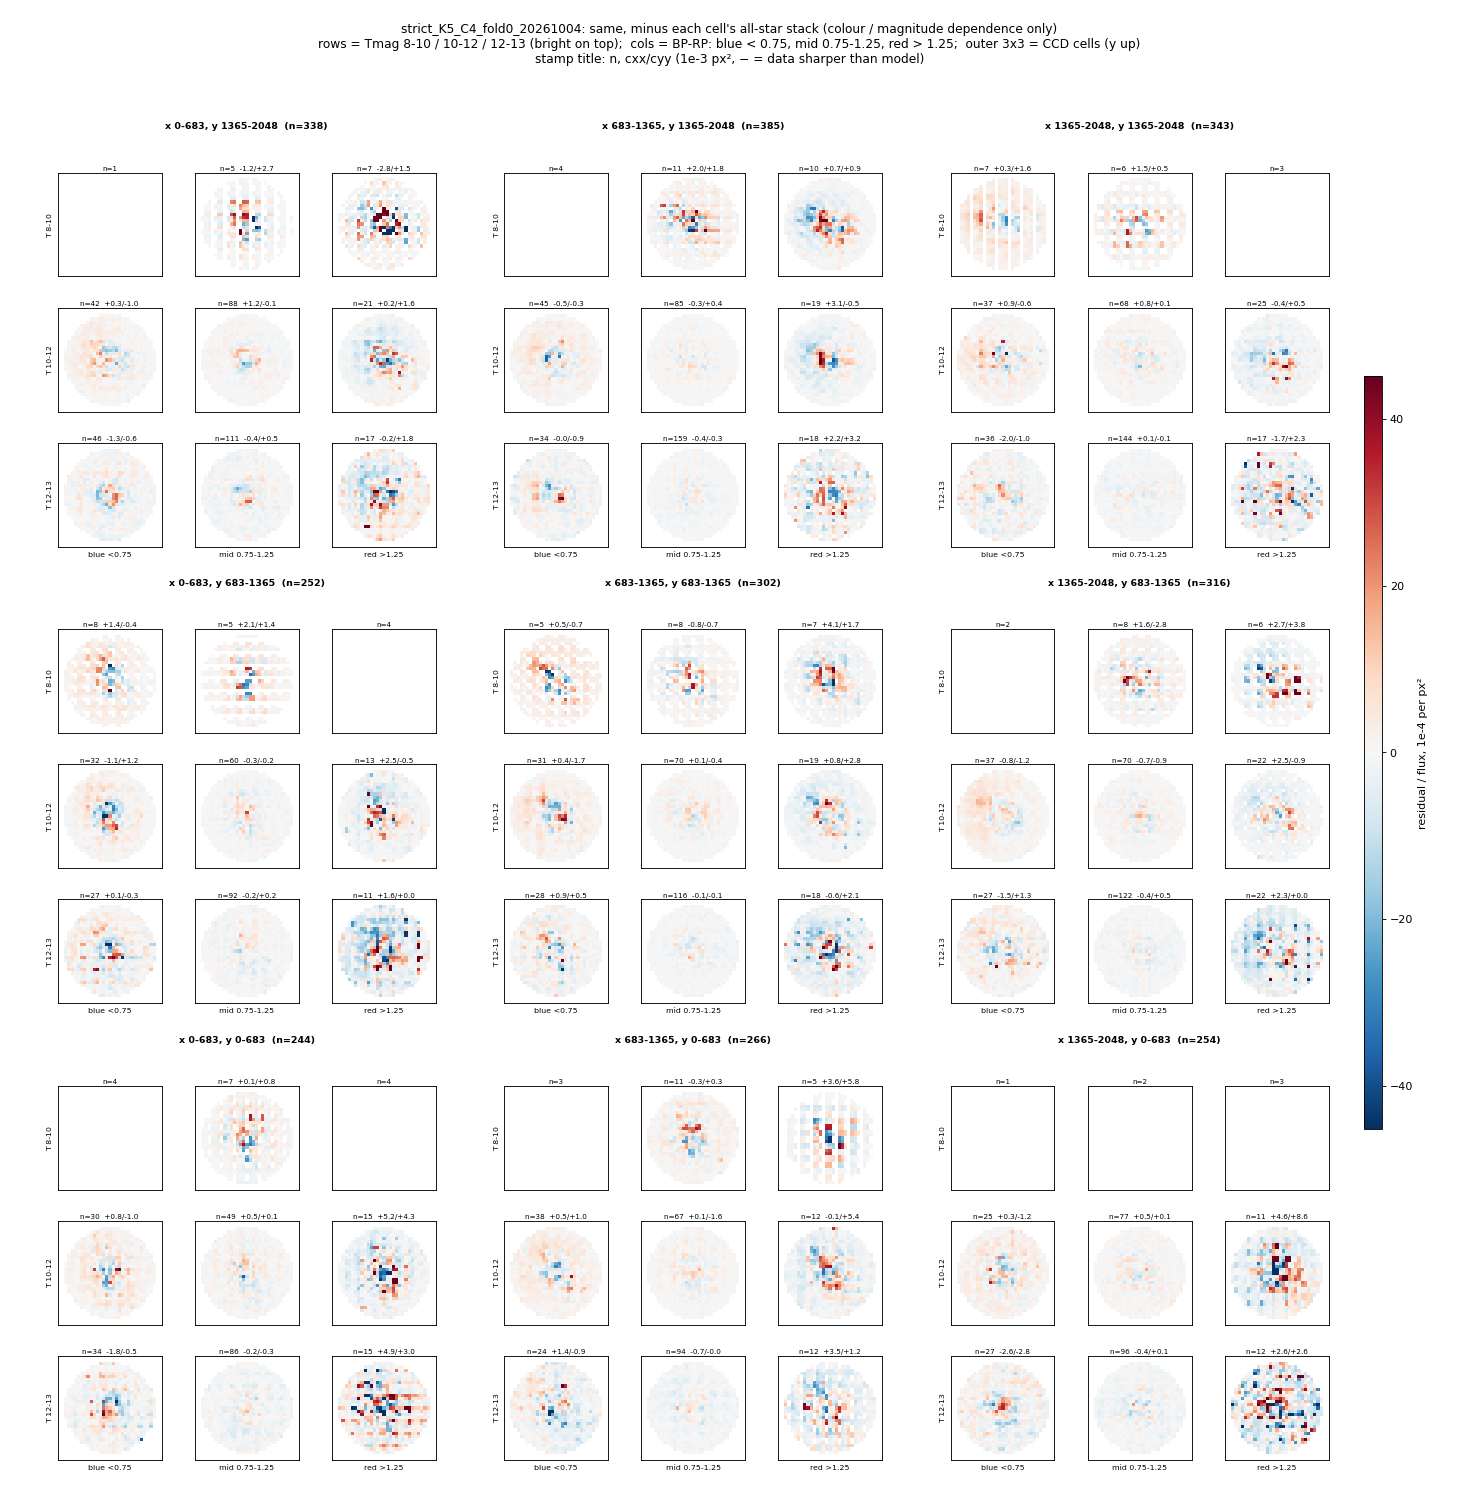
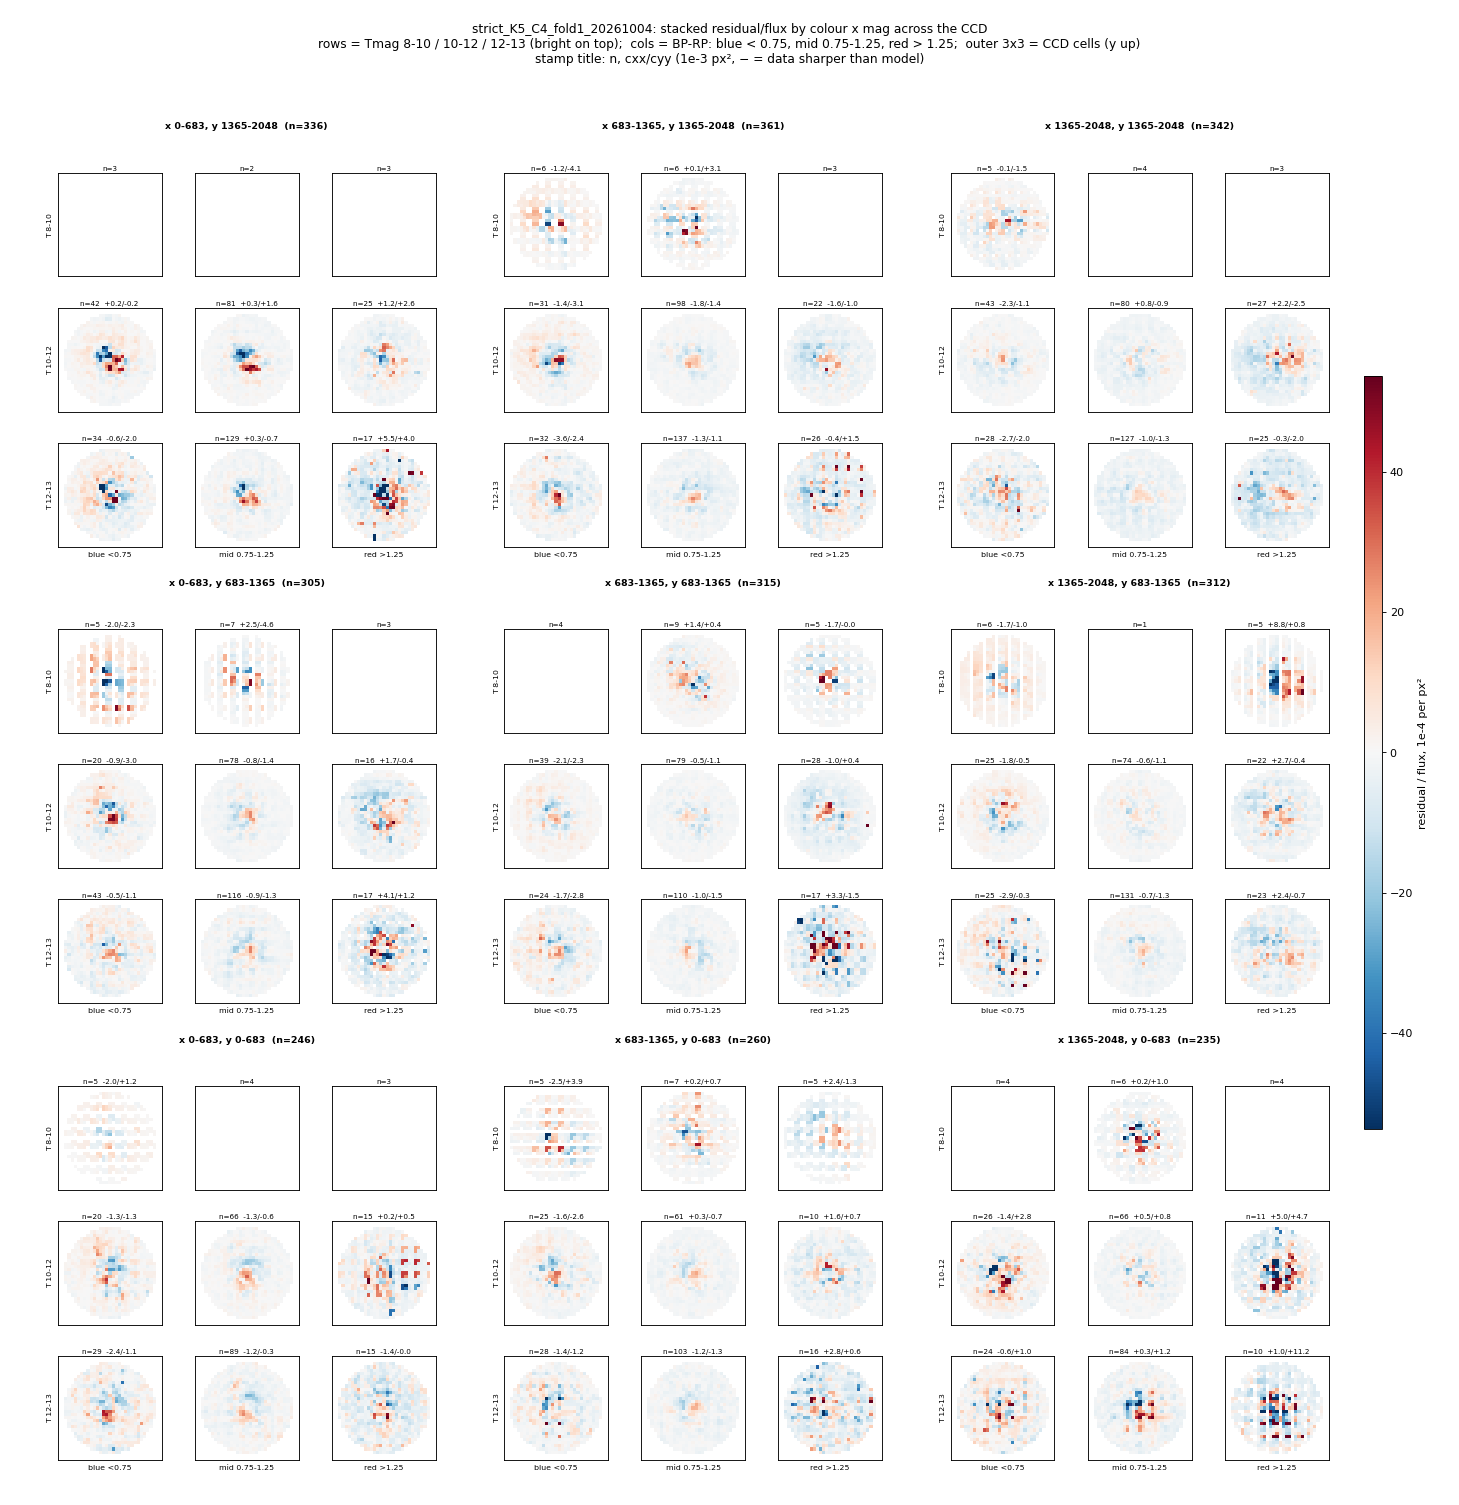
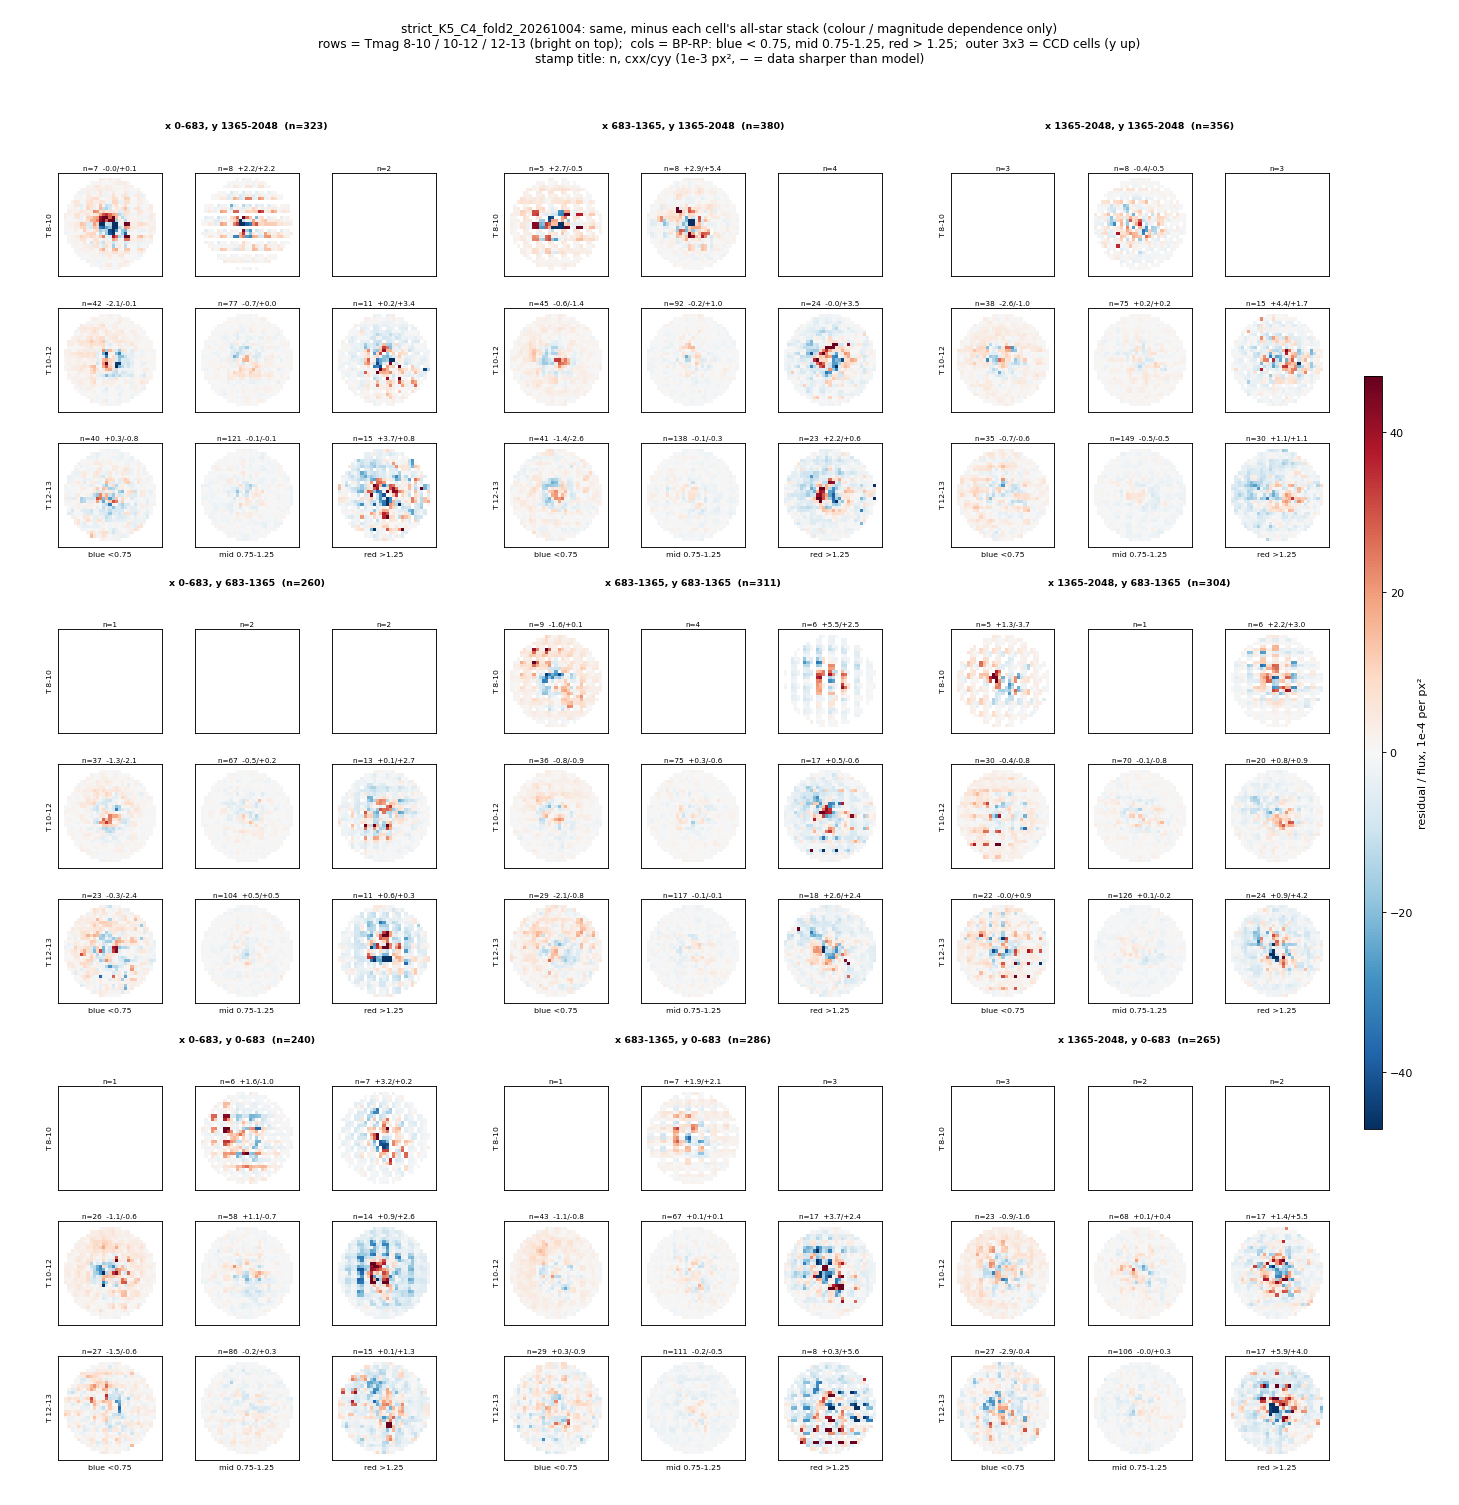
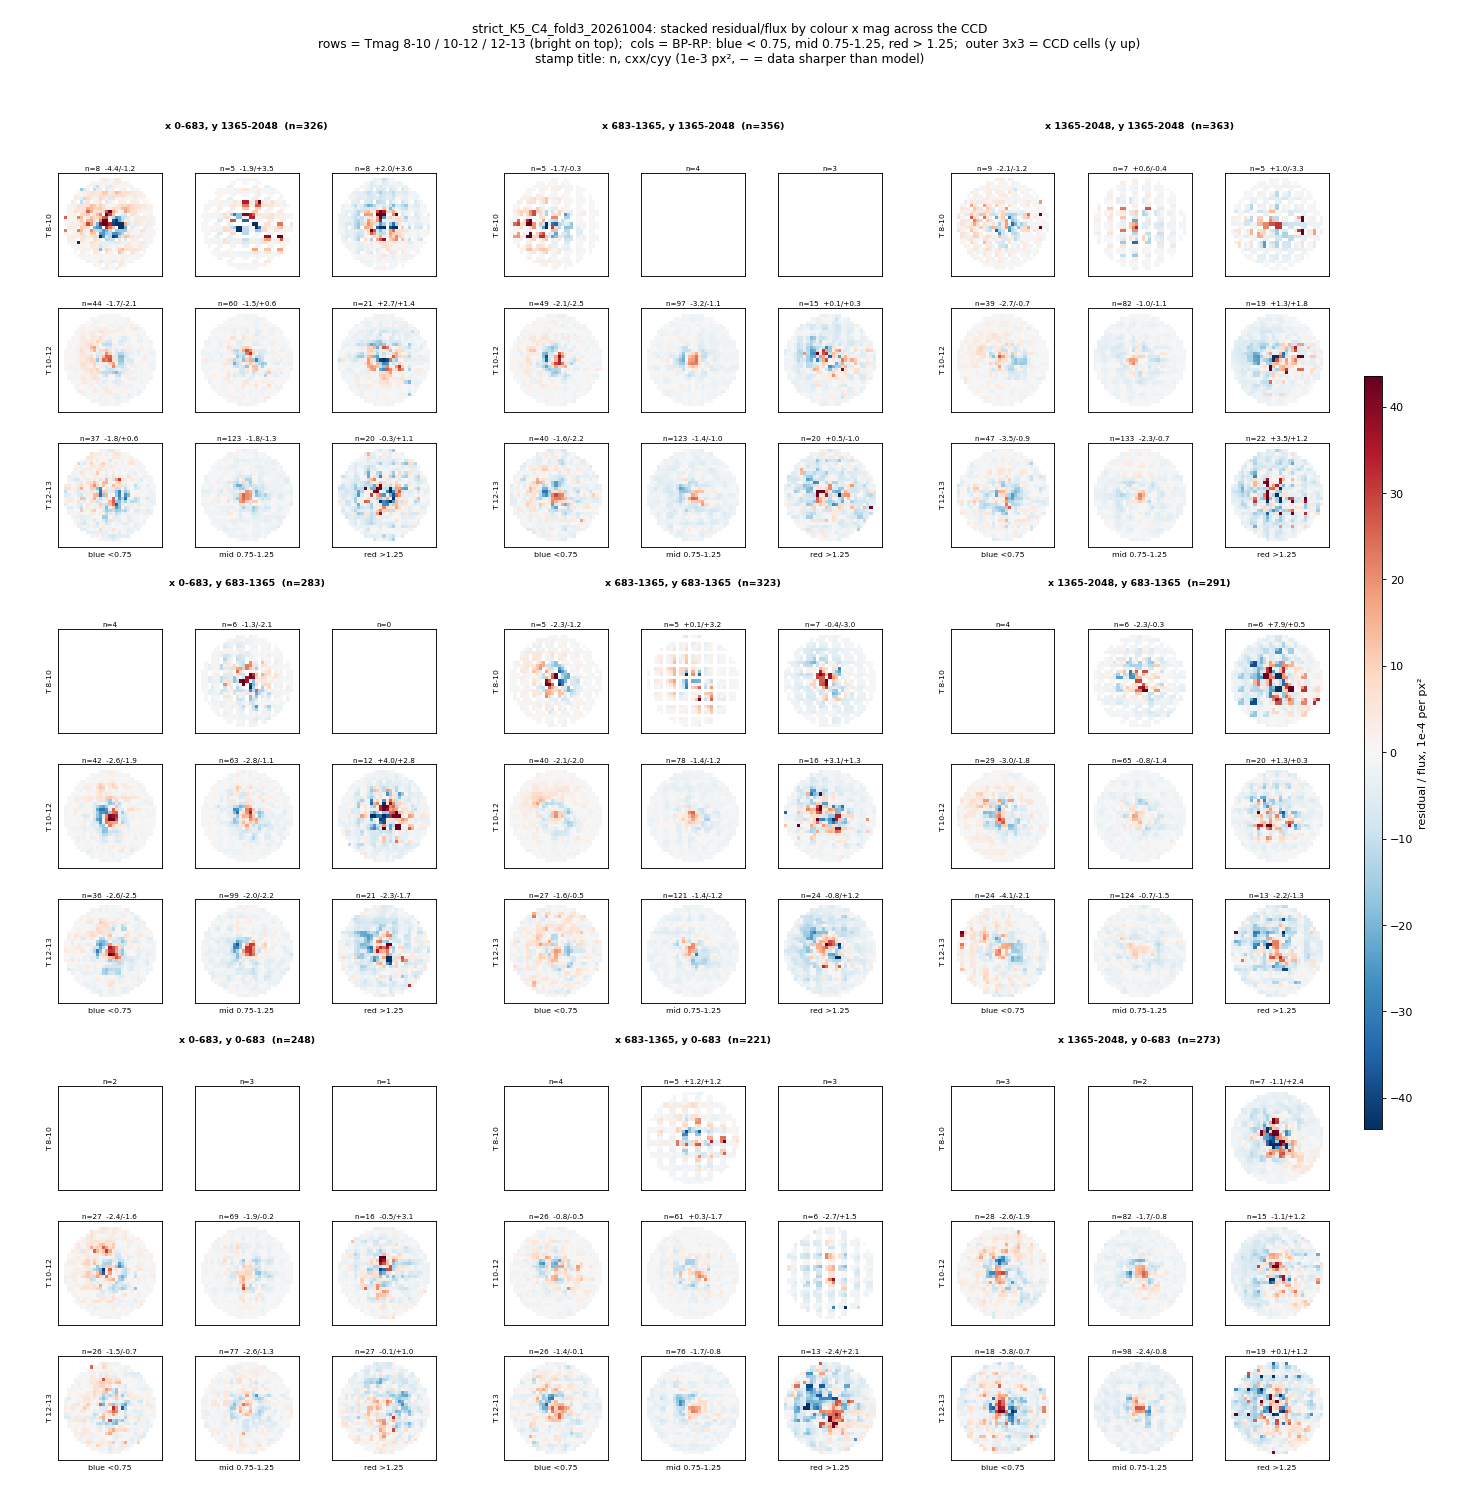
The pooled grid shows spatially varying blue-bin dipoles, stronger red-bin core structure, and relatively quiet mid-colour bins after cell-mean subtraction. Red upper-left and lower-left cells retain strong opposing lobes. Individual folds contain many empty bright-colour cells and striped/checkerboard sampling; they are not featureless residuals.
Display bins: Gaia BP−RP and fitted-flux-derived TESS magnitude, not catalogue T / fitted XP u. The relative grid subtracts each cell’s all-star stack. Colour limits vary between images; sparse or blank bins are not null detections.
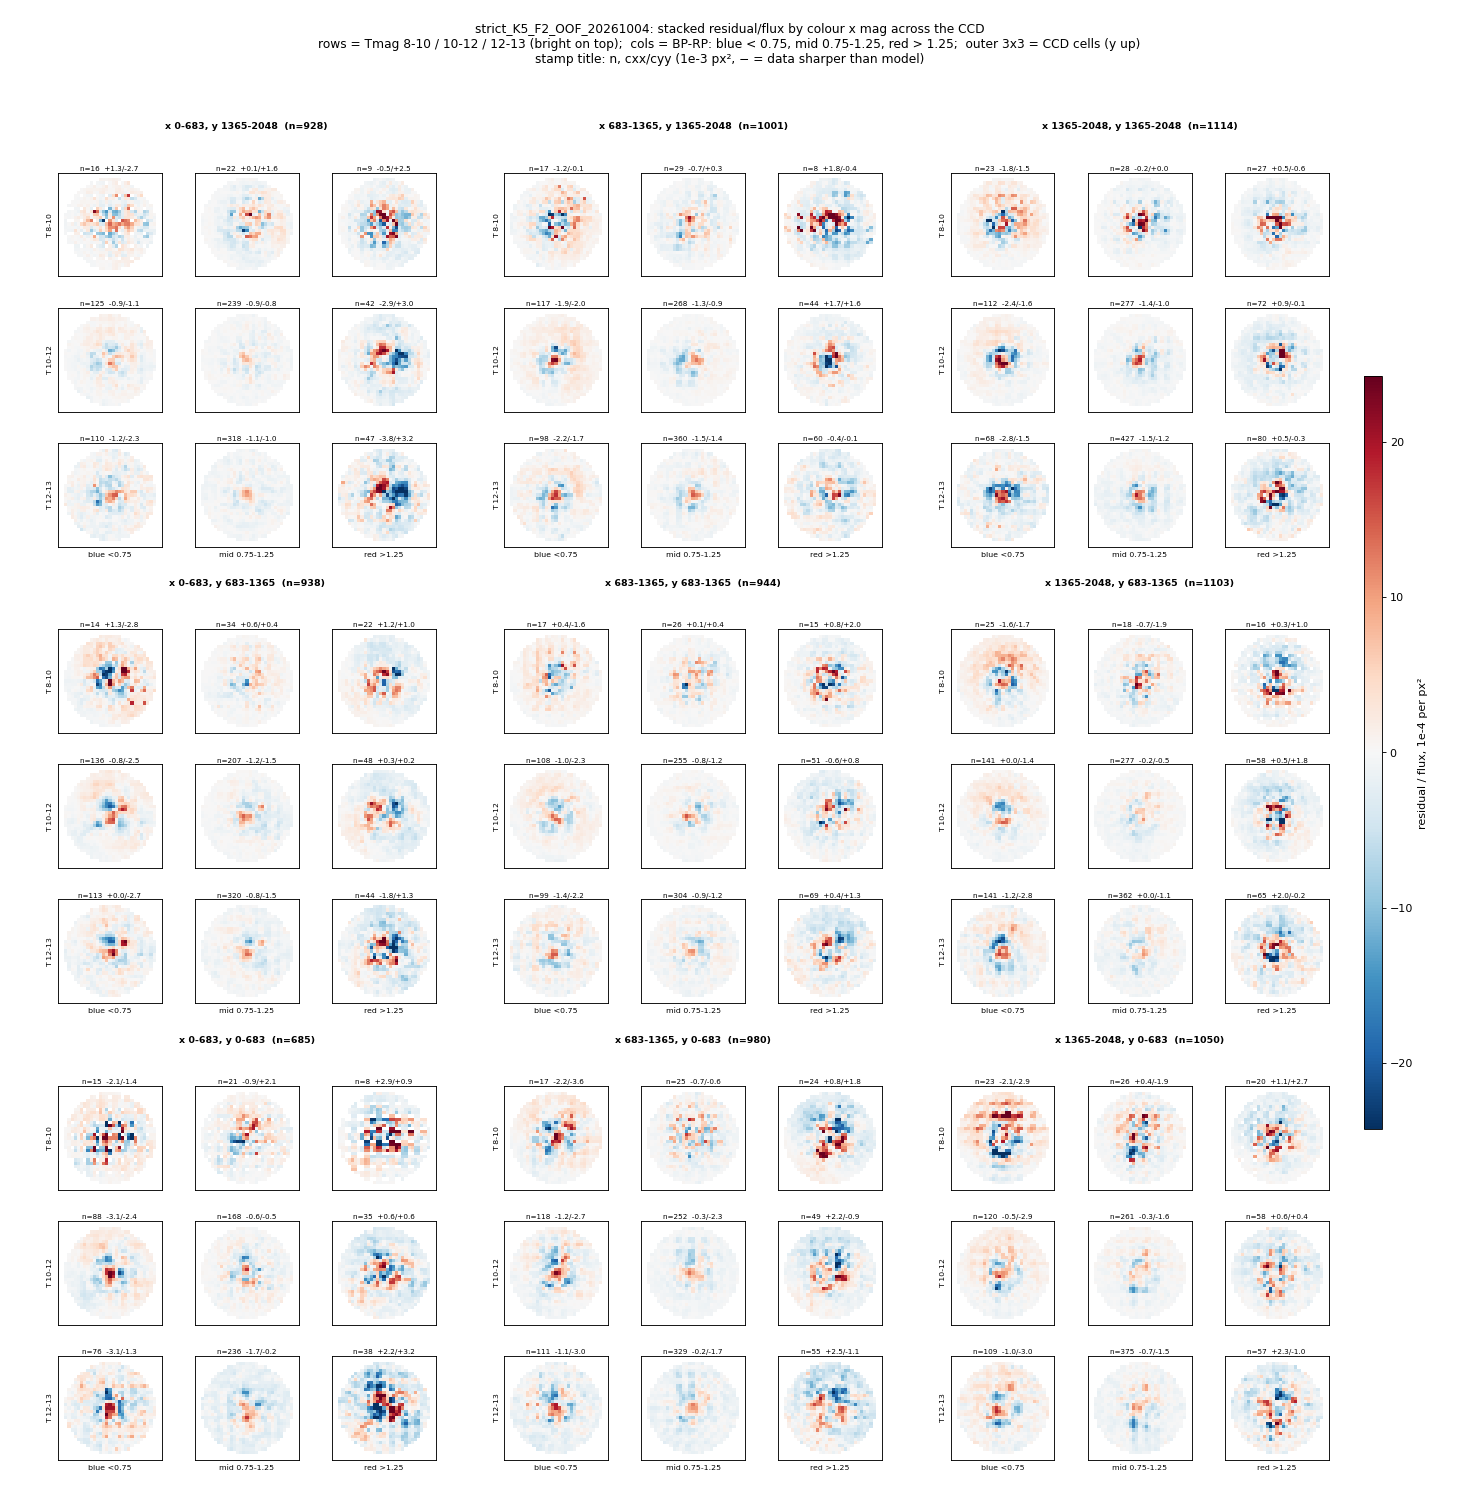
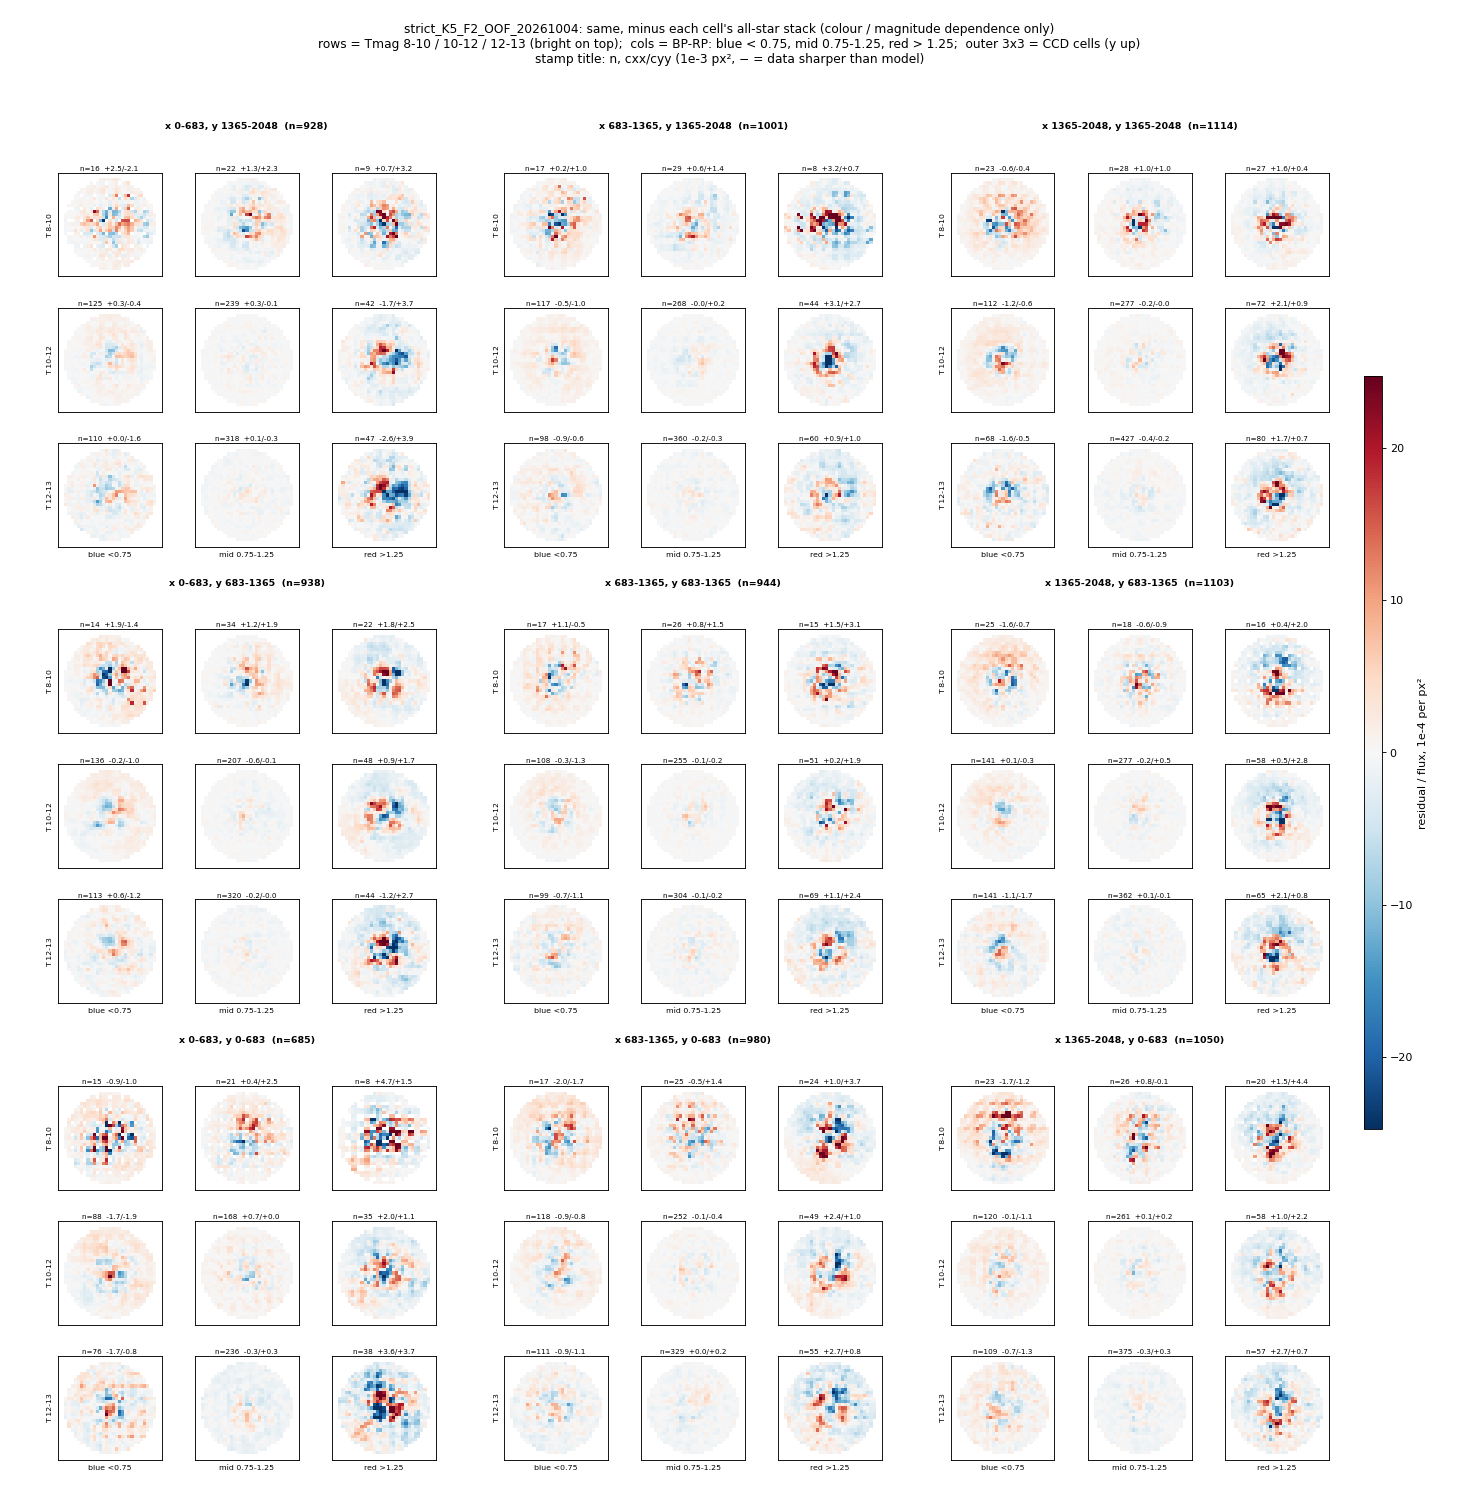
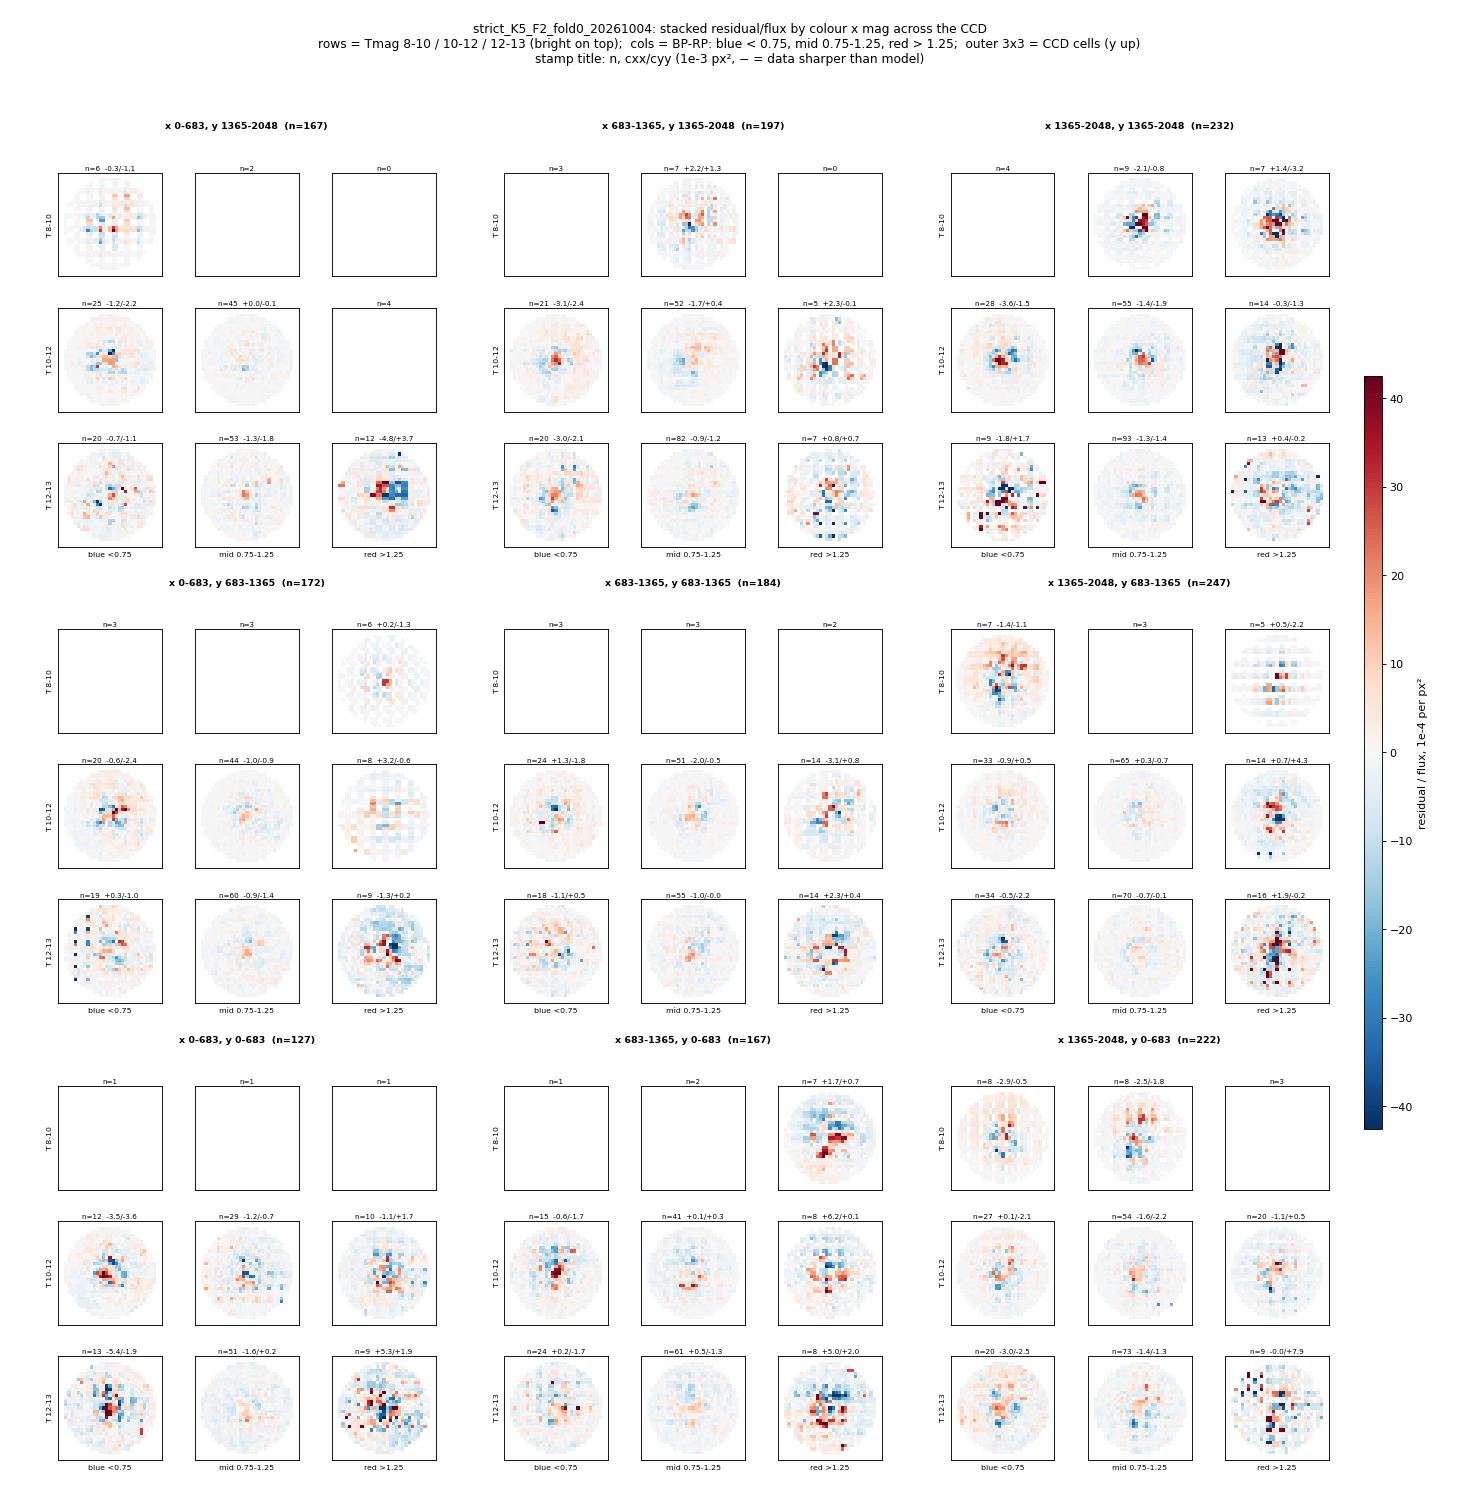
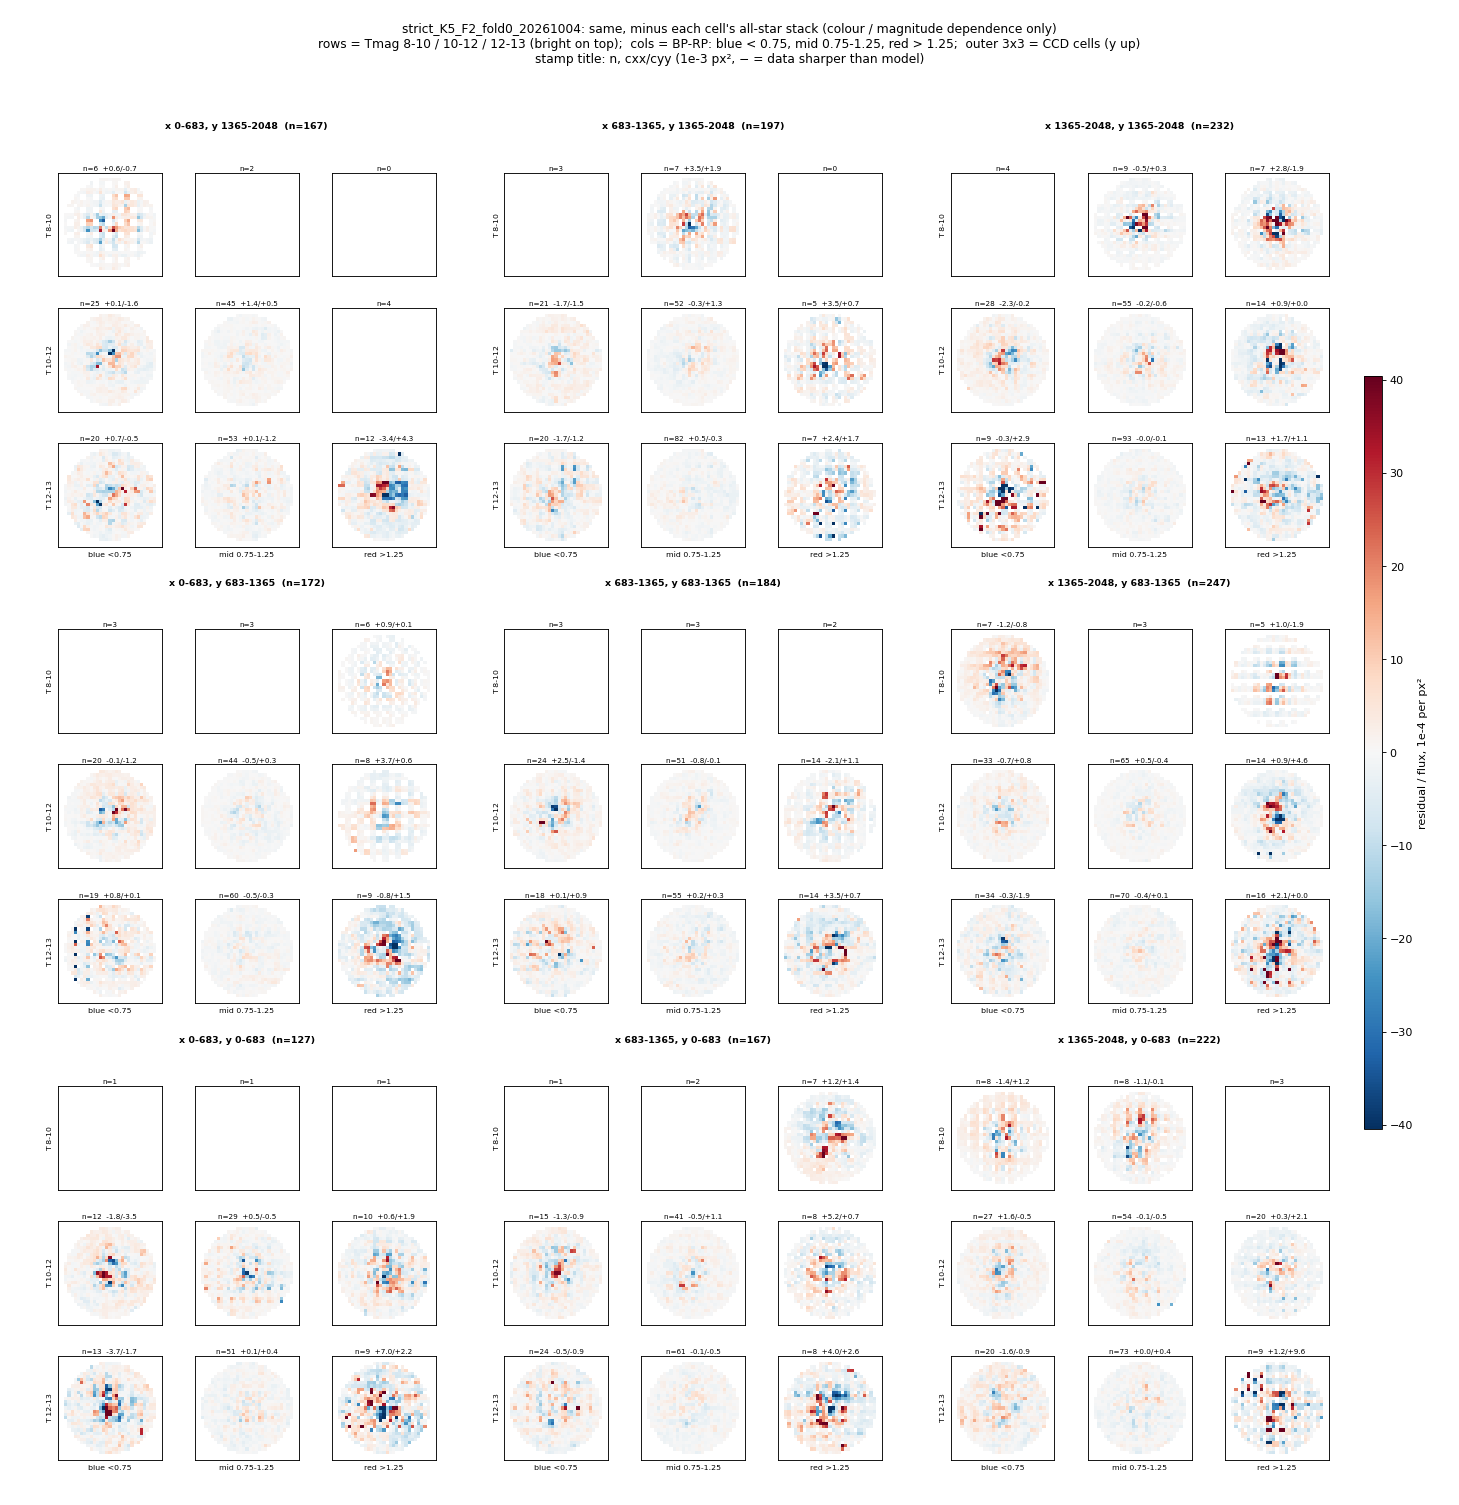
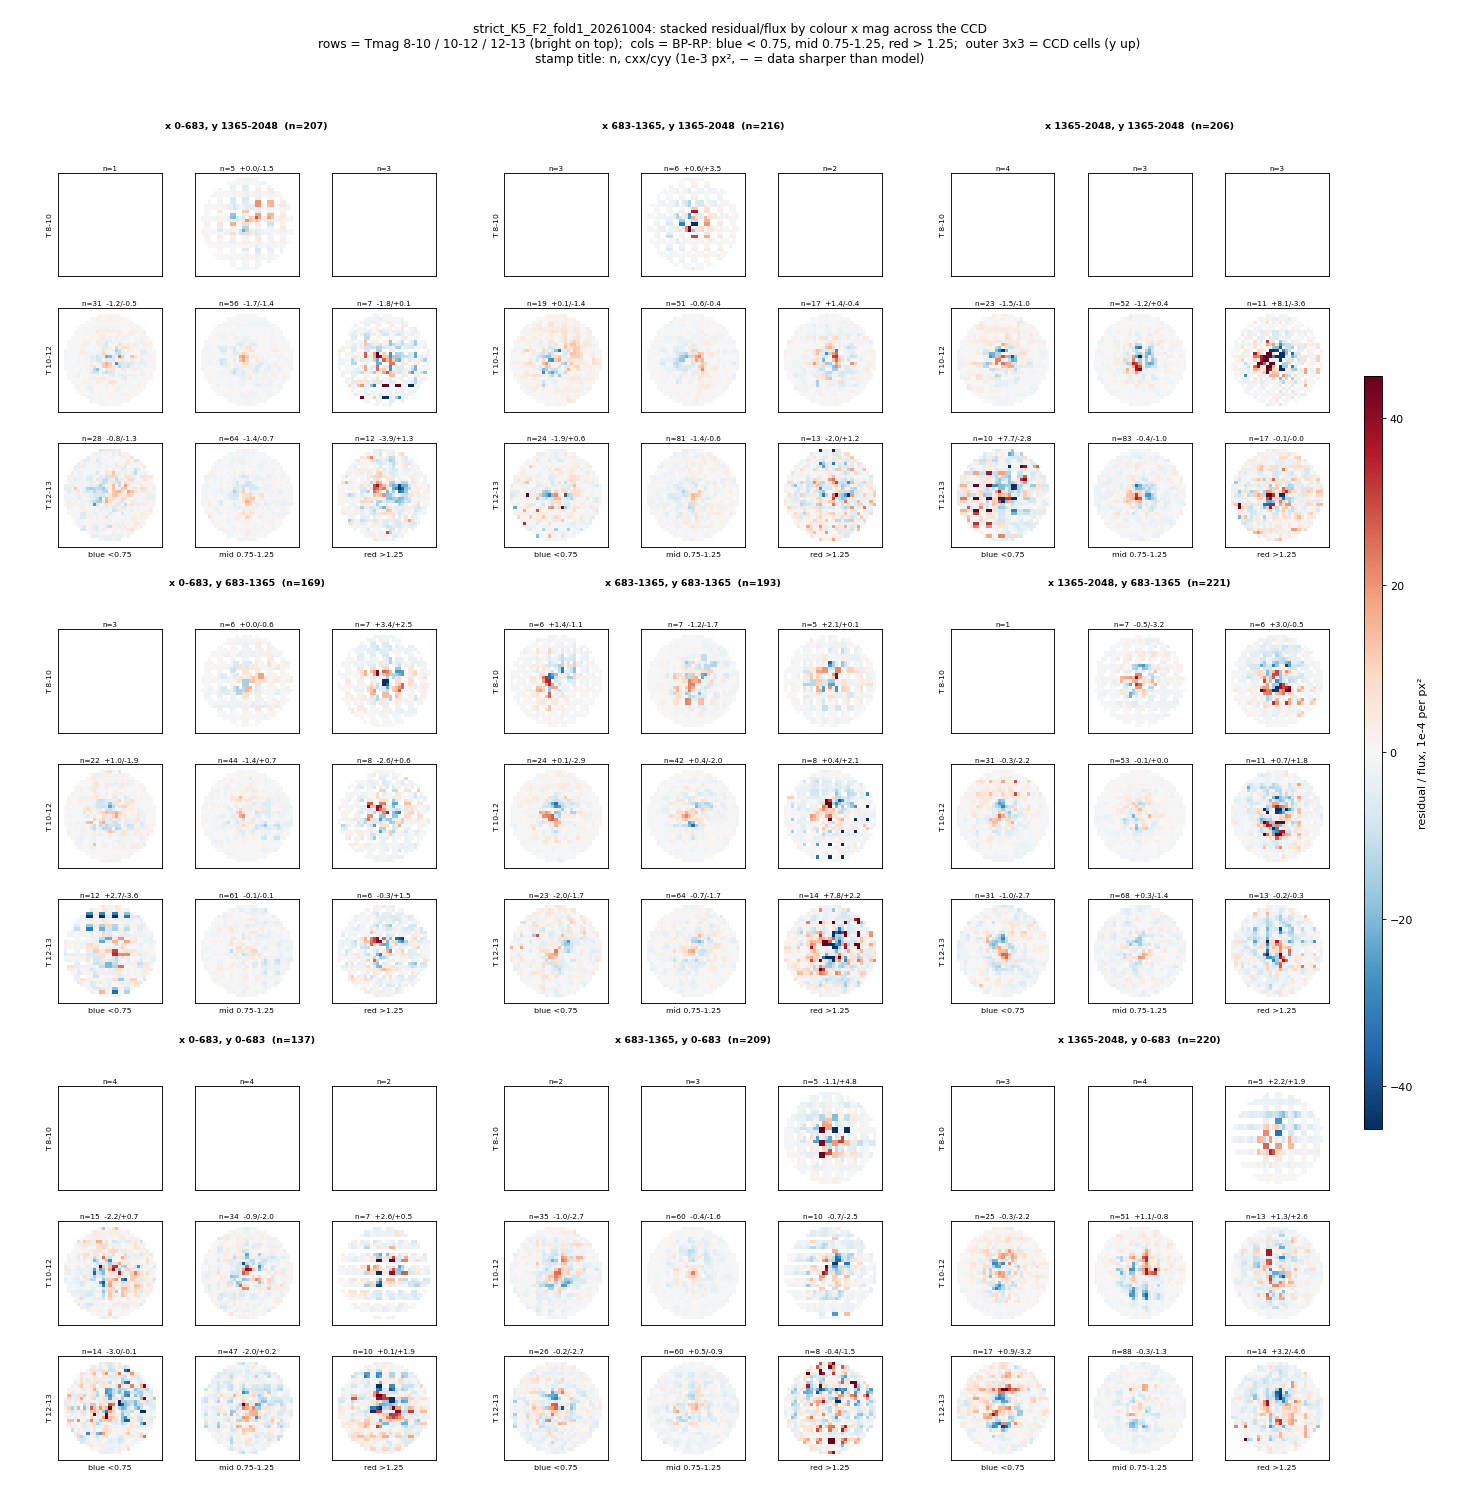
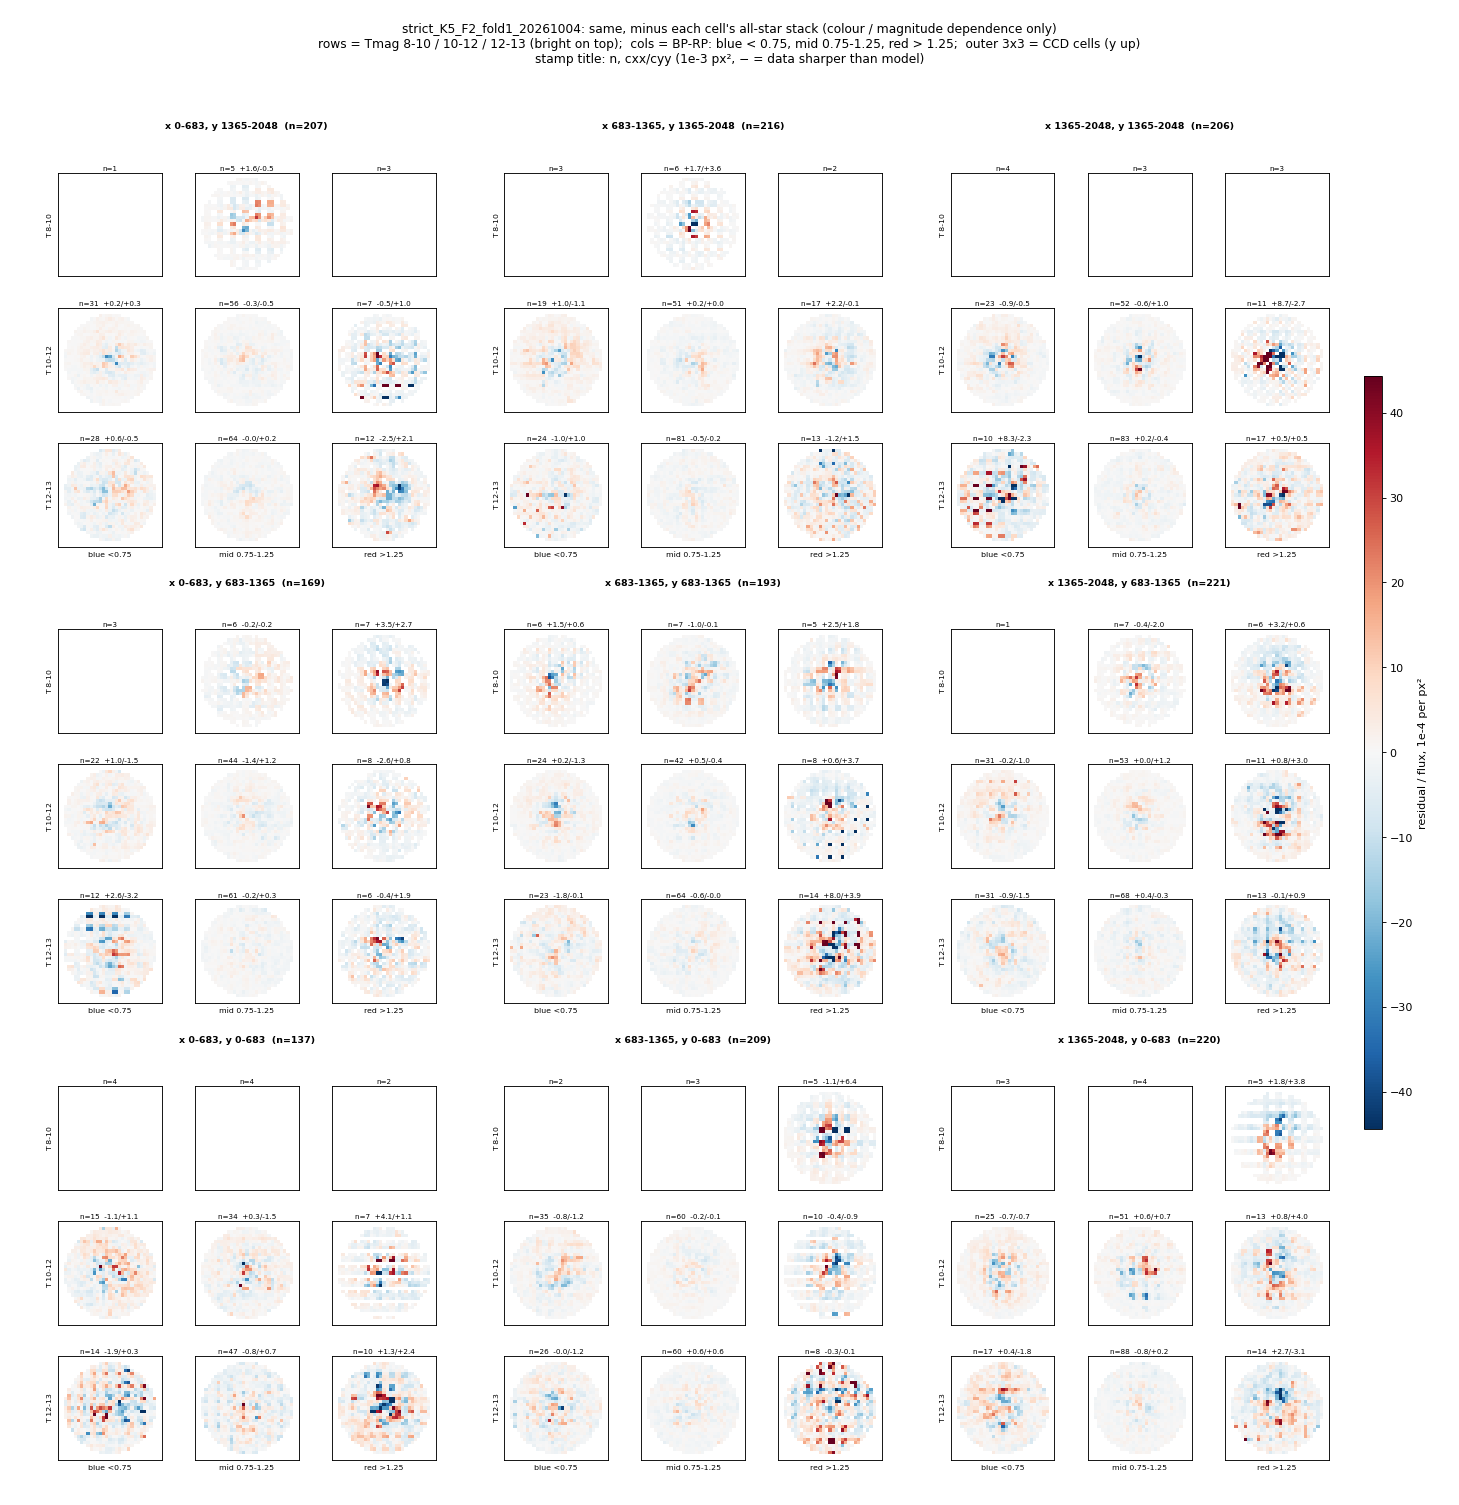
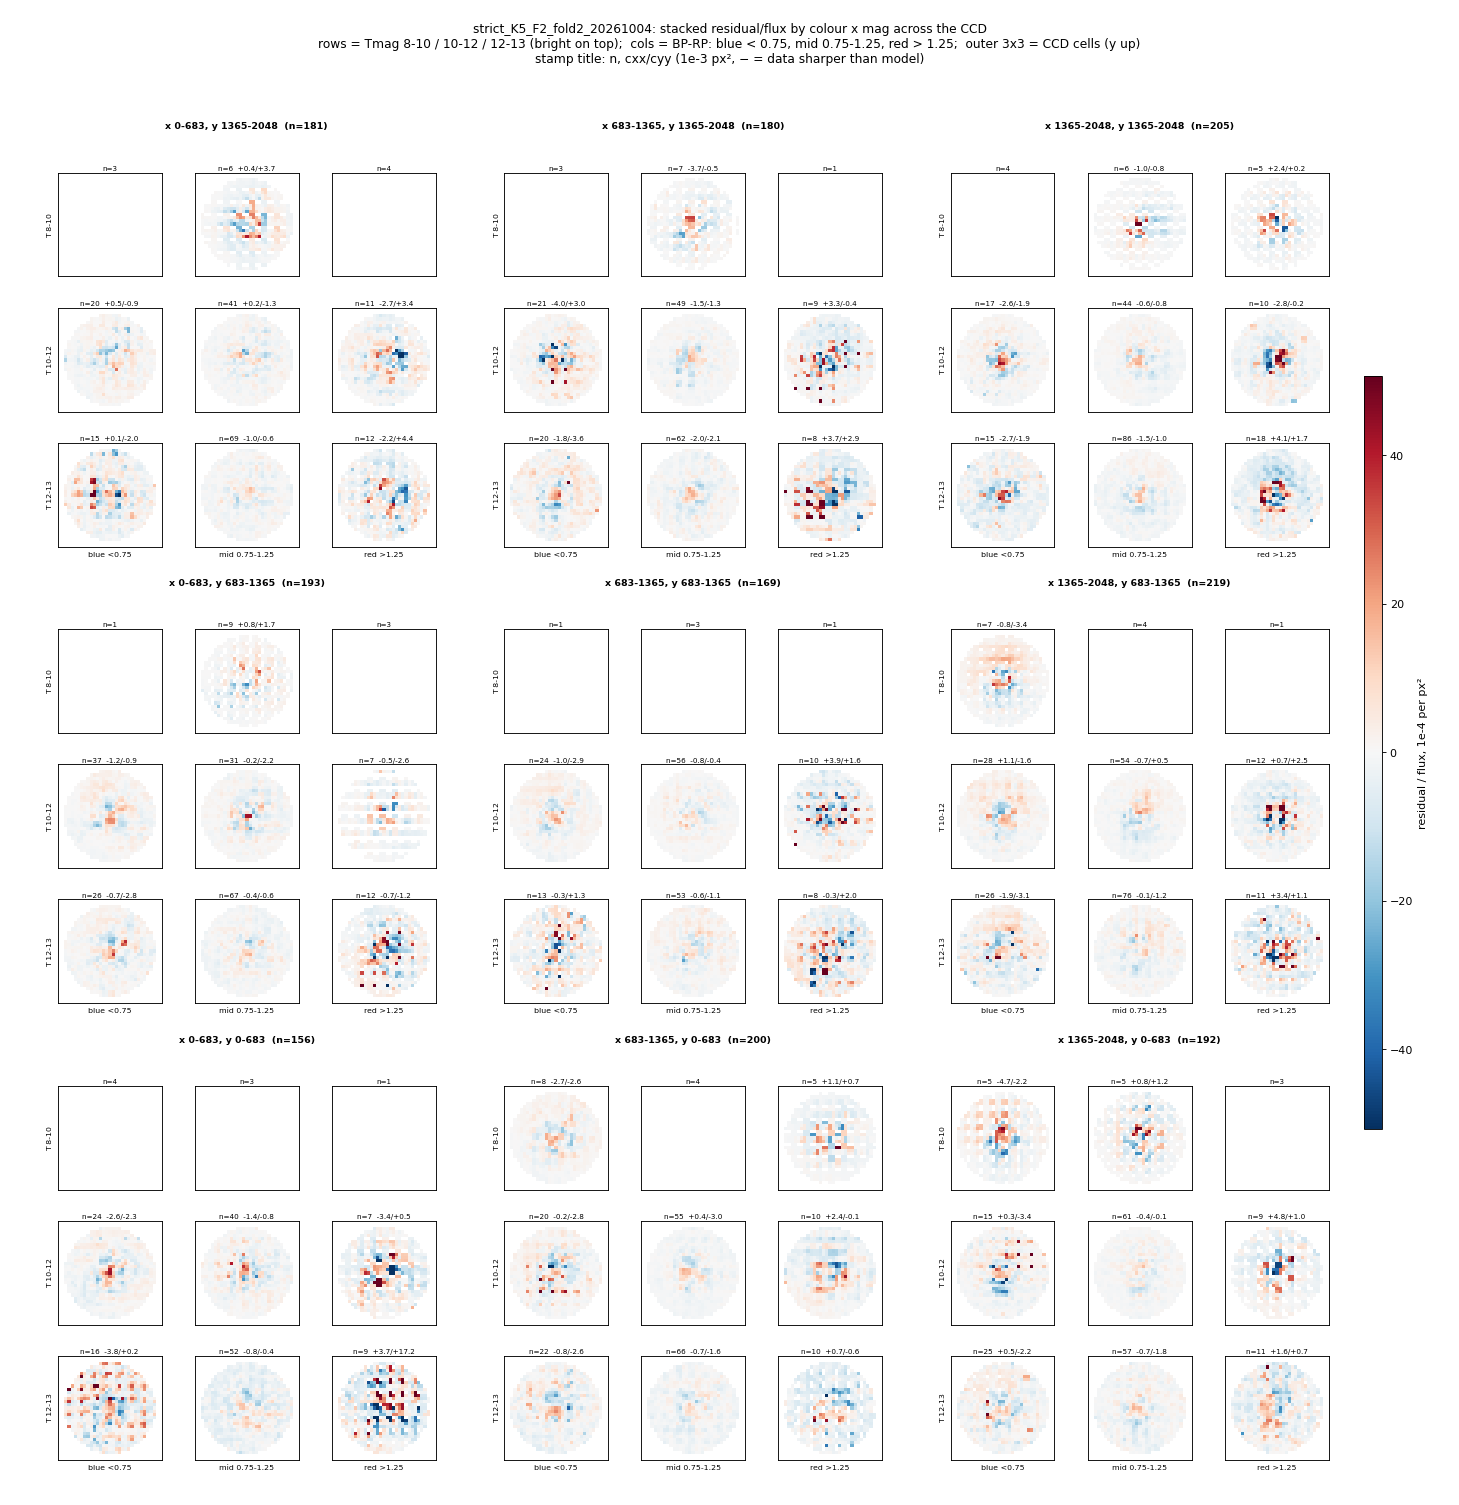
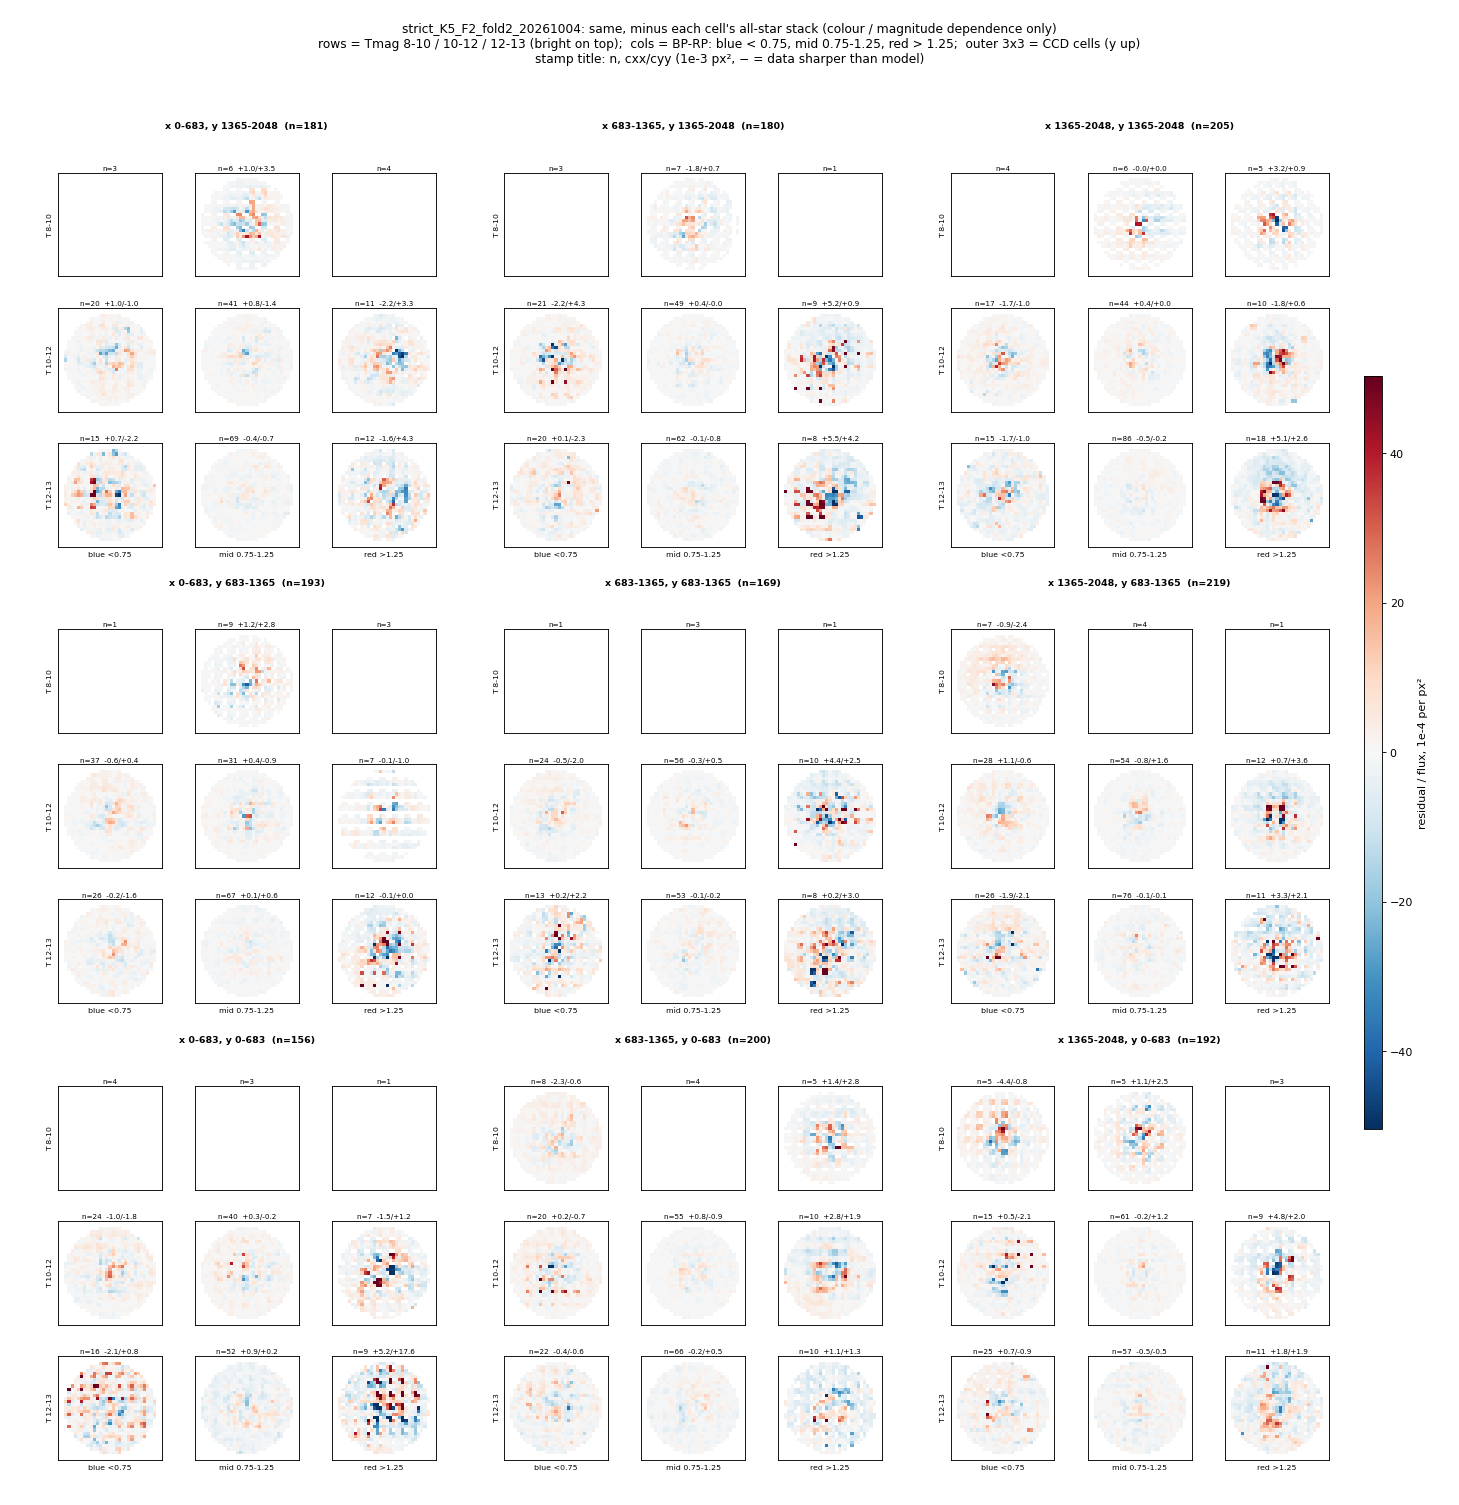
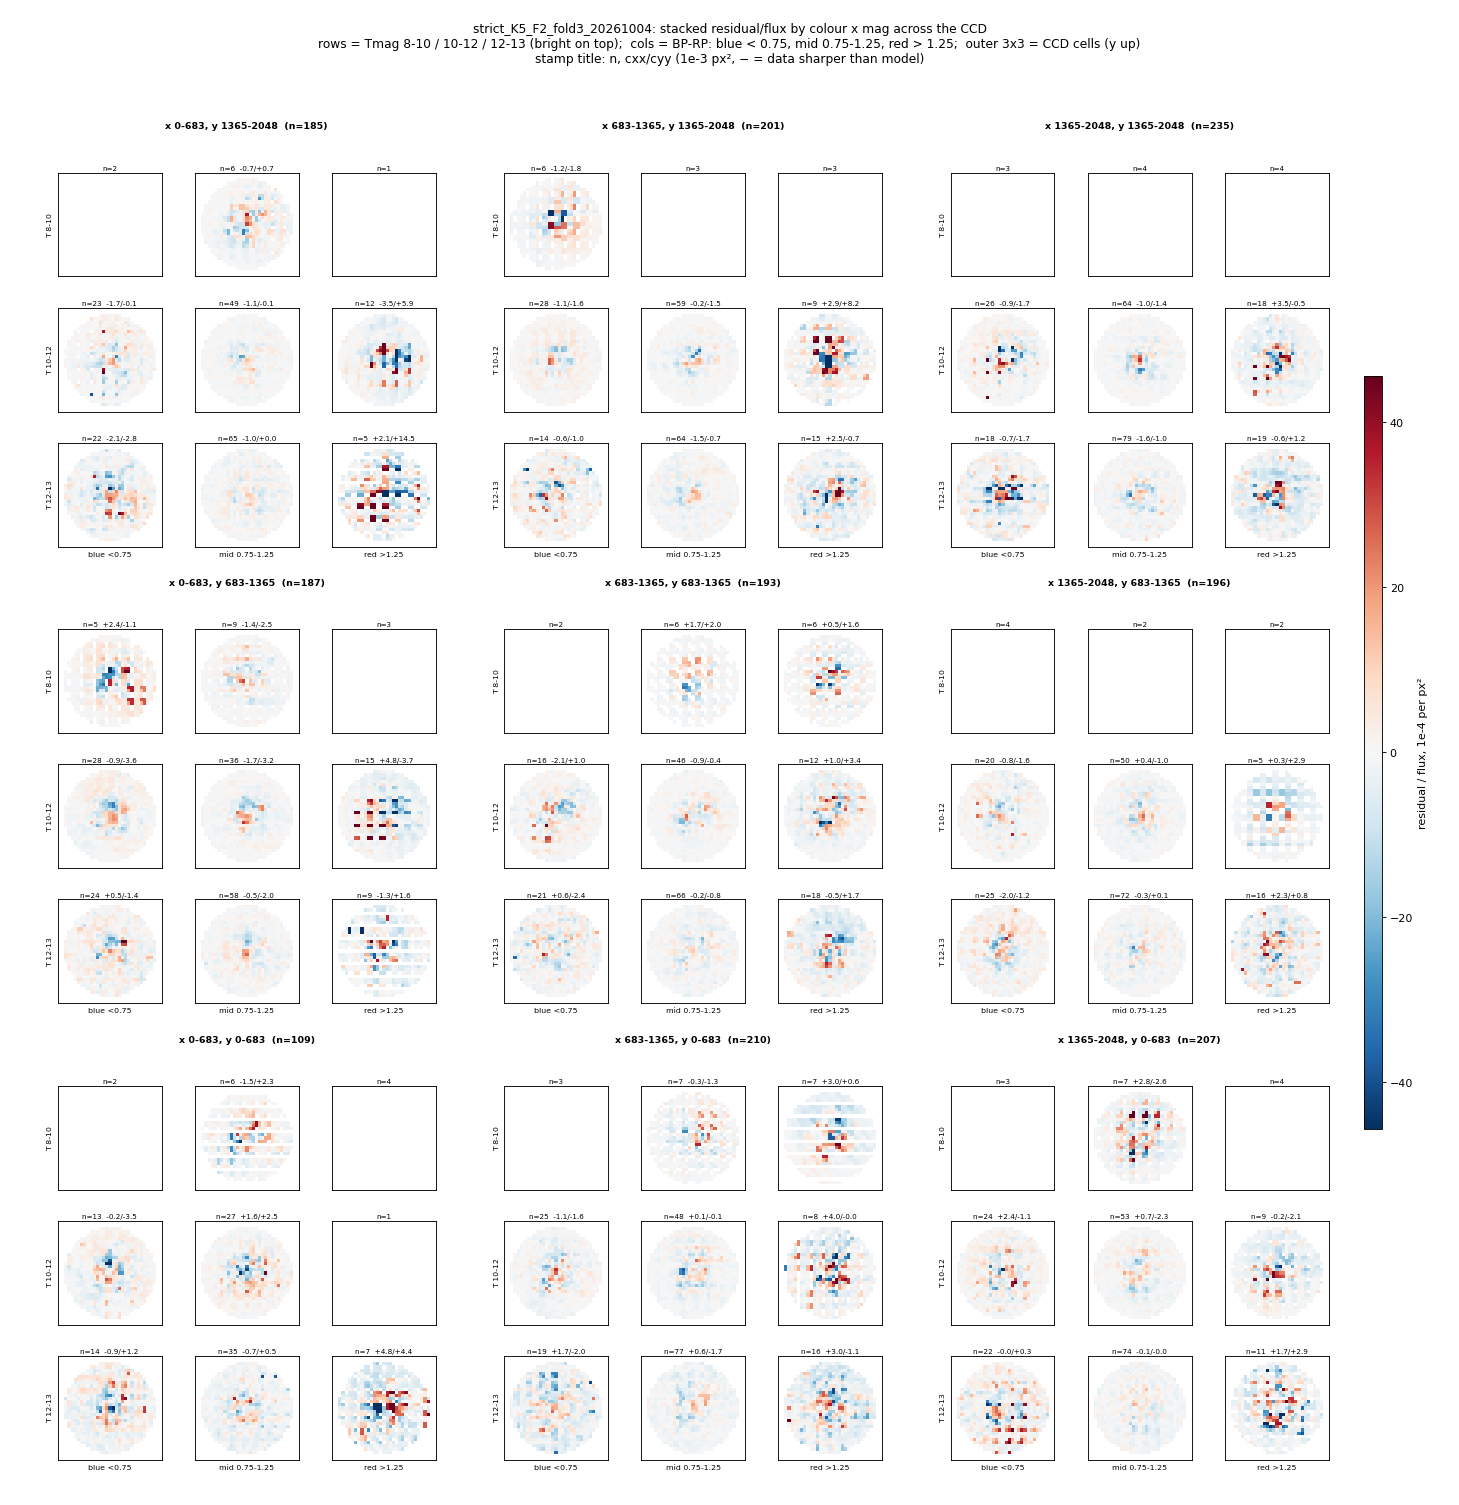
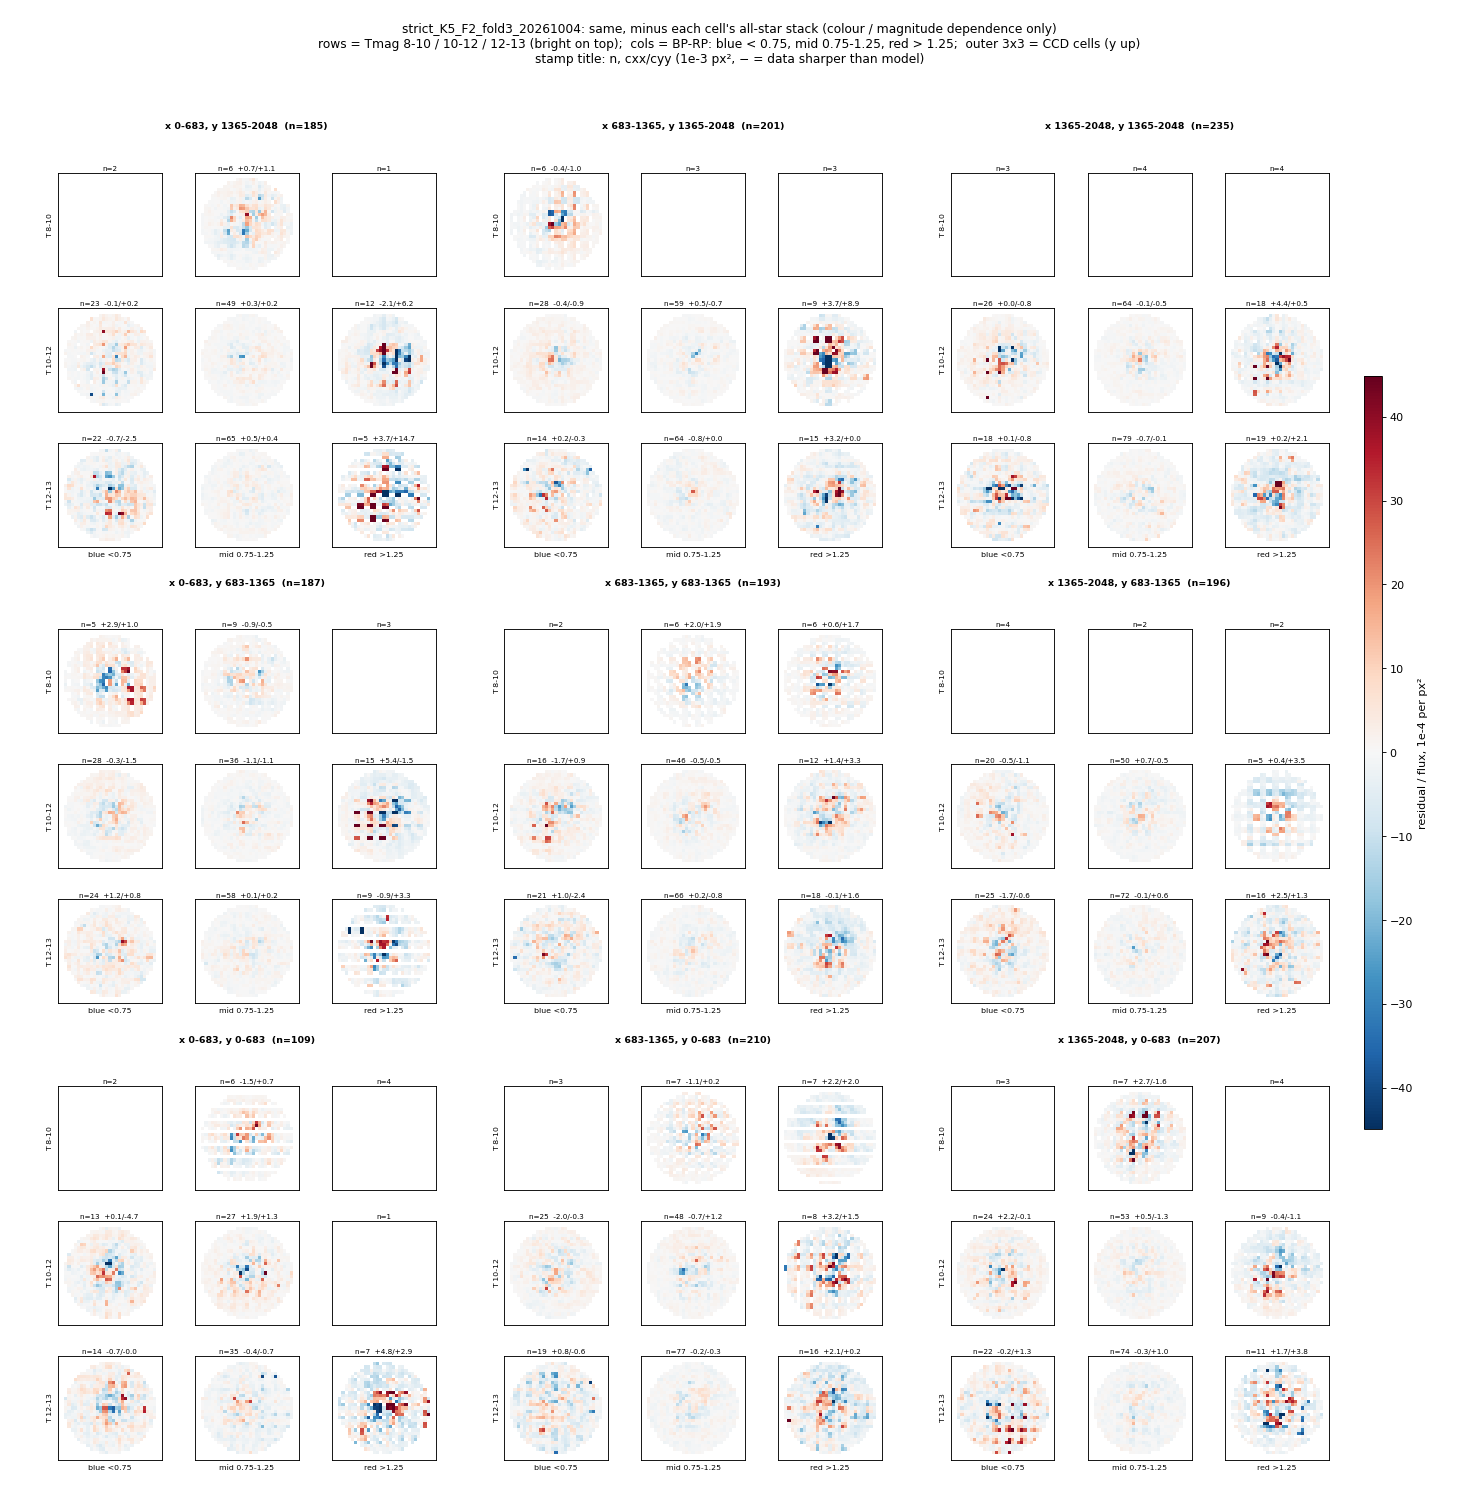
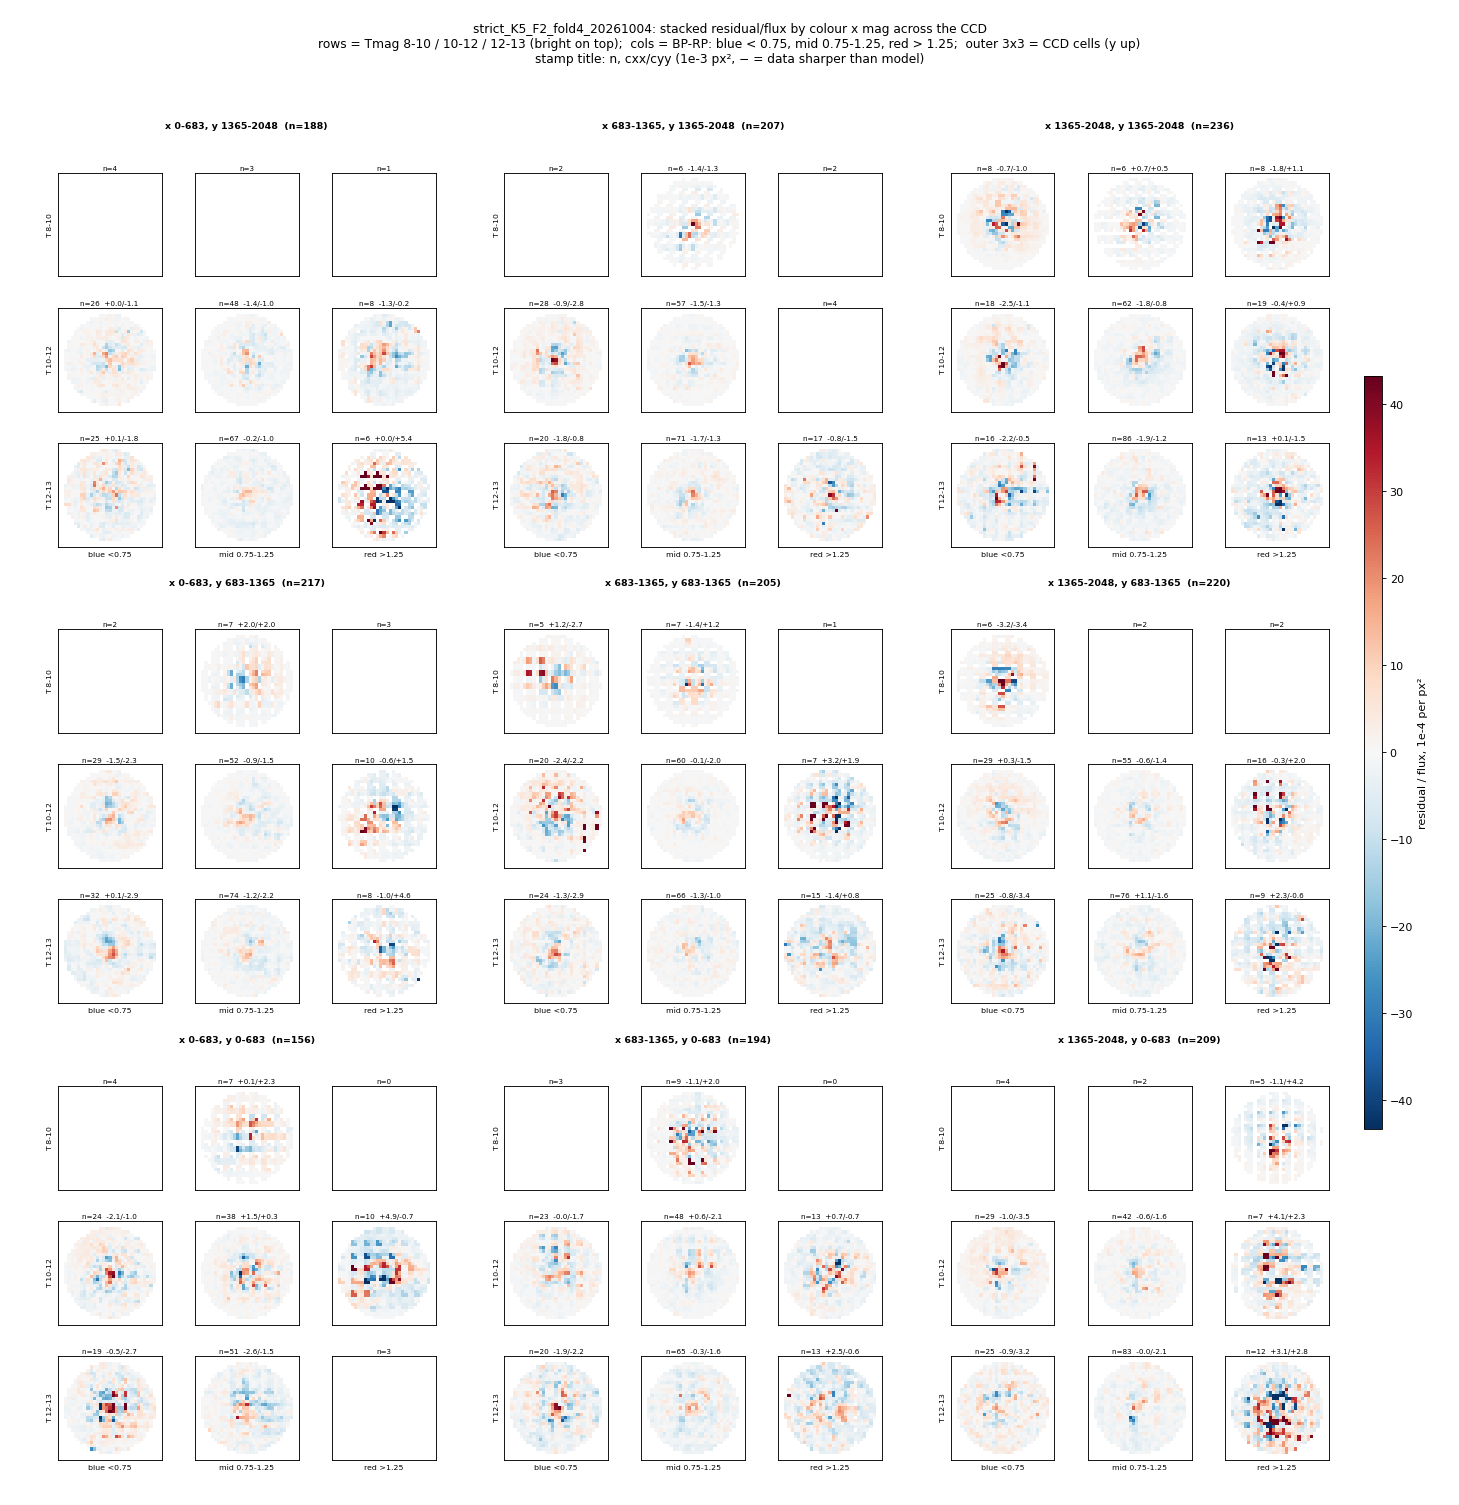
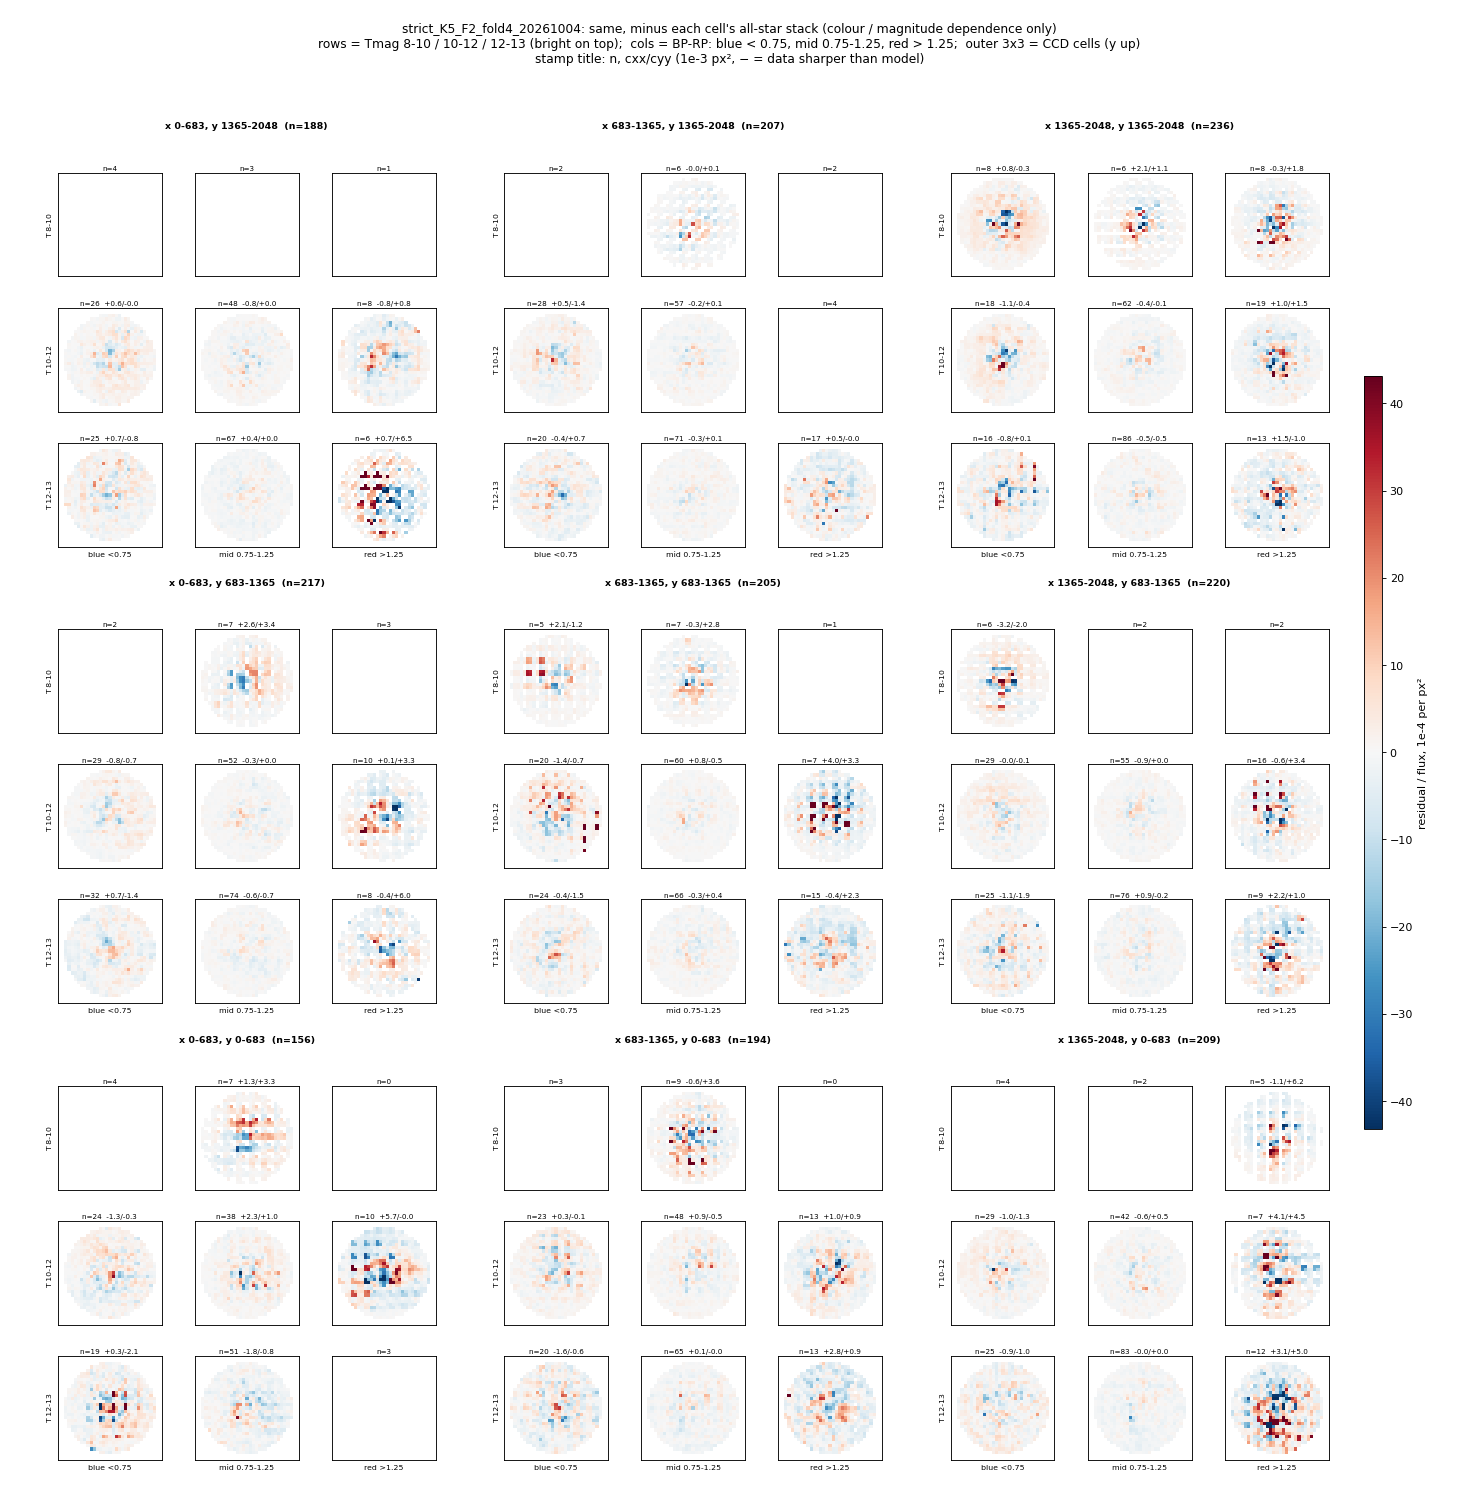
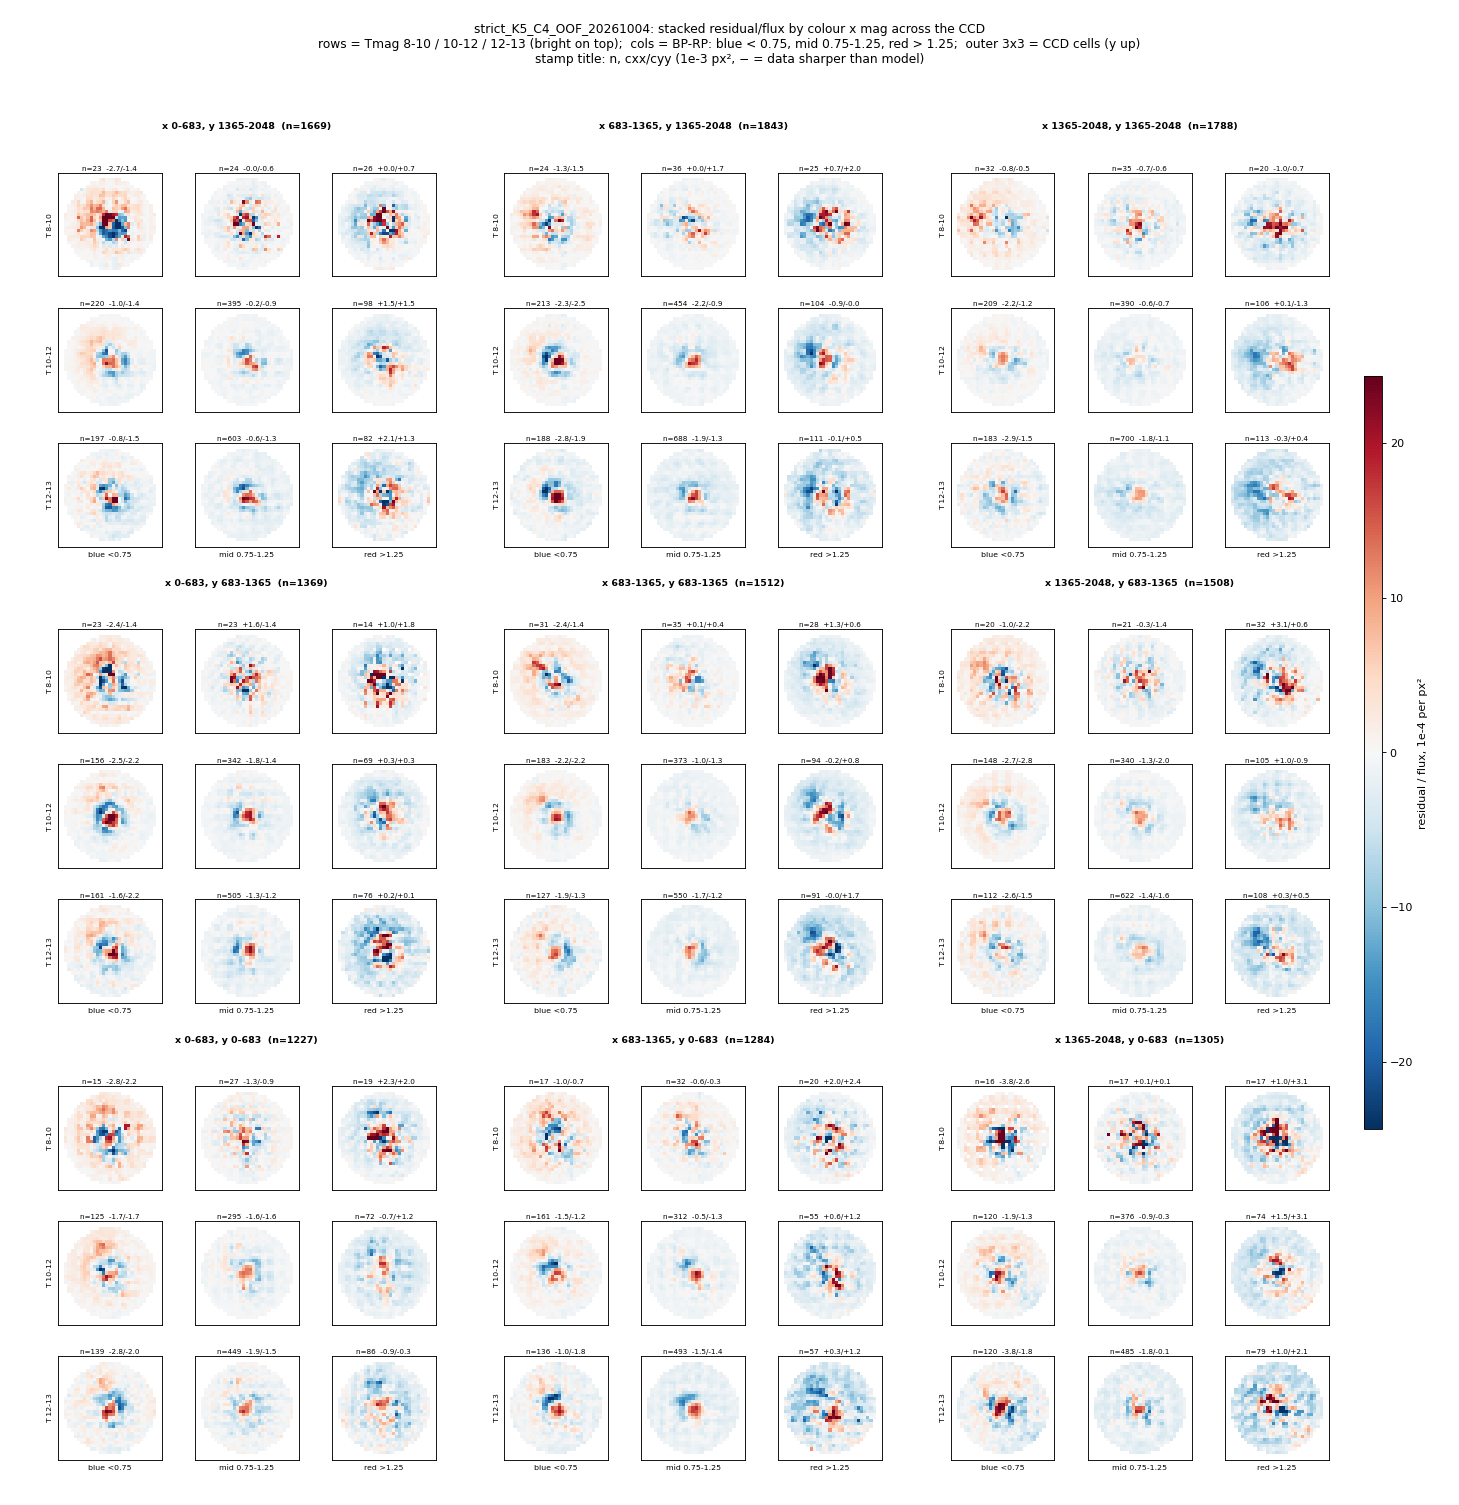
The pooled grid has structured red-bin cores and a broad positive surrounding component in the middle-right CCD cell, alongside negative blue cores in some bright bins. The relative view removes part of the shared surrounding signal but preserves colour-dependent lobes. Folds show variable sampling stripes and blank bright bins; no unique single residual mode is established.
Display bins: Gaia BP−RP and fitted-flux-derived TESS magnitude, not catalogue T / fitted XP u. The relative grid subtracts each cell’s all-star stack. Colour limits vary between images; sparse or blank bins are not null detections.
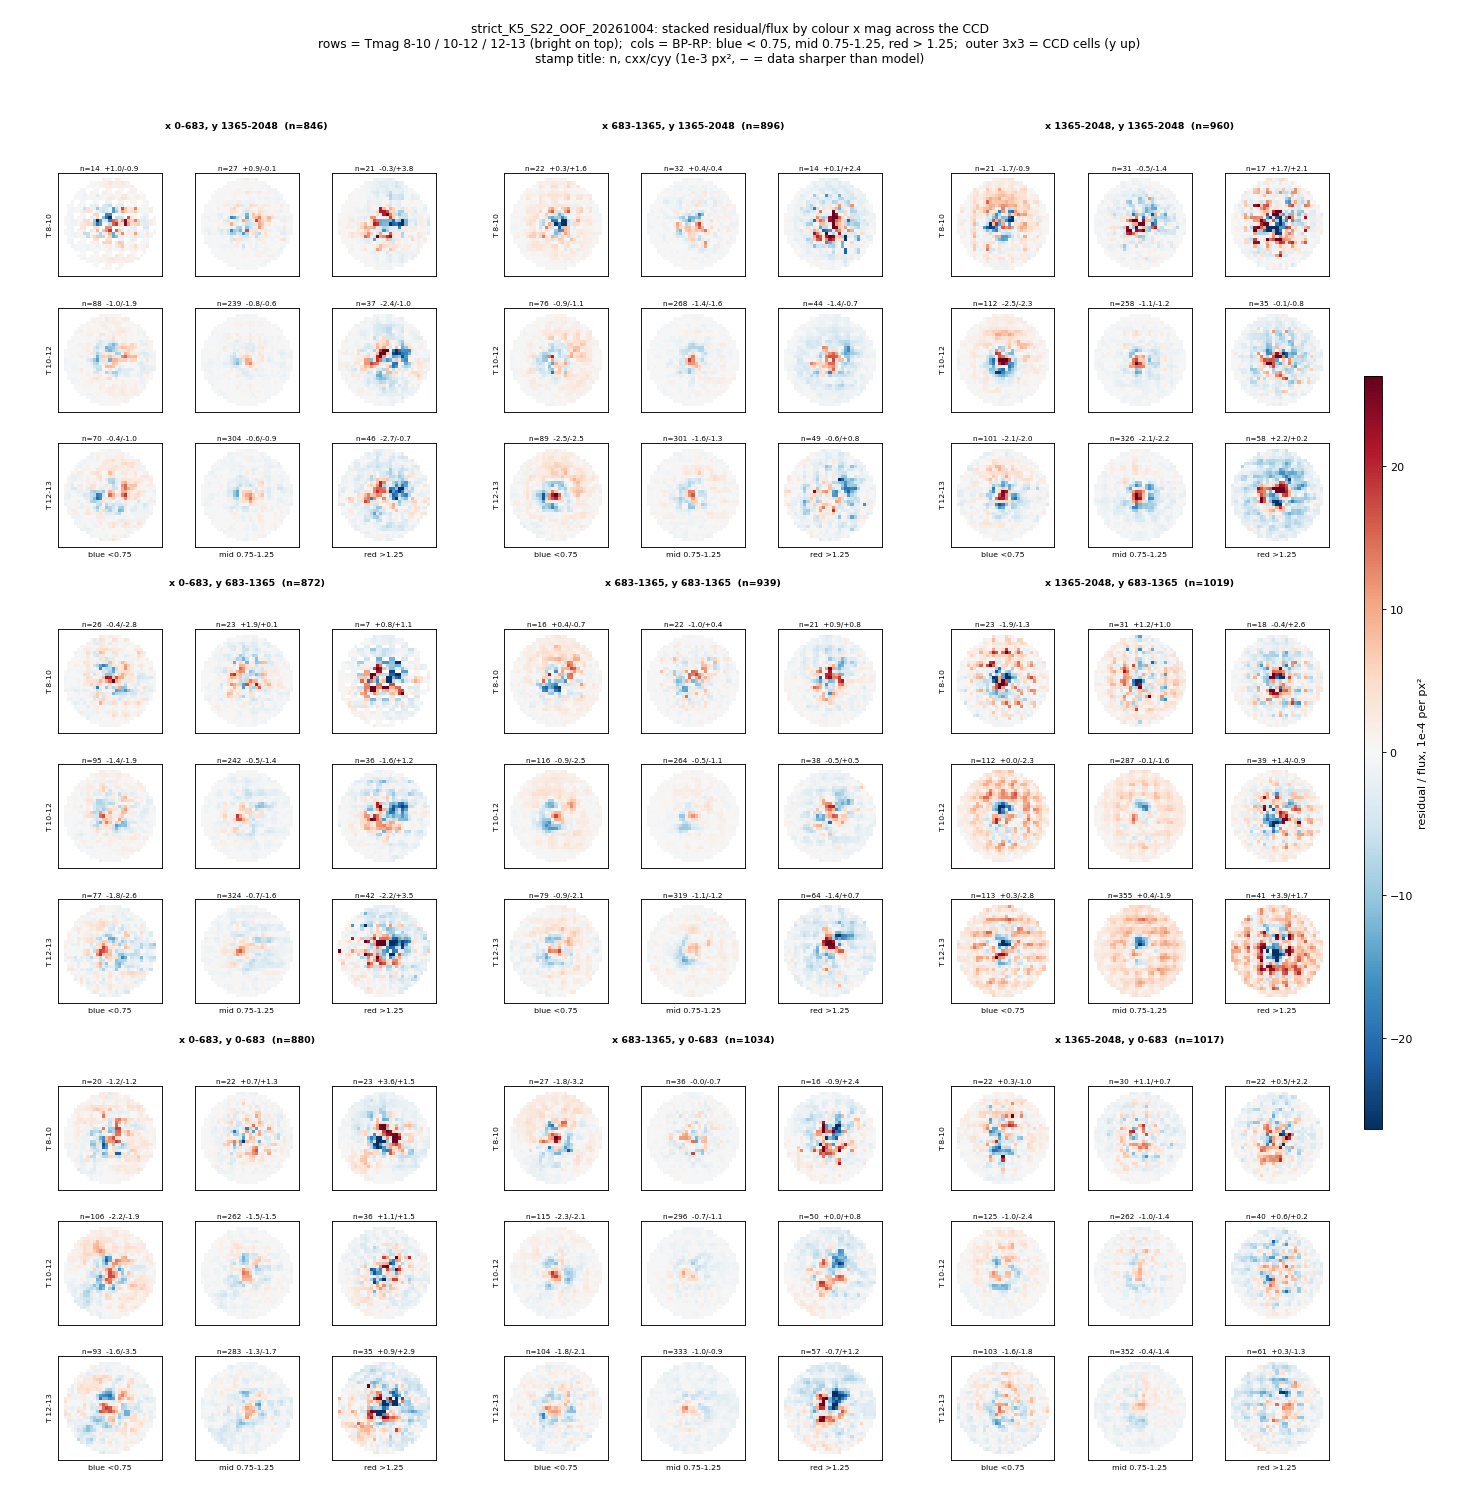
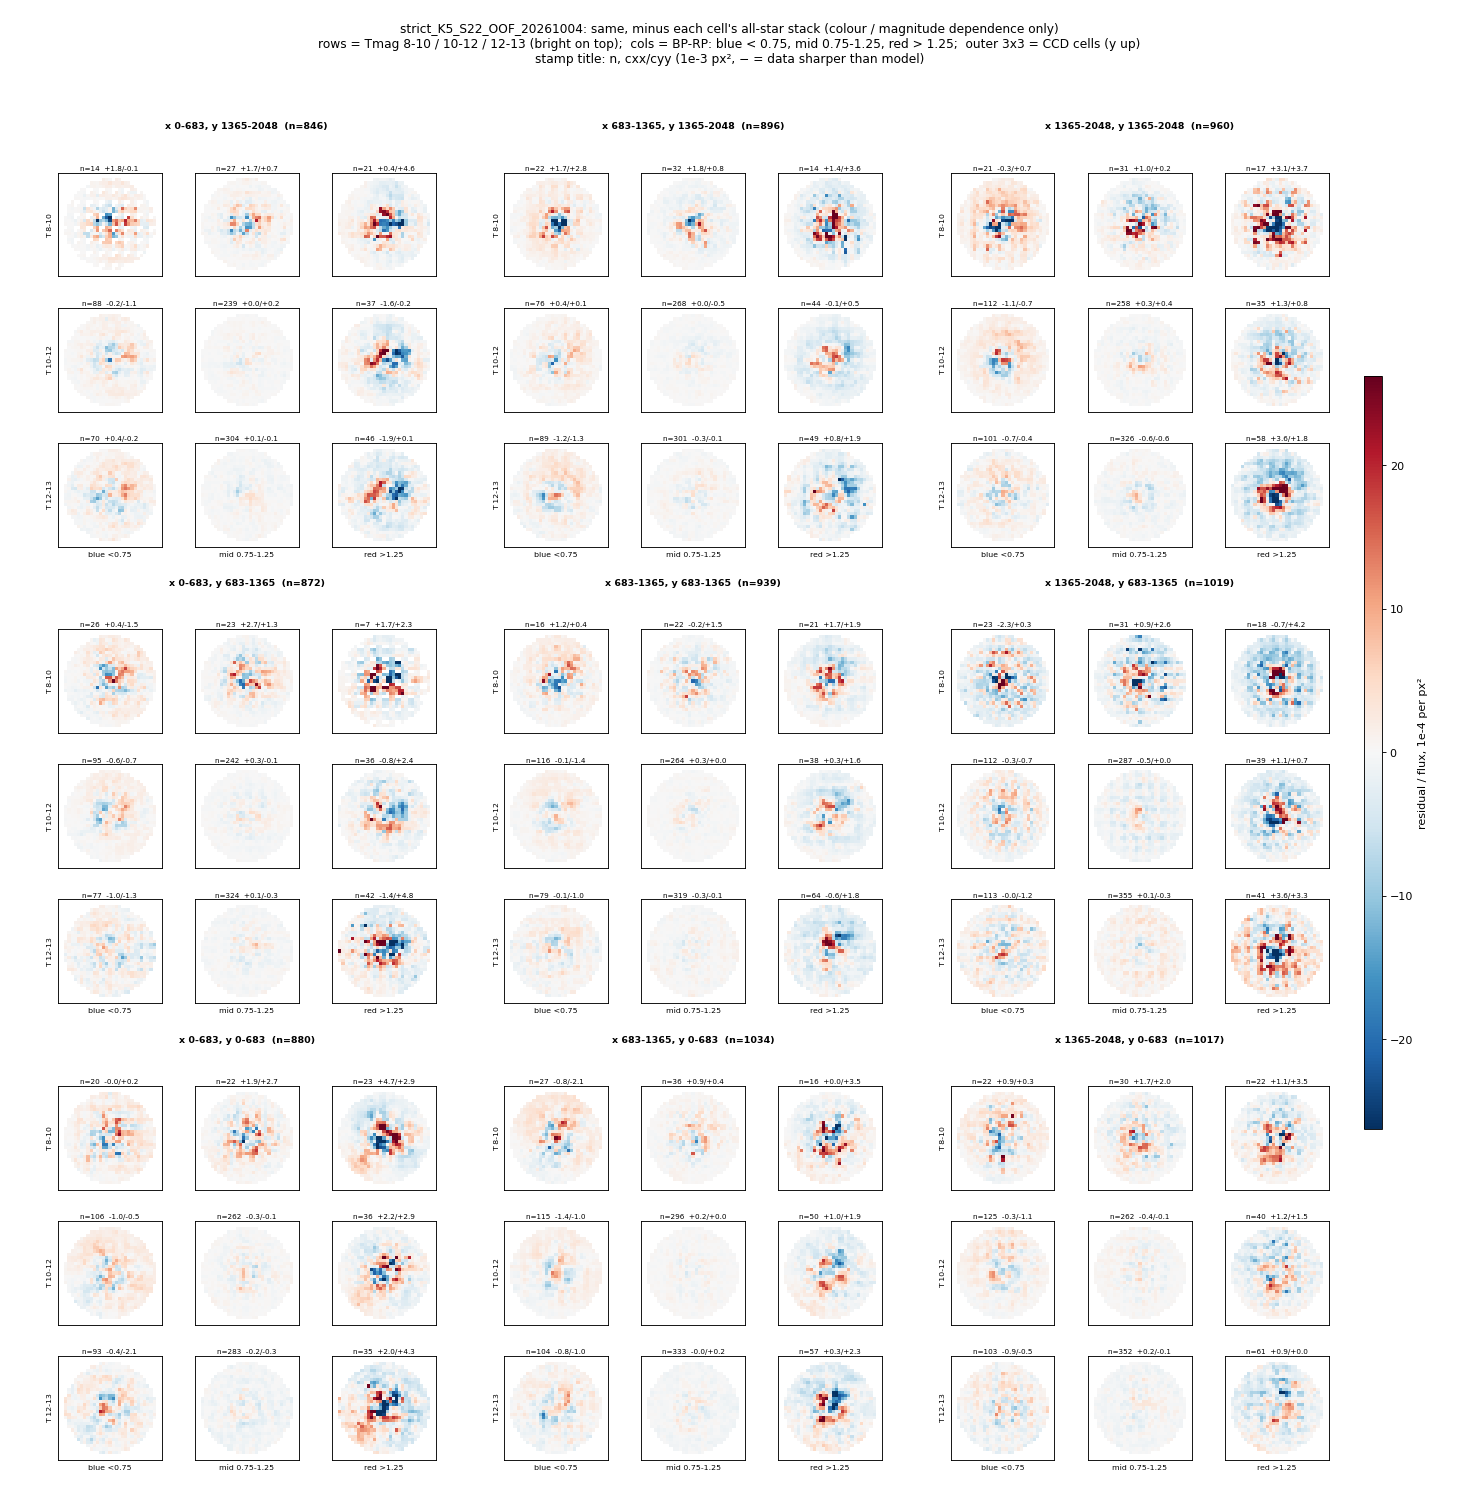
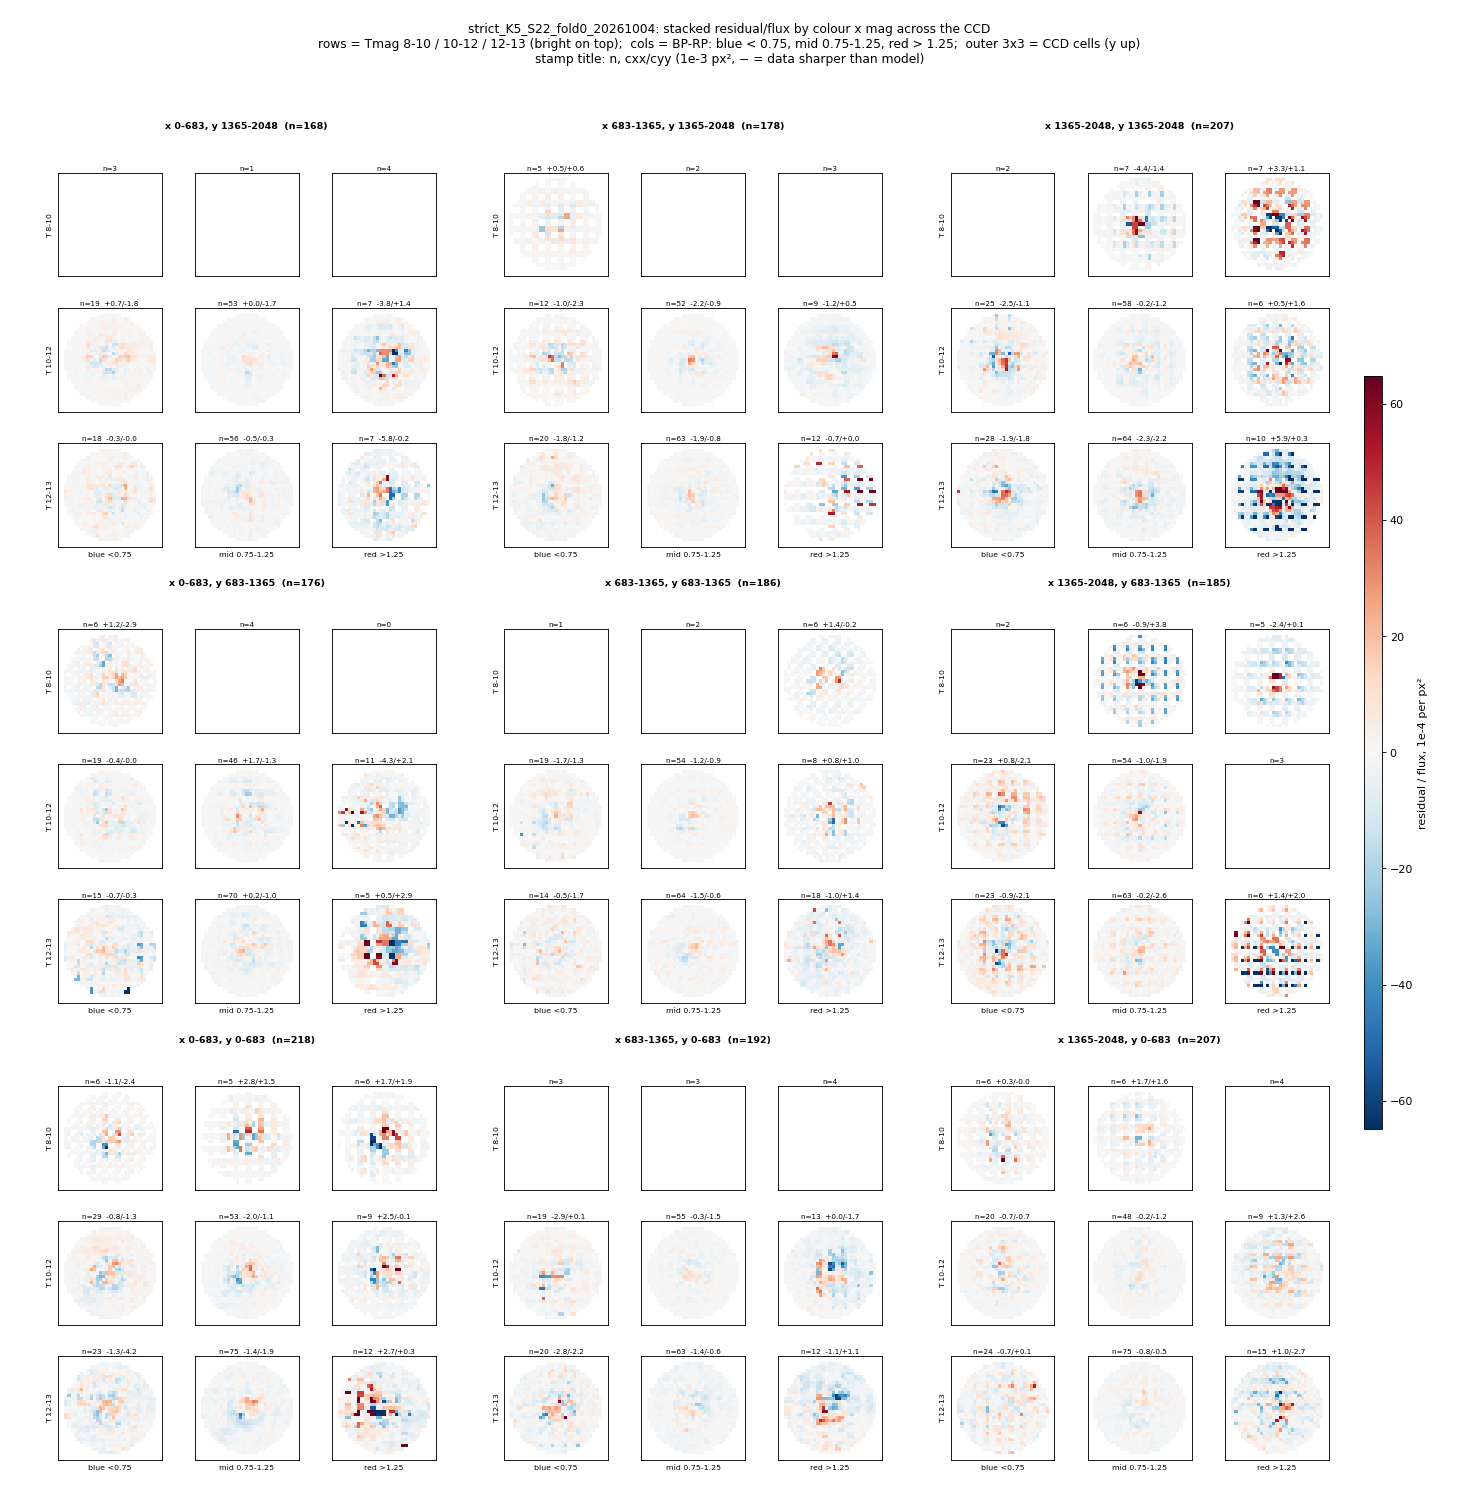
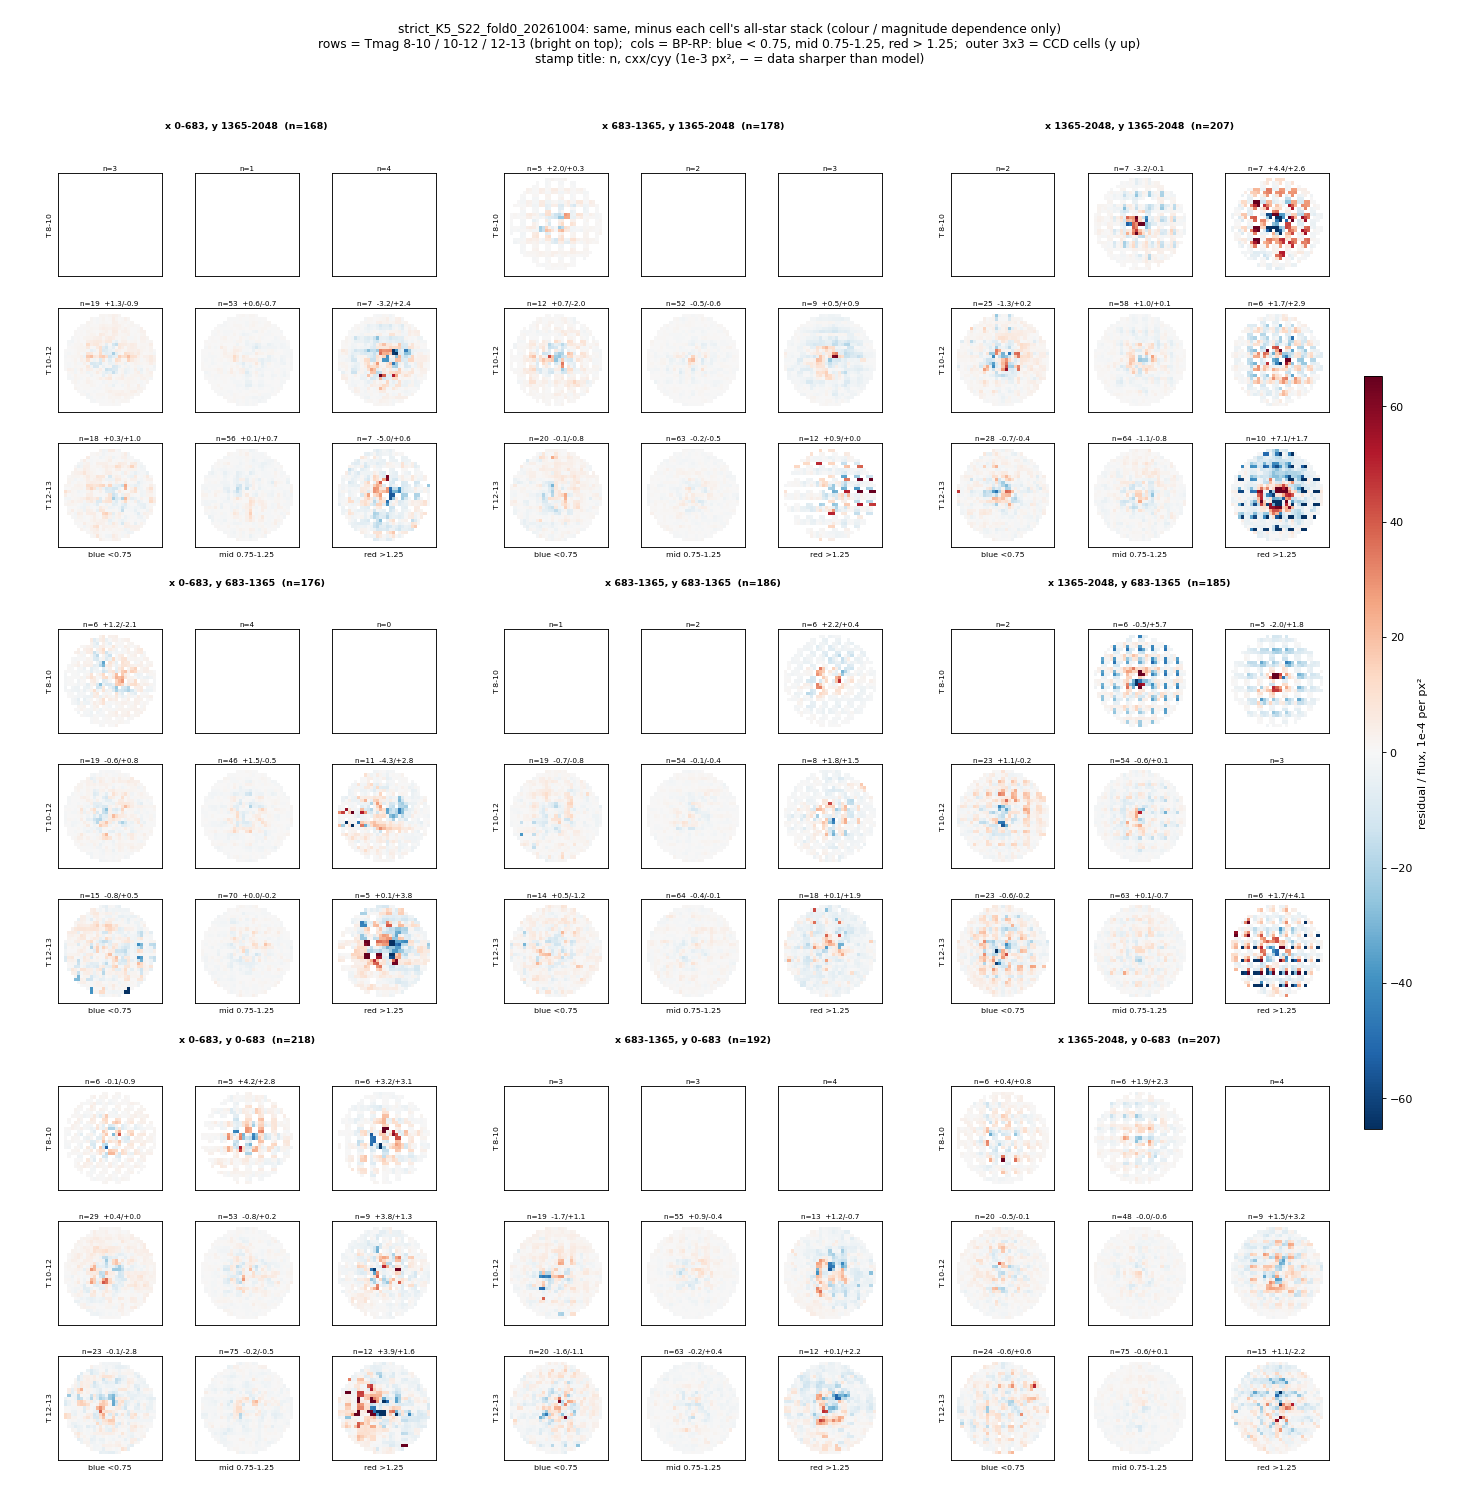
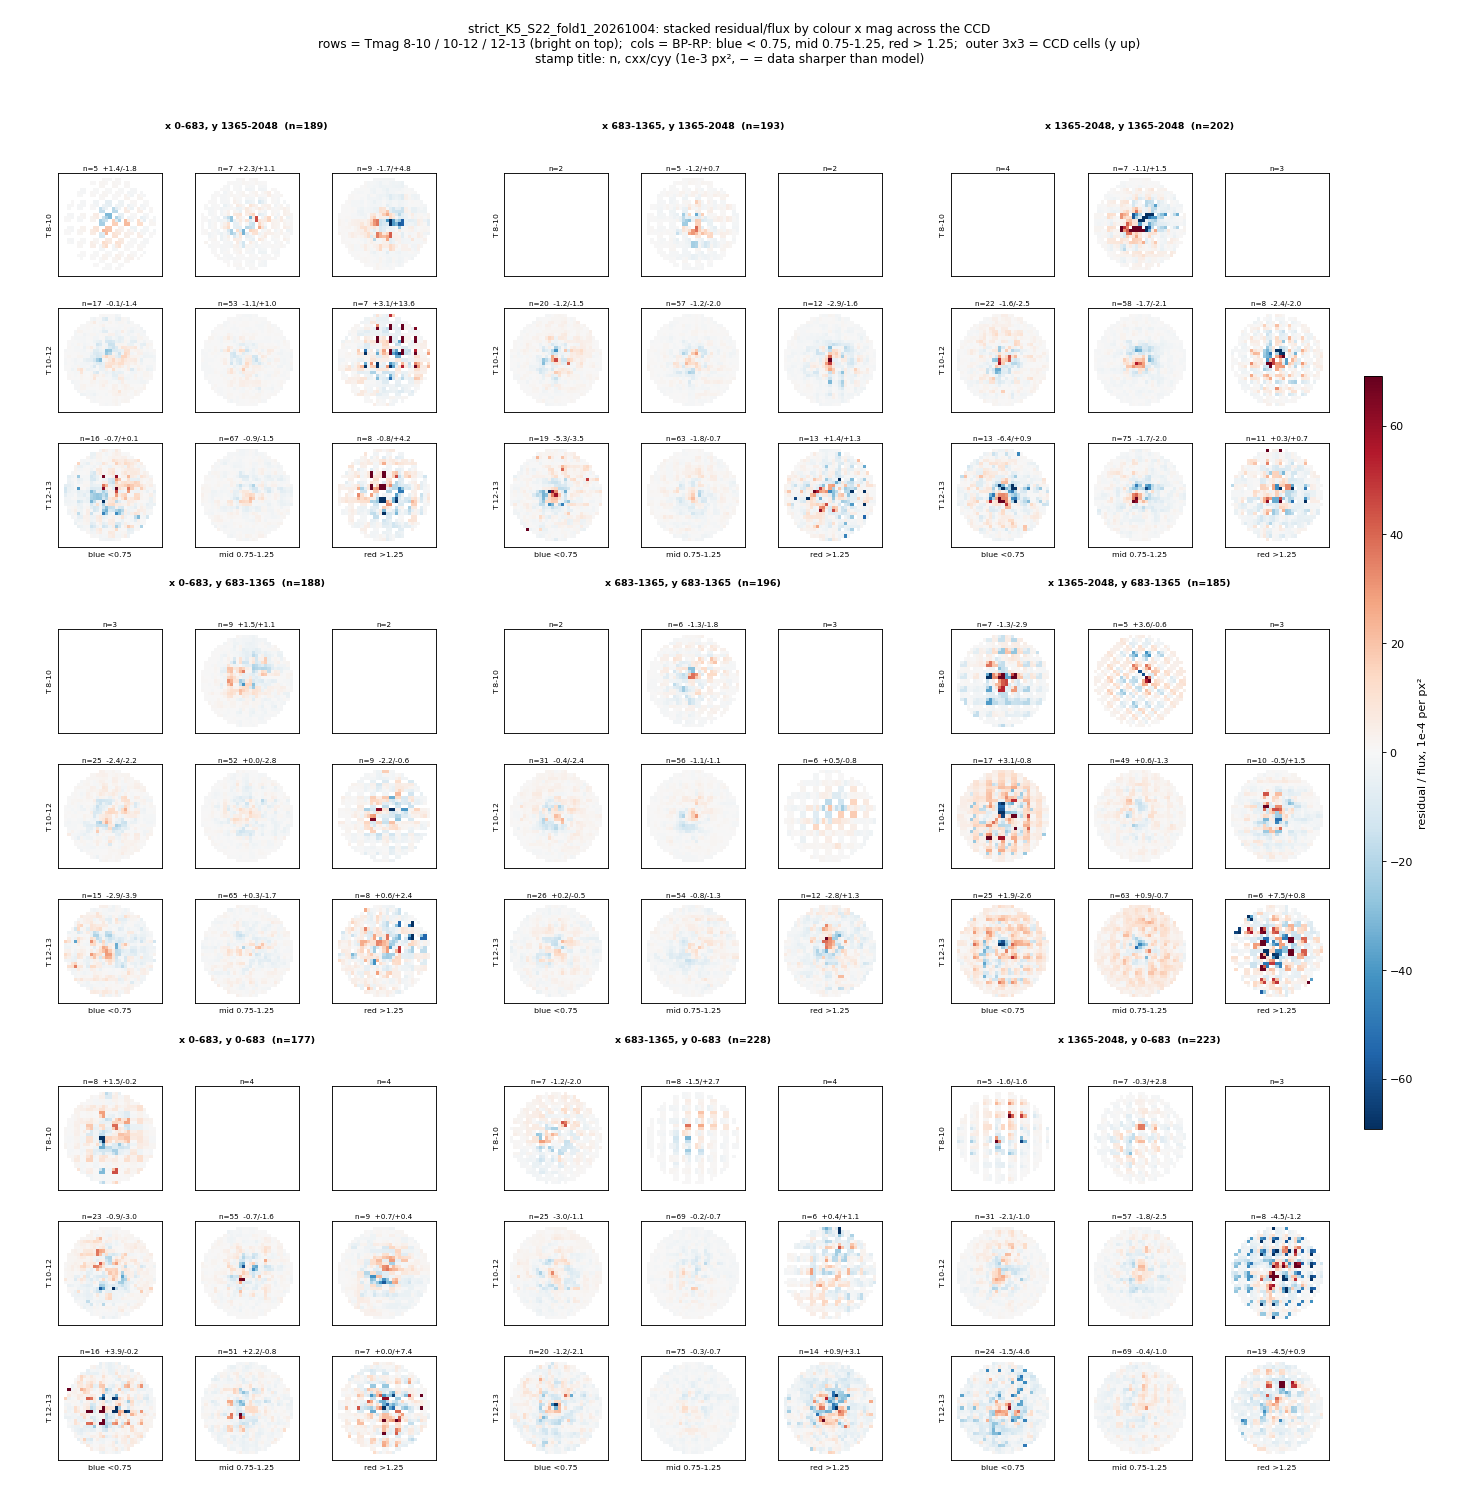
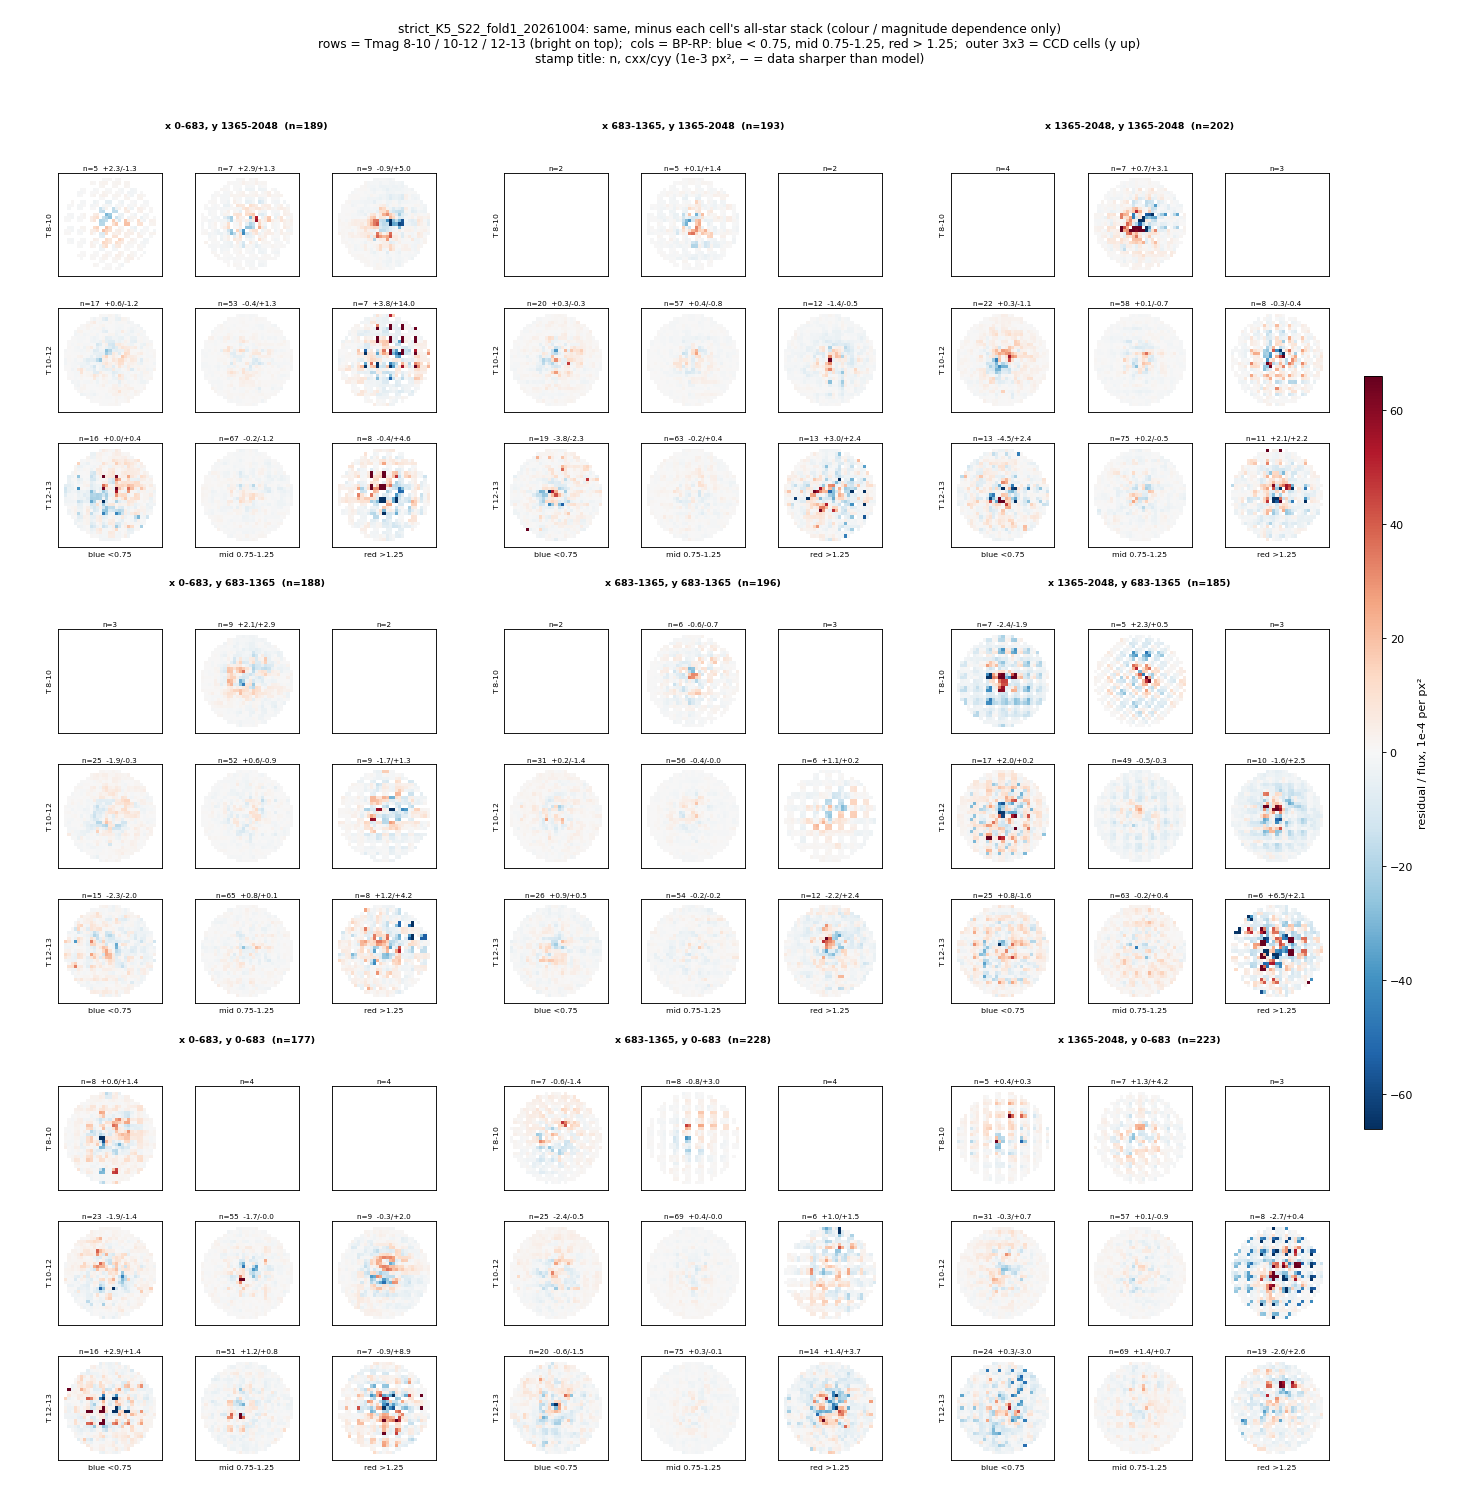
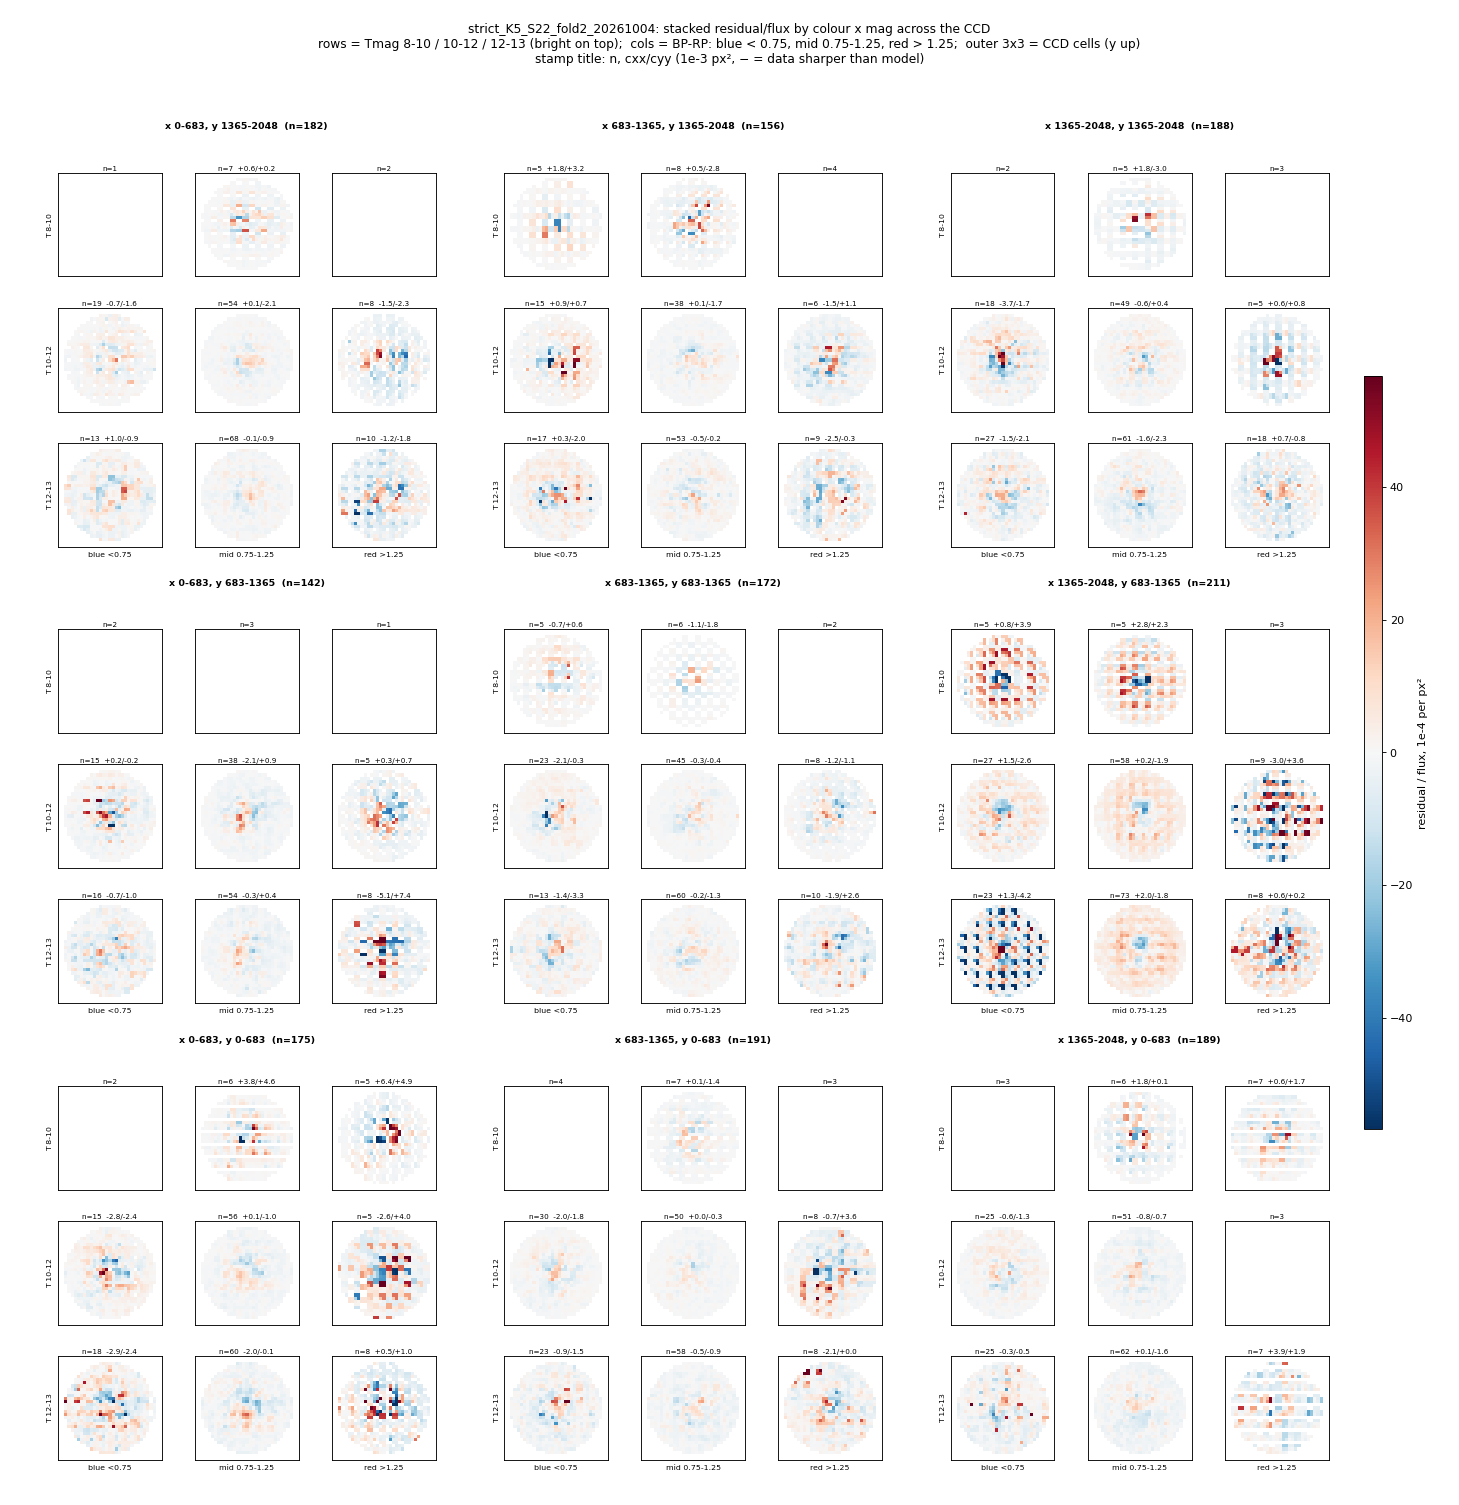
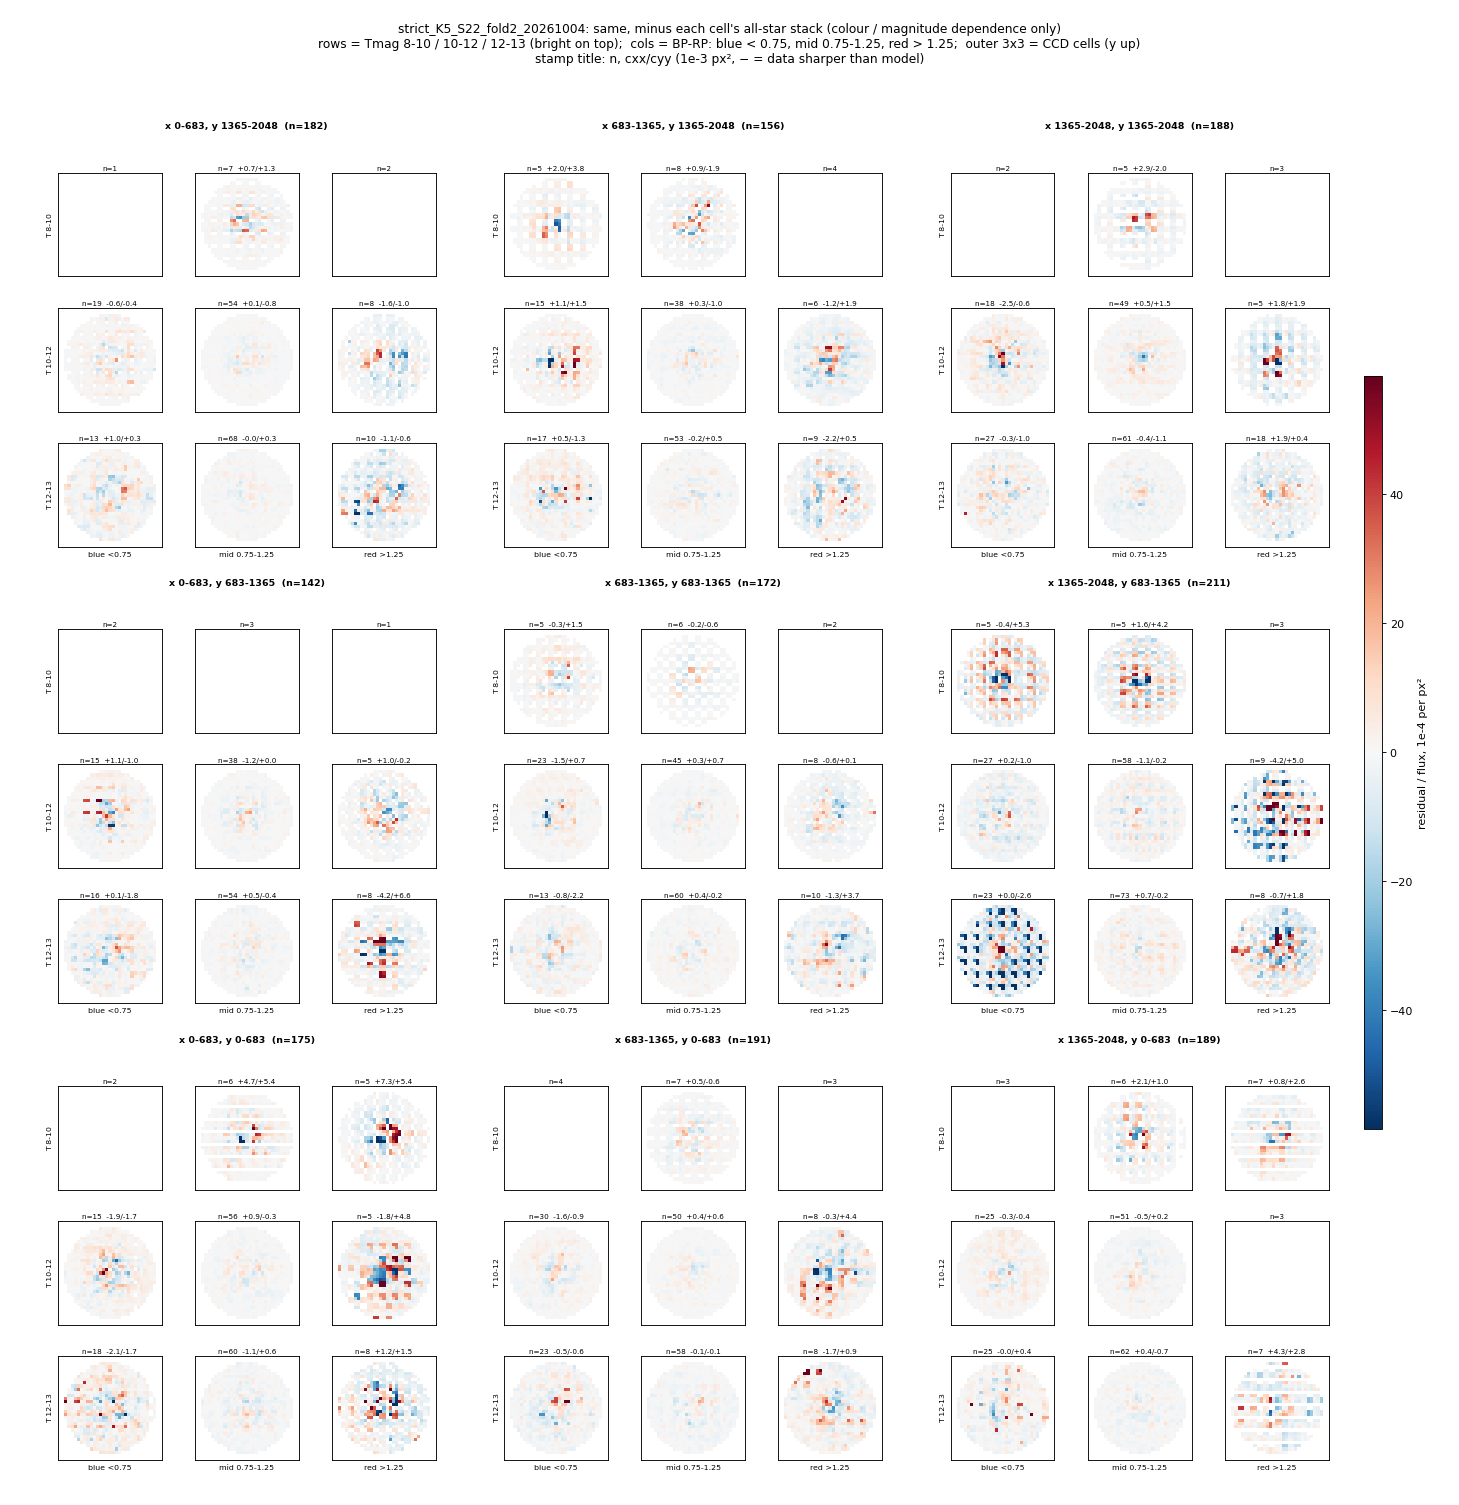
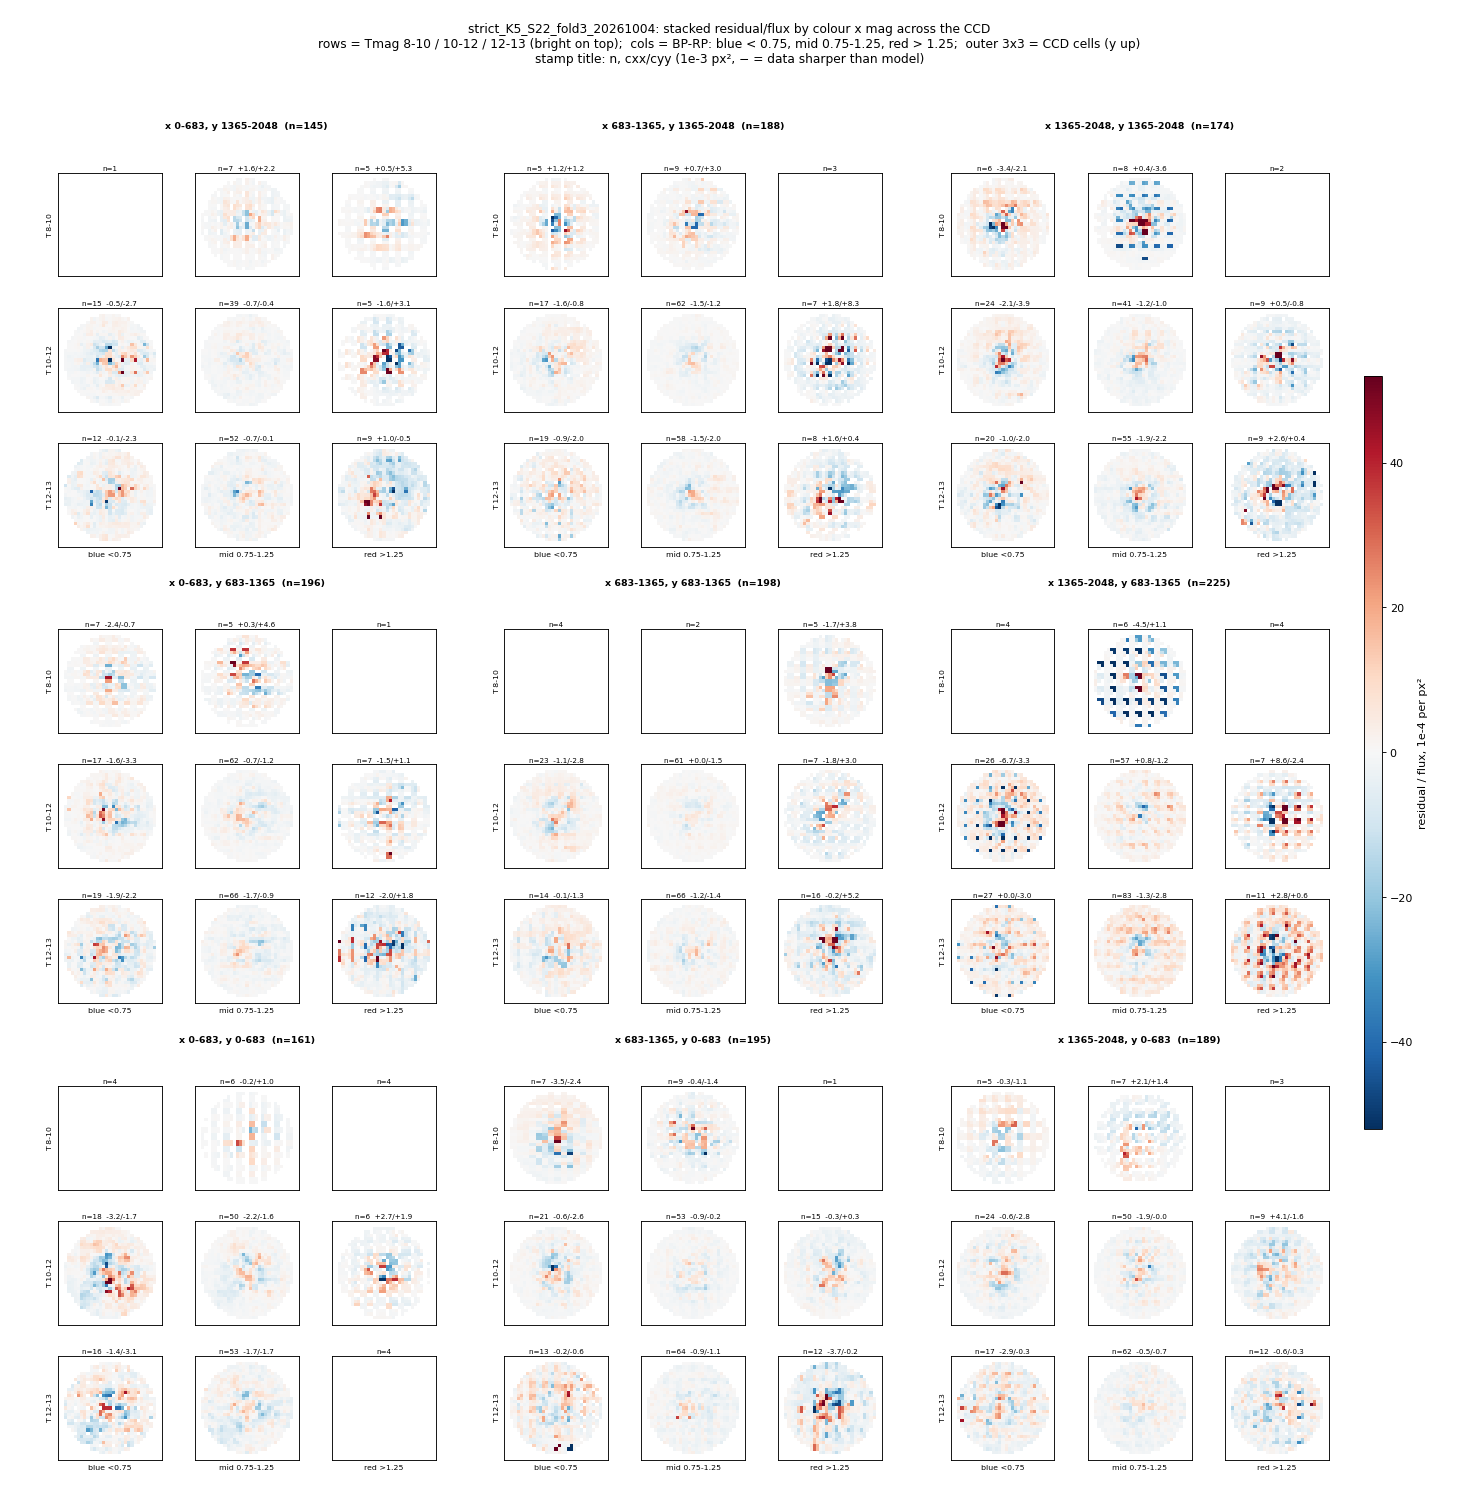
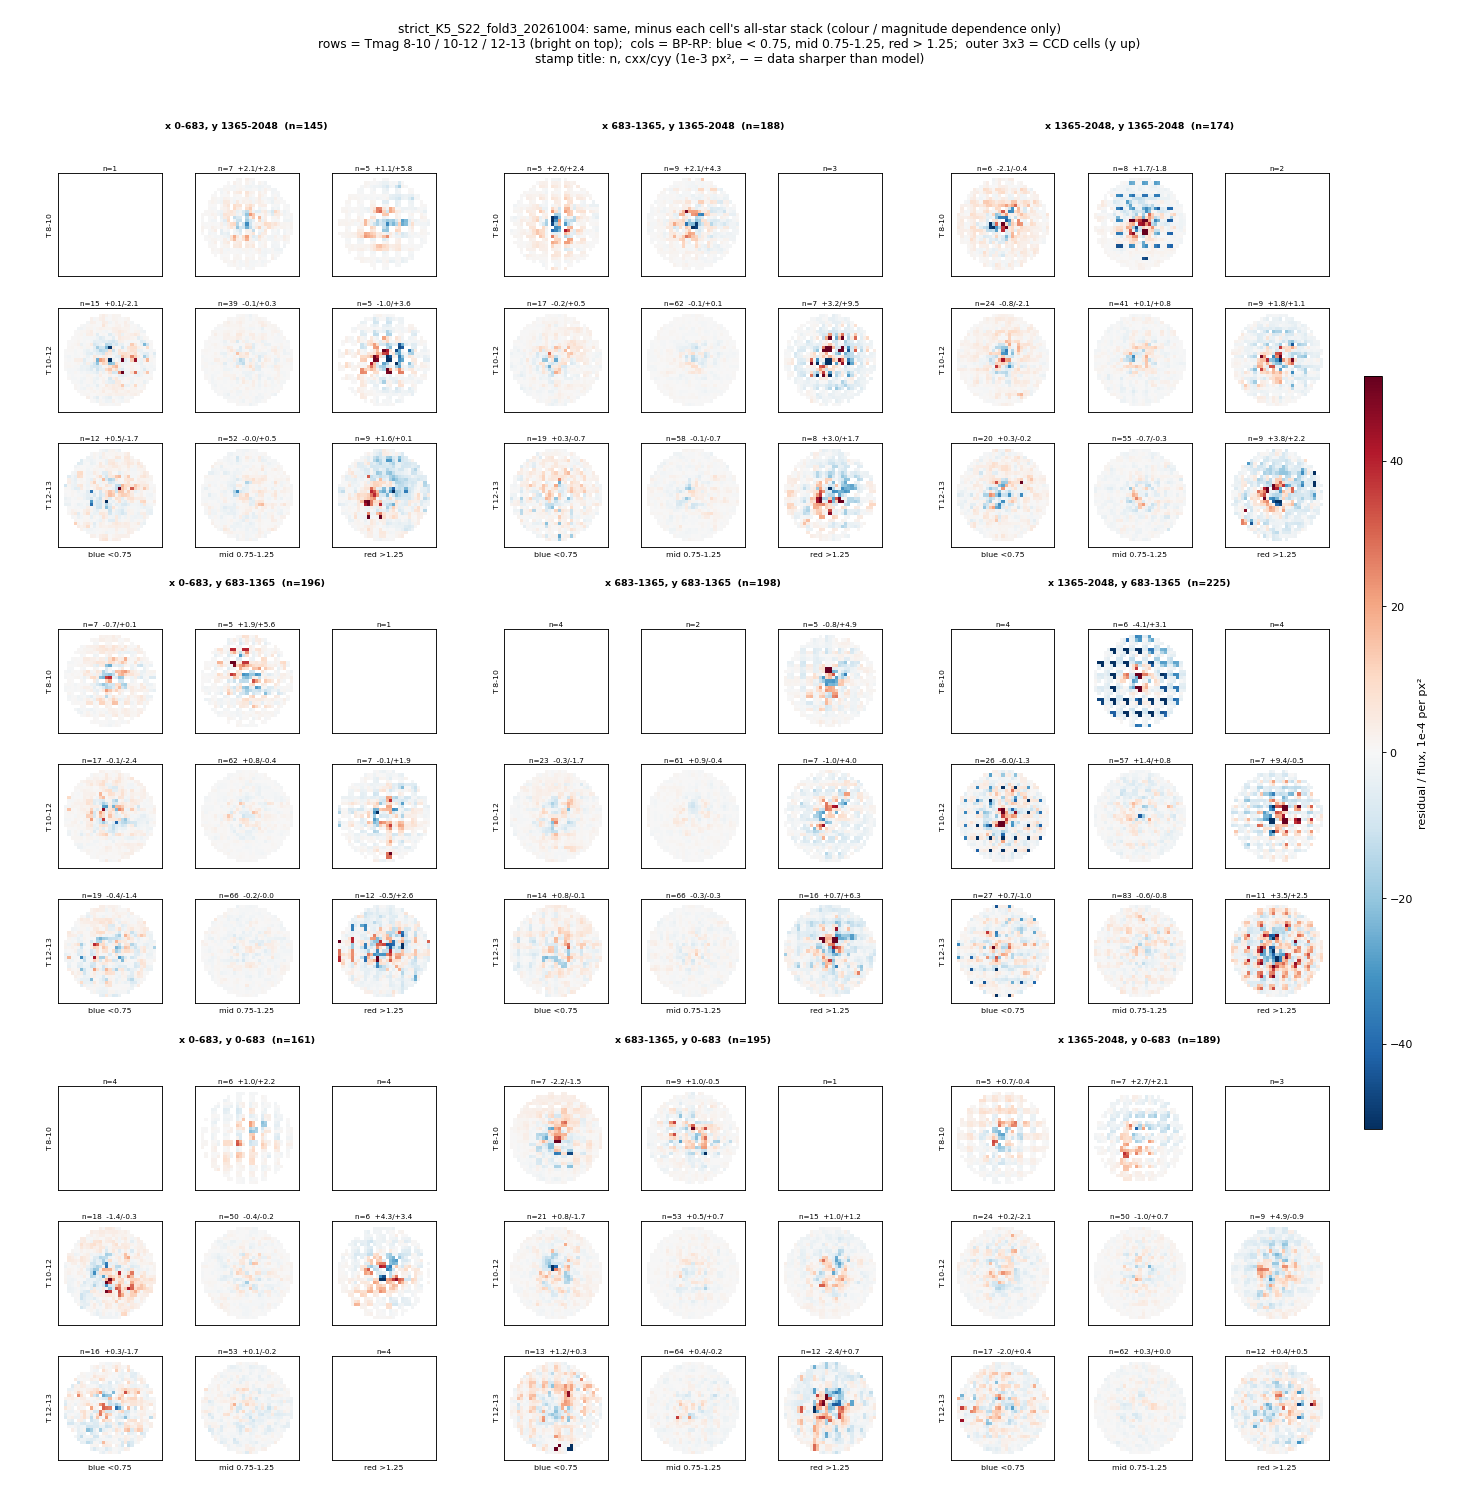
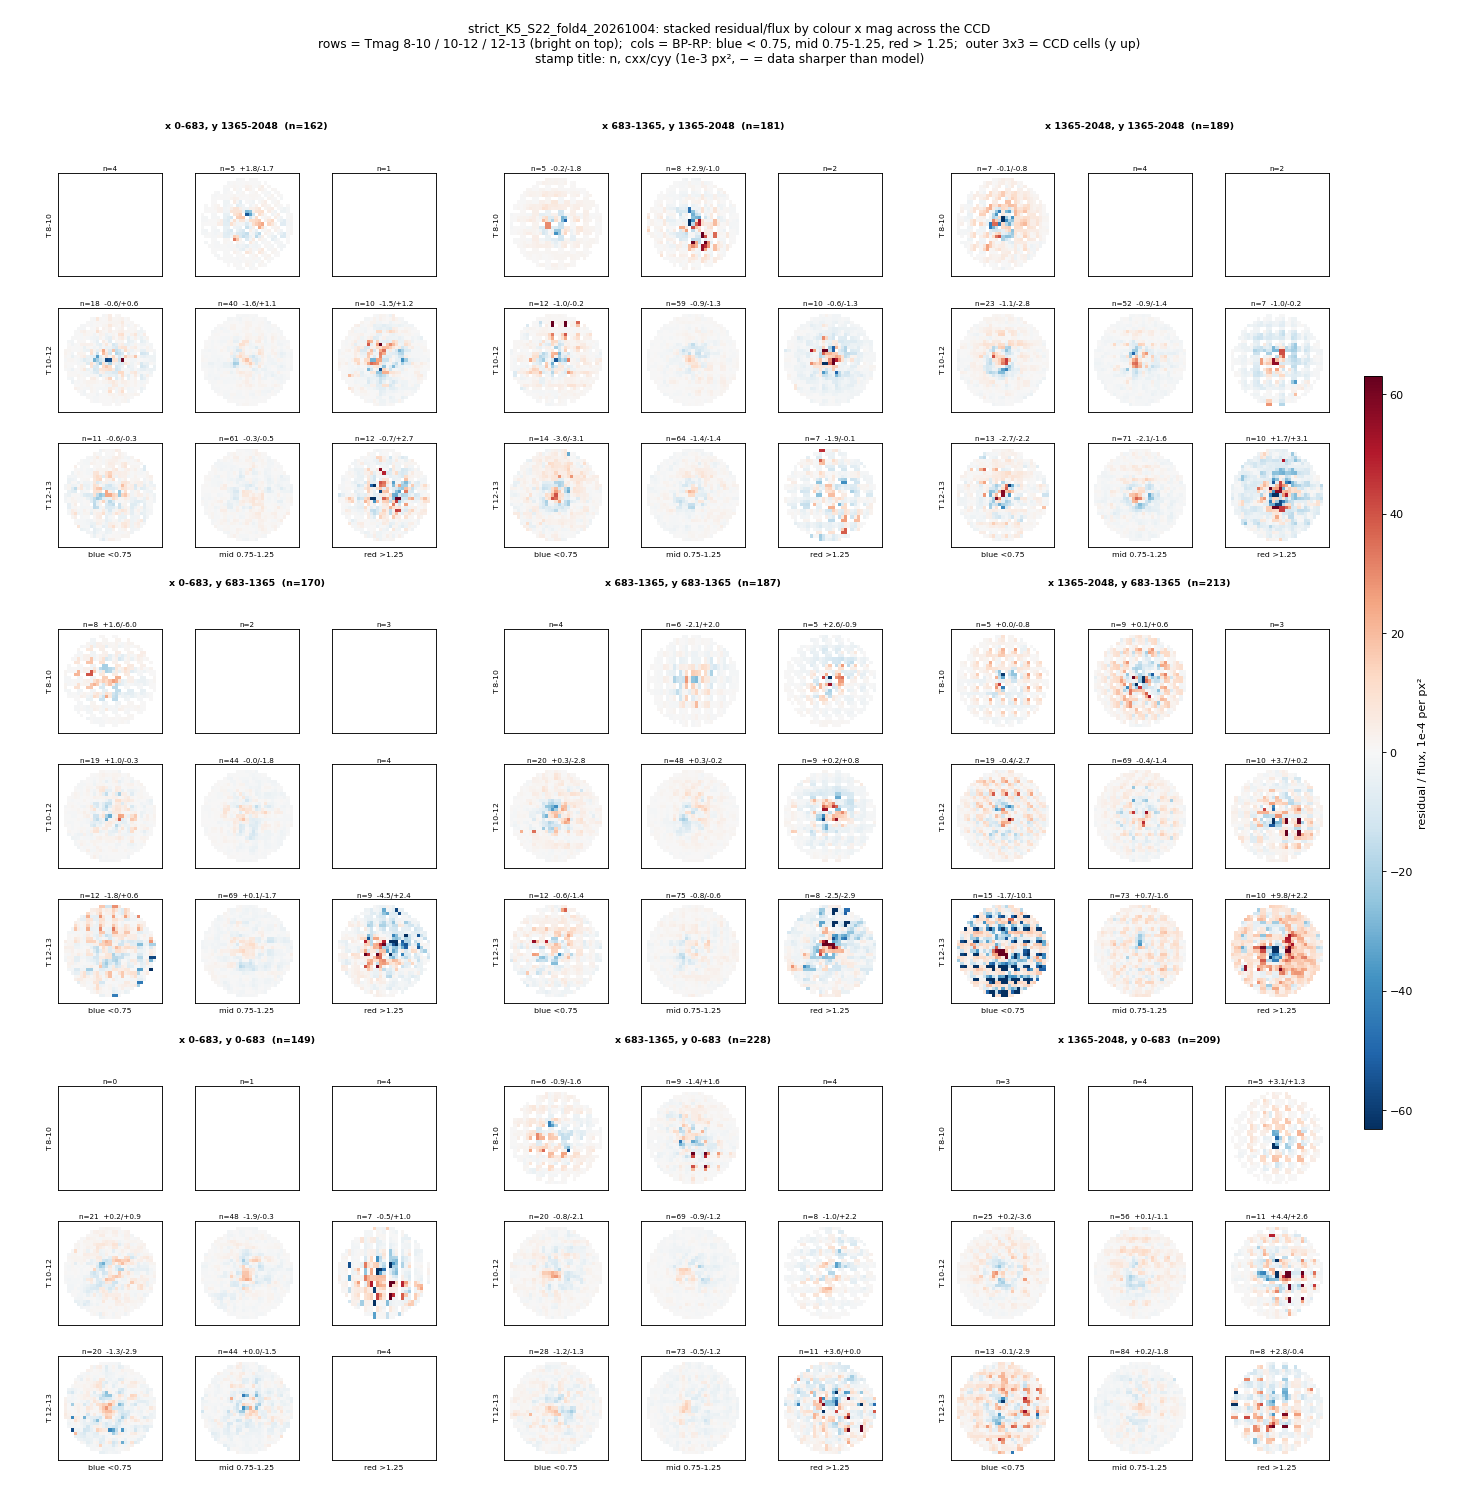
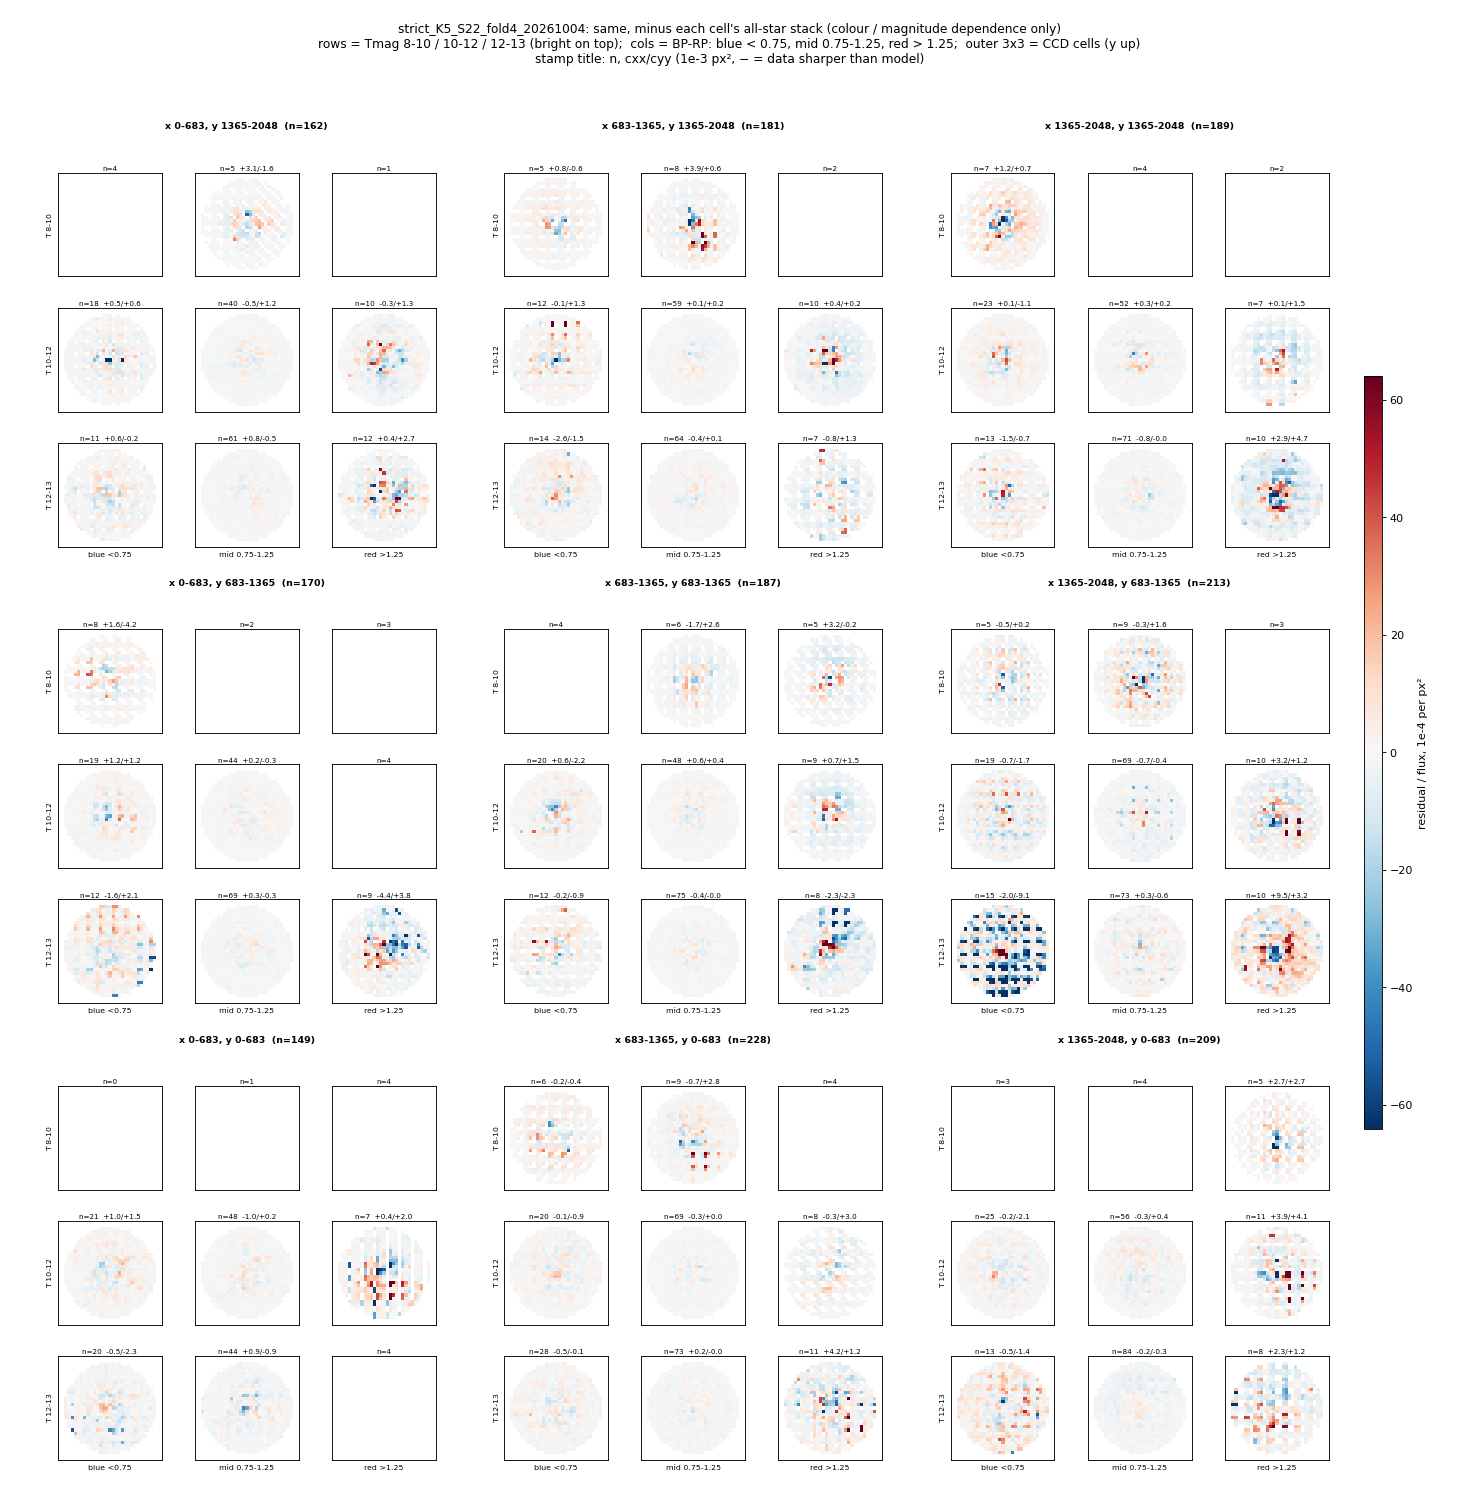
The pooled absolute grid has central positive faint blue/mid-colour residuals and red-bin asymmetric cores across the CCD; the lower-right red cell is especially structured. Relative subtraction suppresses much of the mid-colour common component. Single-fold red bins and bright cells are often sparsely sampled, with striped patterns or missing images.
Display bins: Gaia BP−RP and fitted-flux-derived TESS magnitude, not catalogue T / fitted XP u. The relative grid subtracts each cell’s all-star stack. Colour limits vary between images; sparse or blank bins are not null detections.
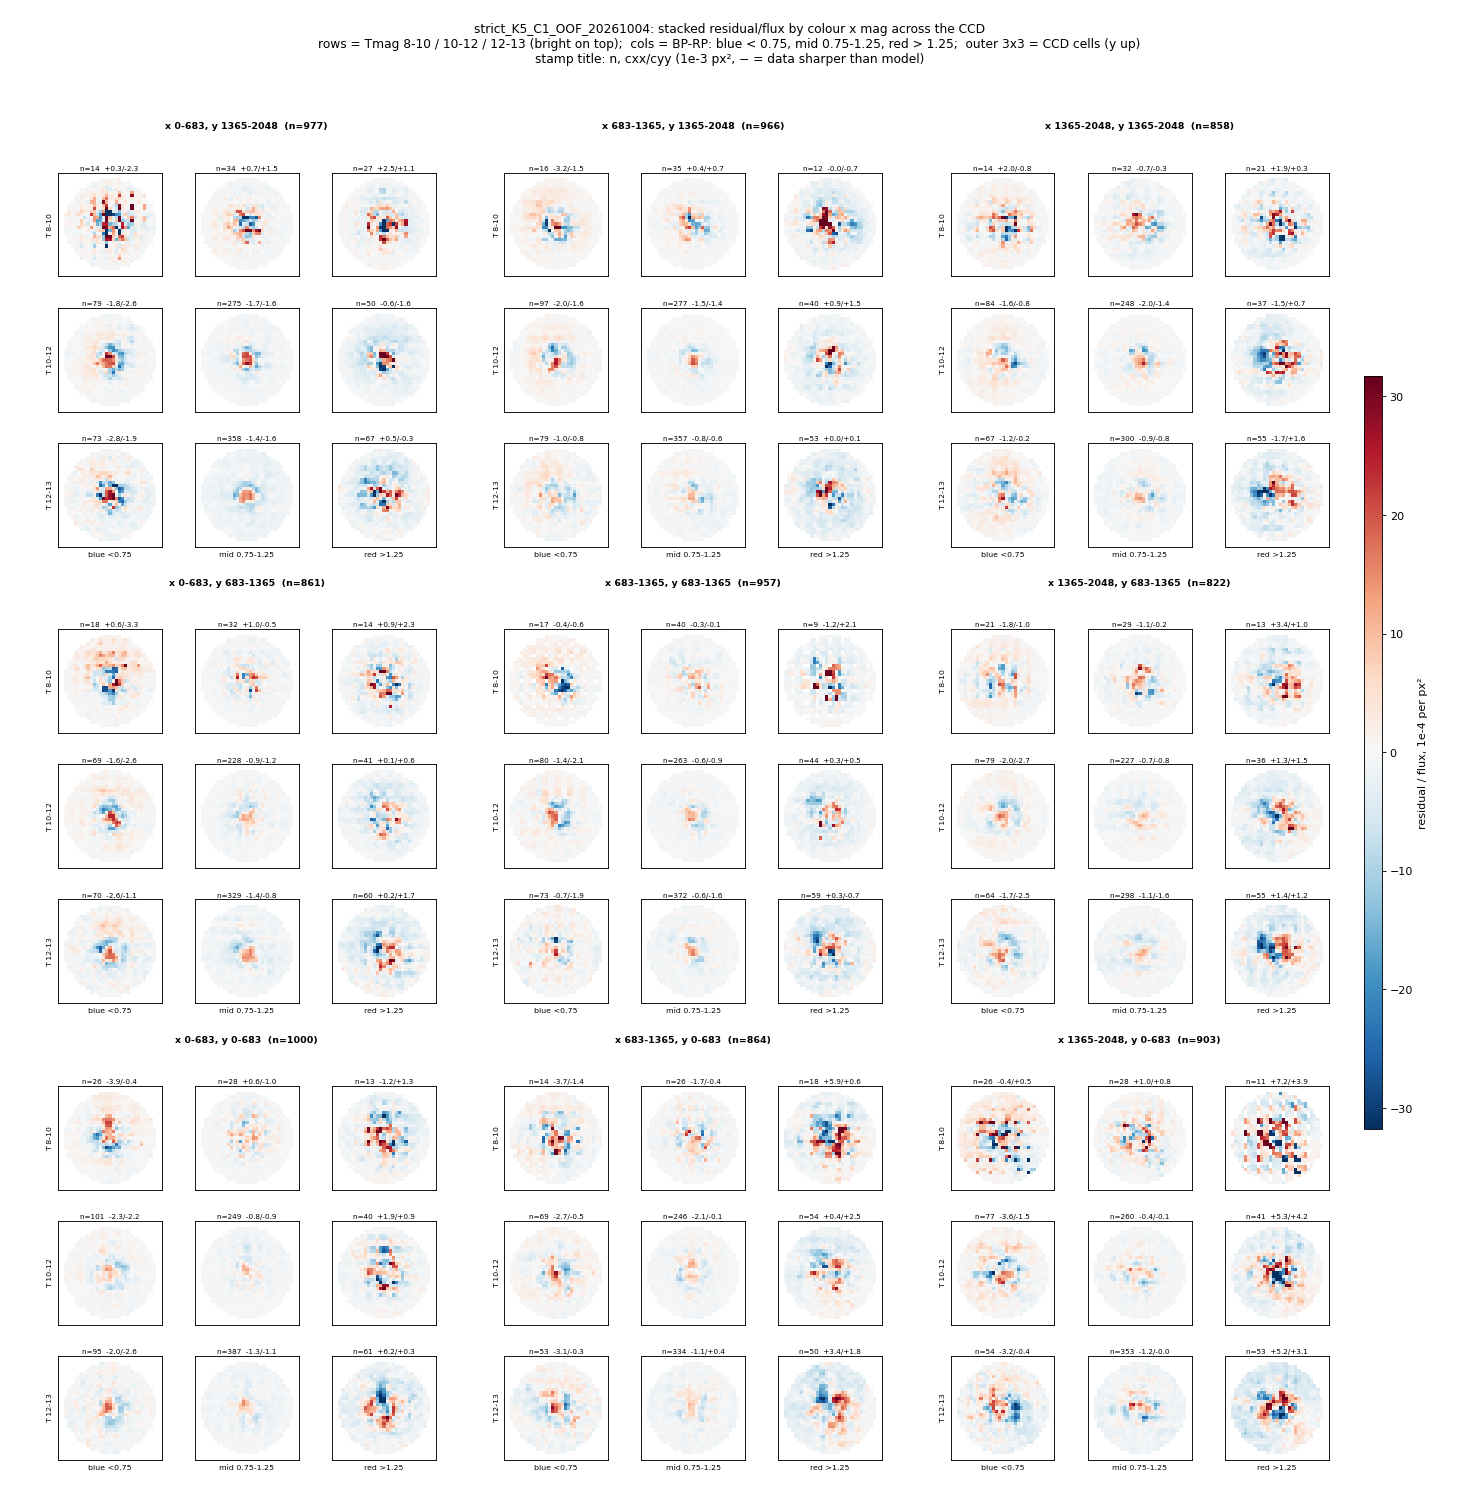
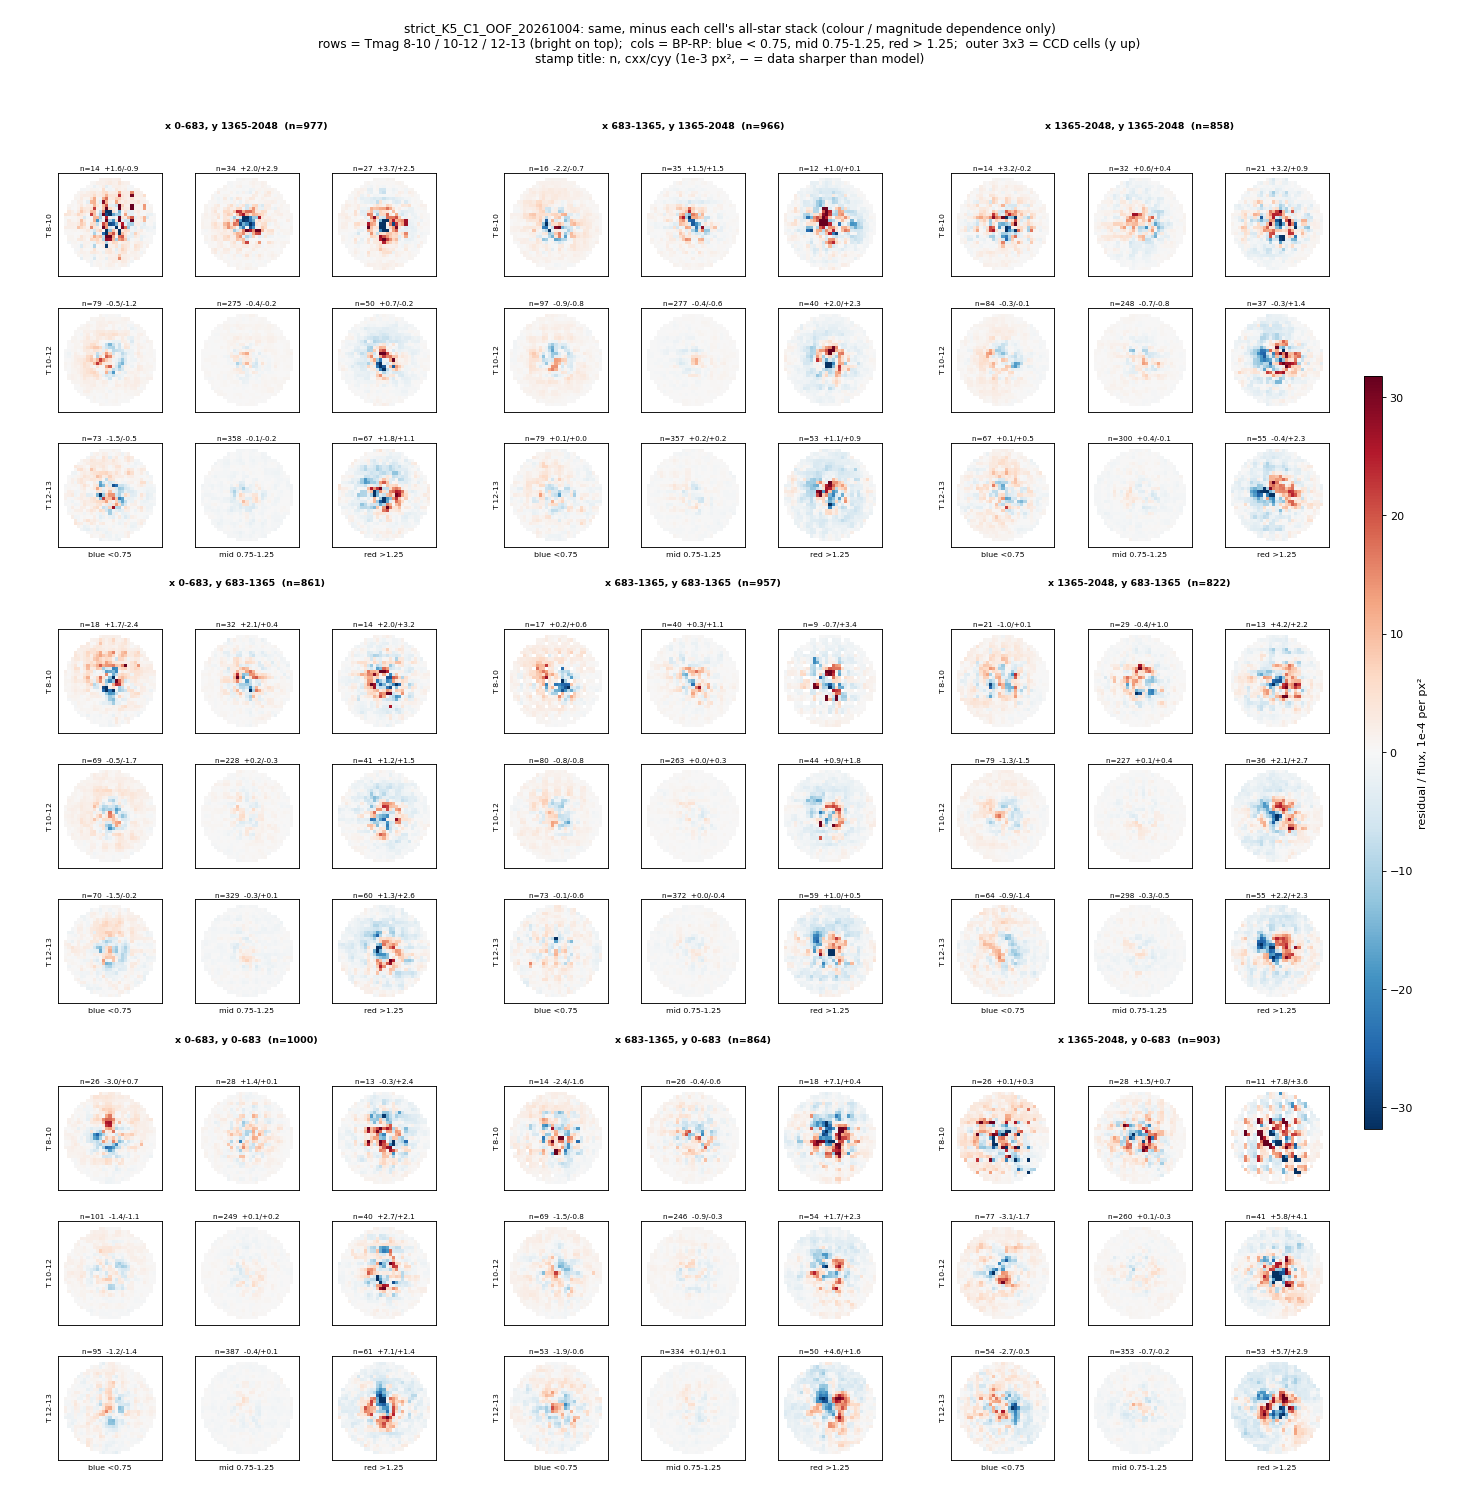
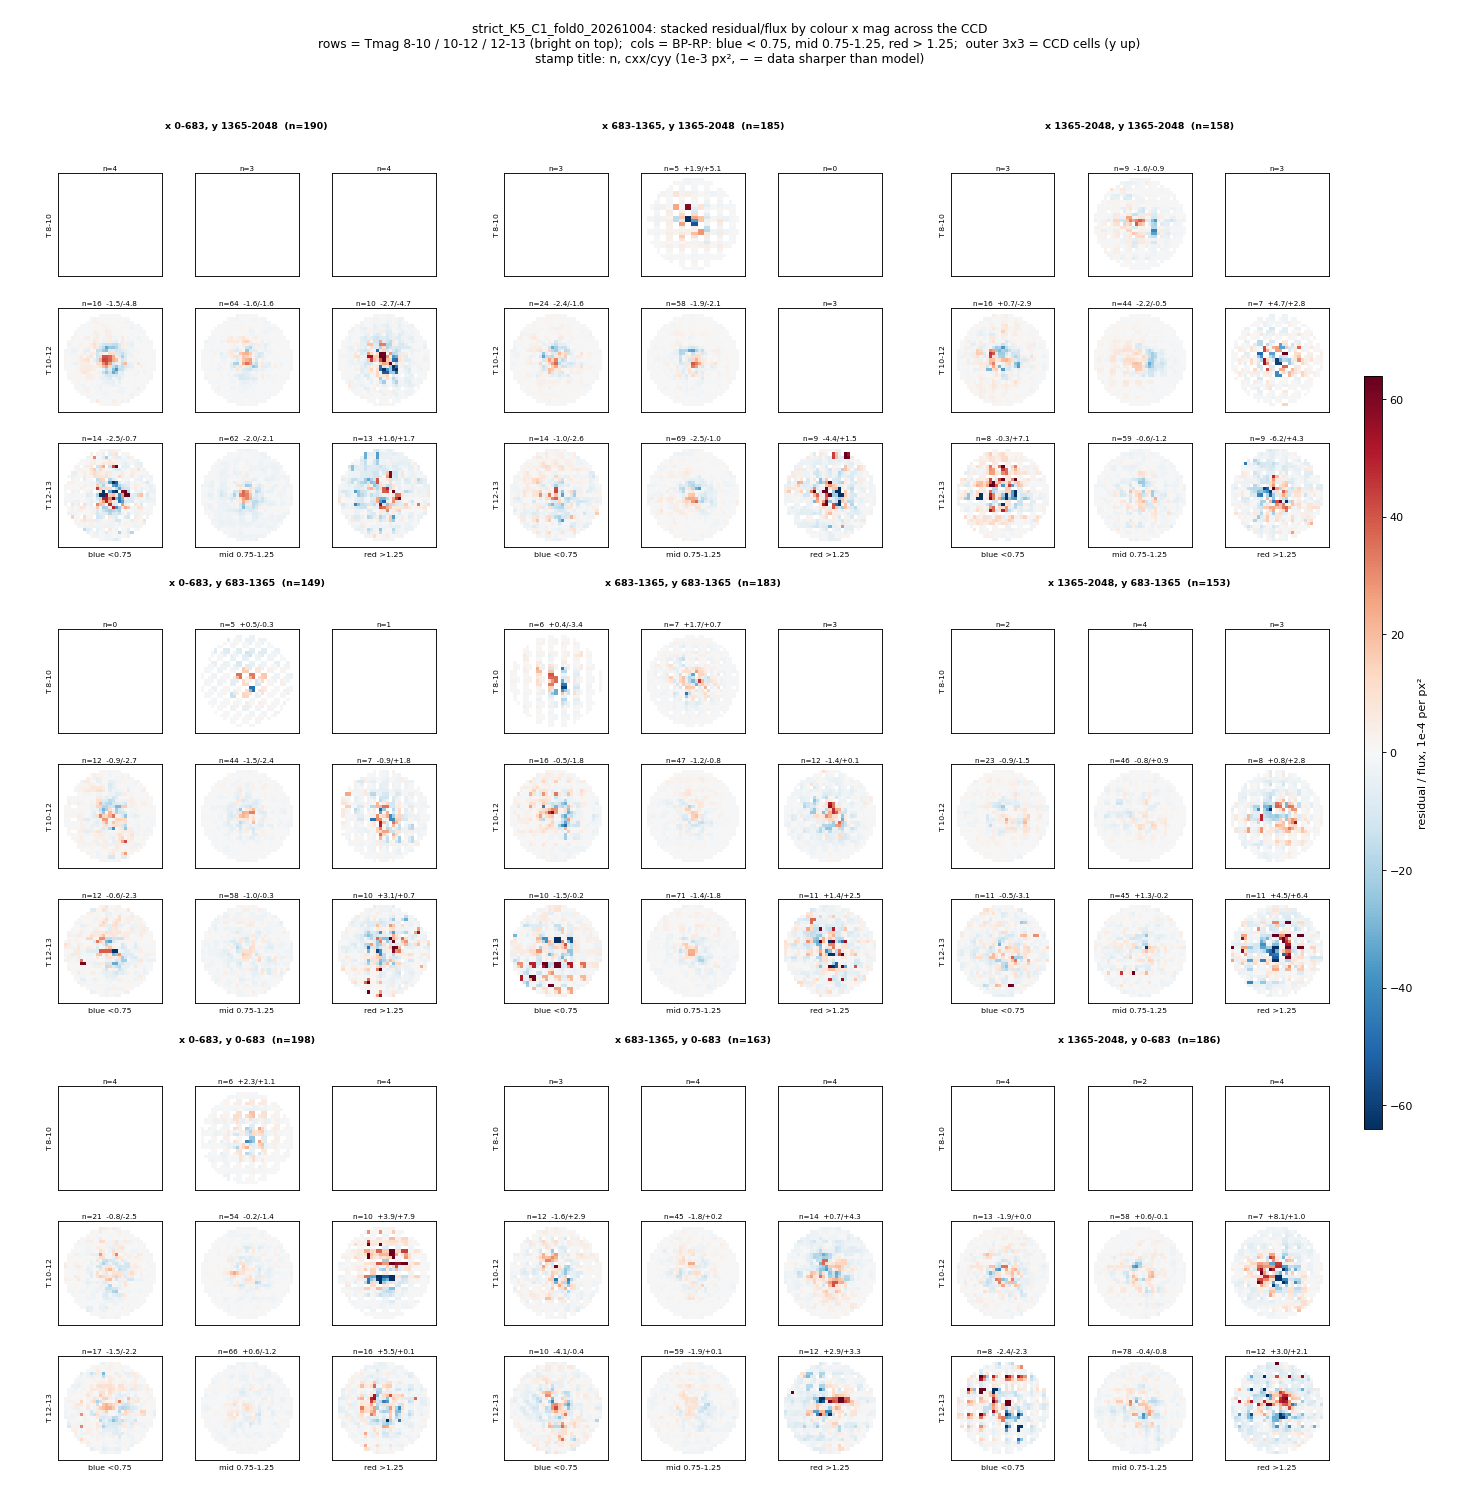
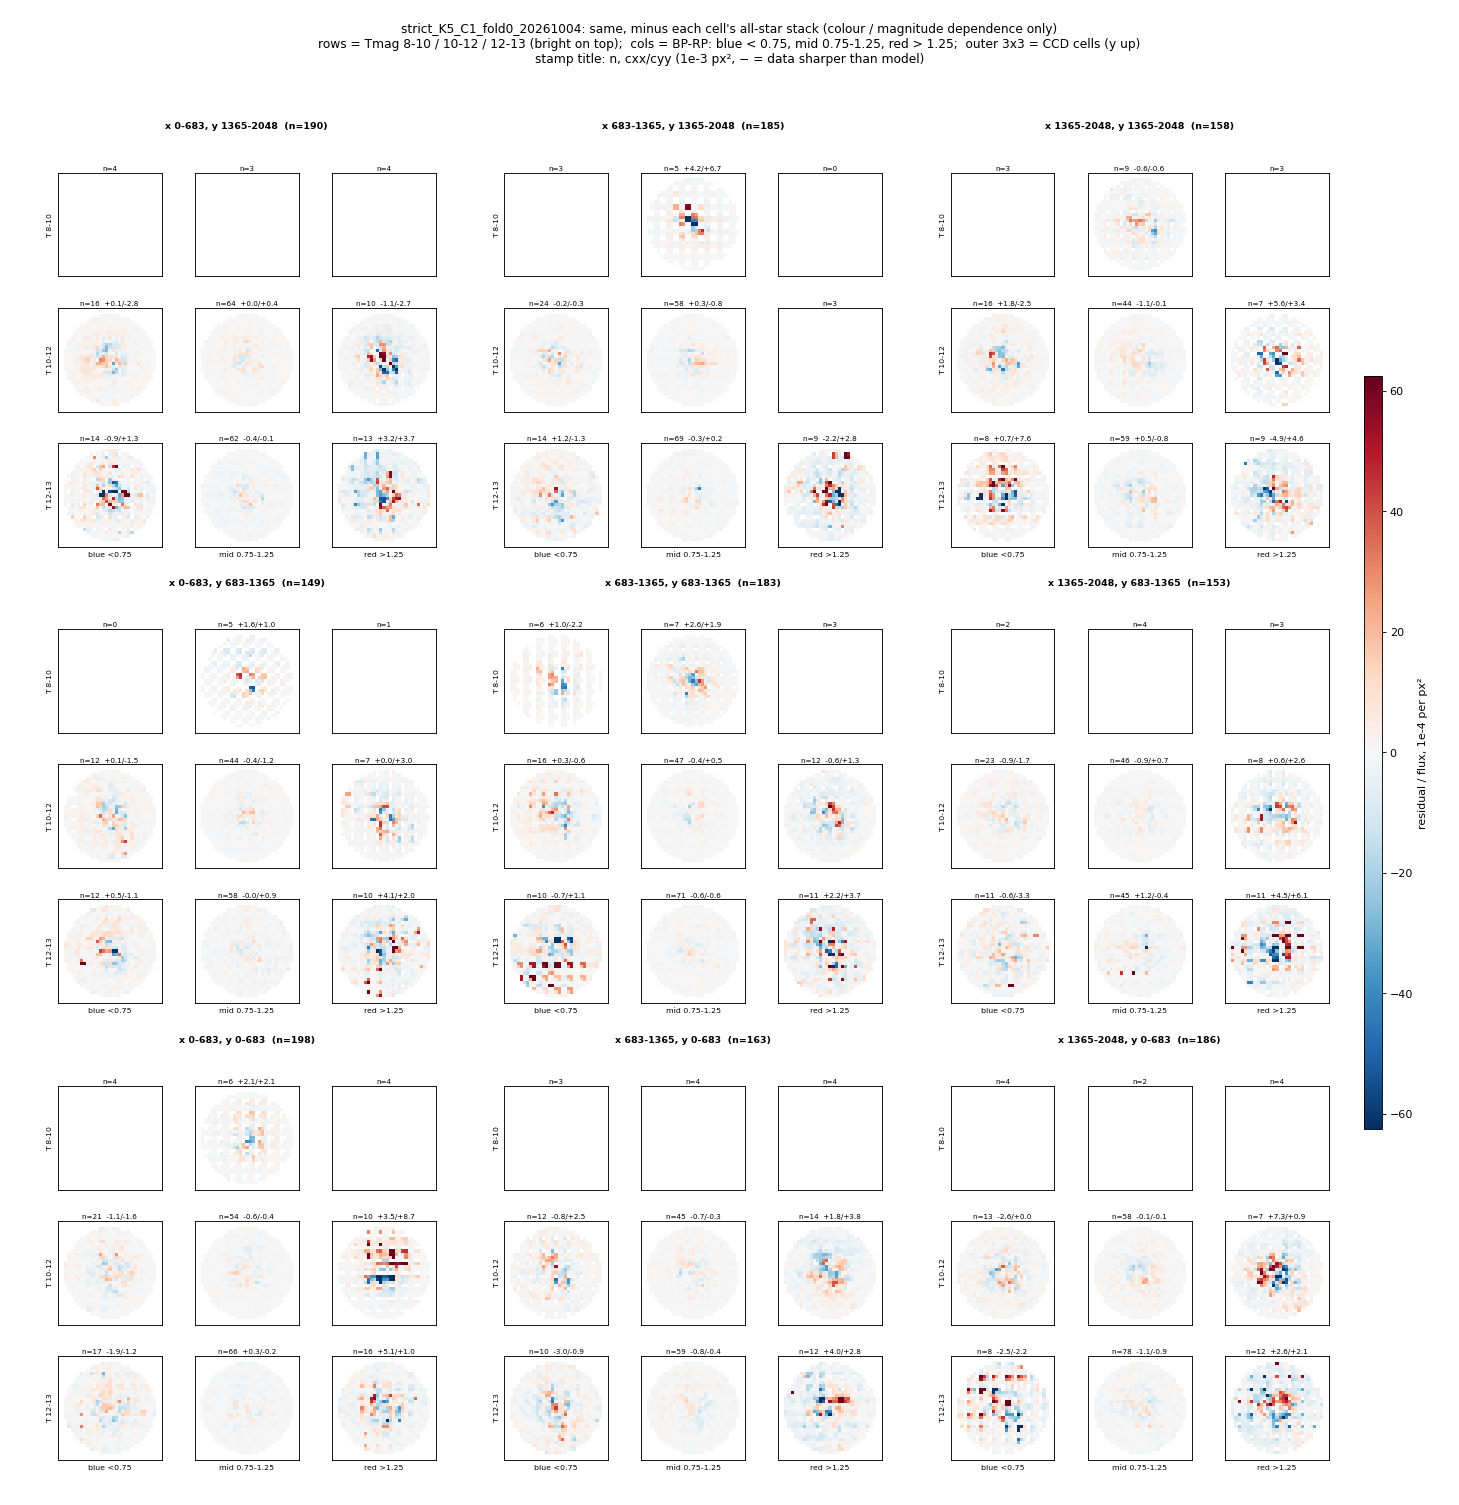
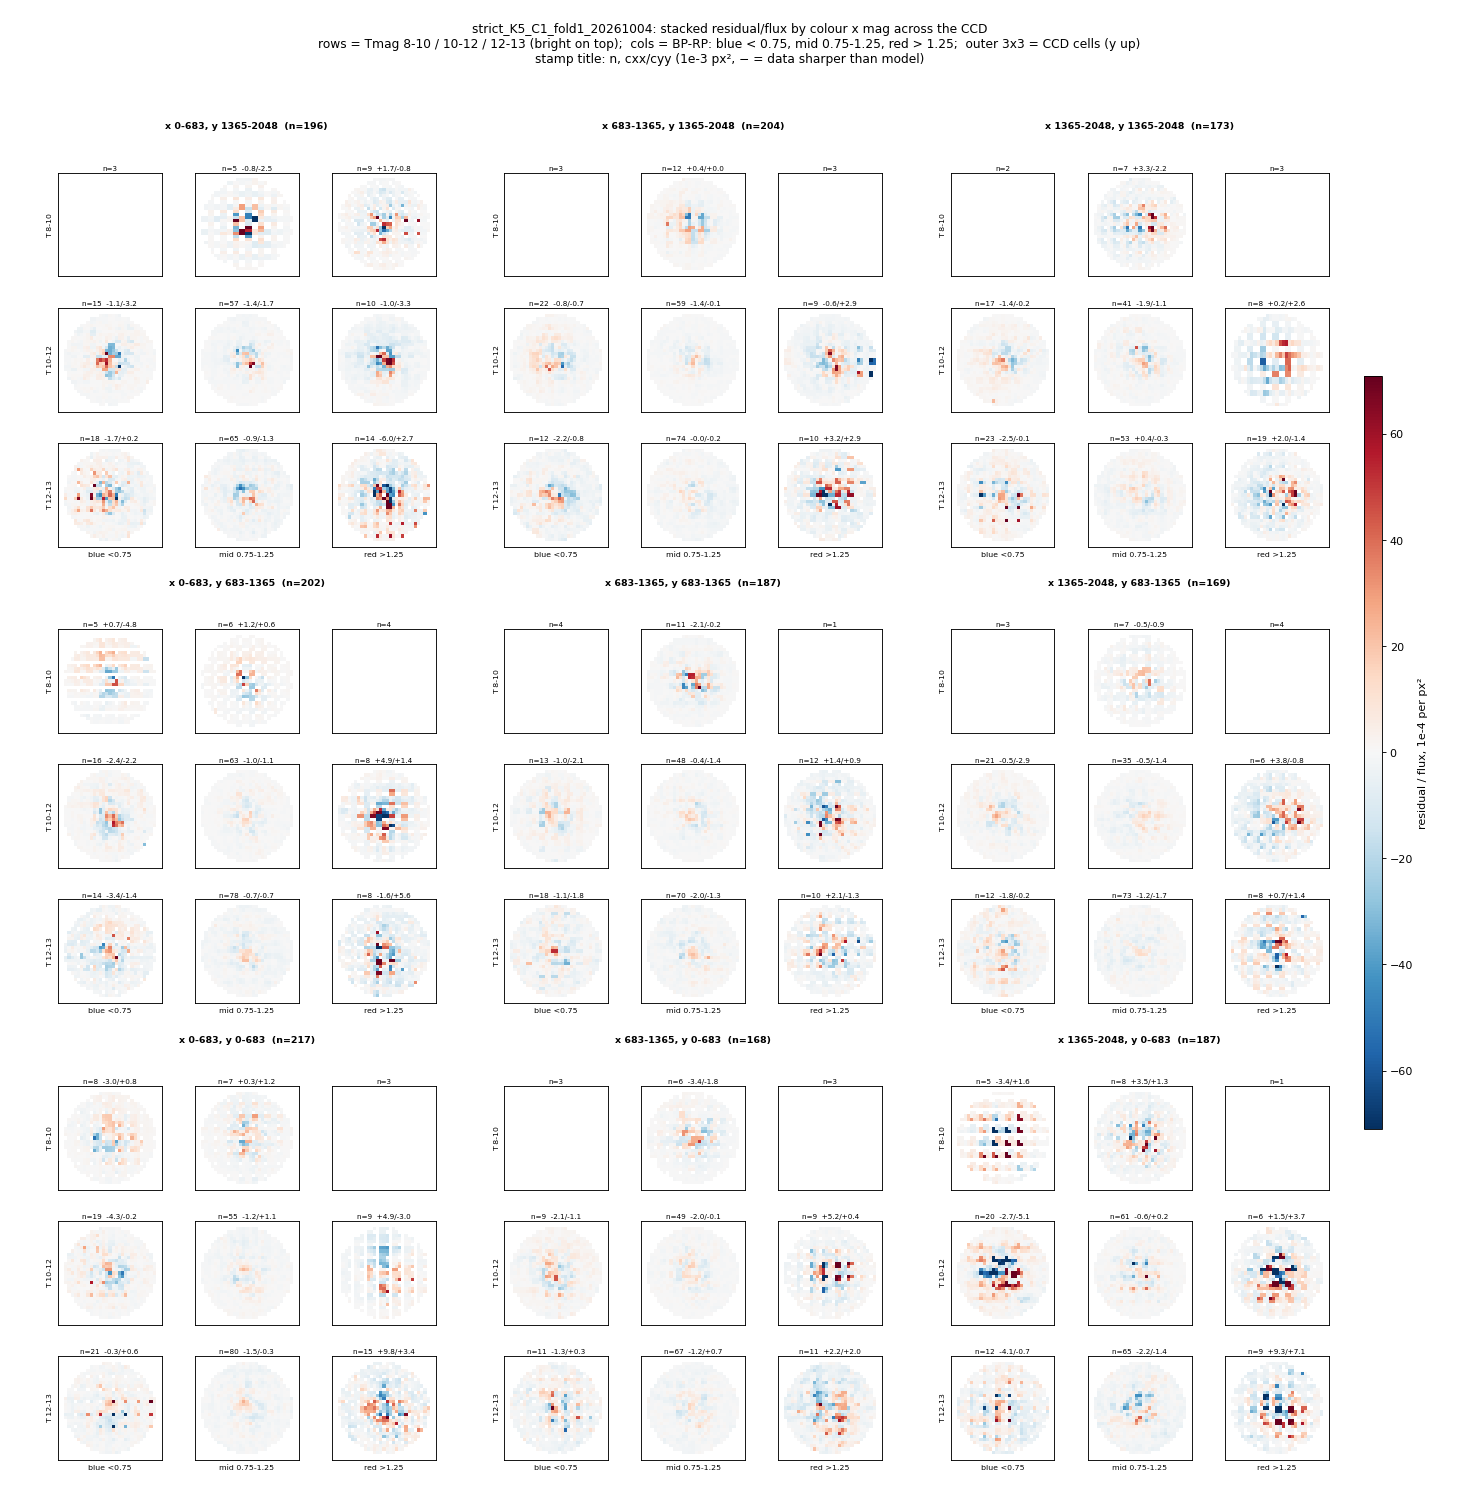
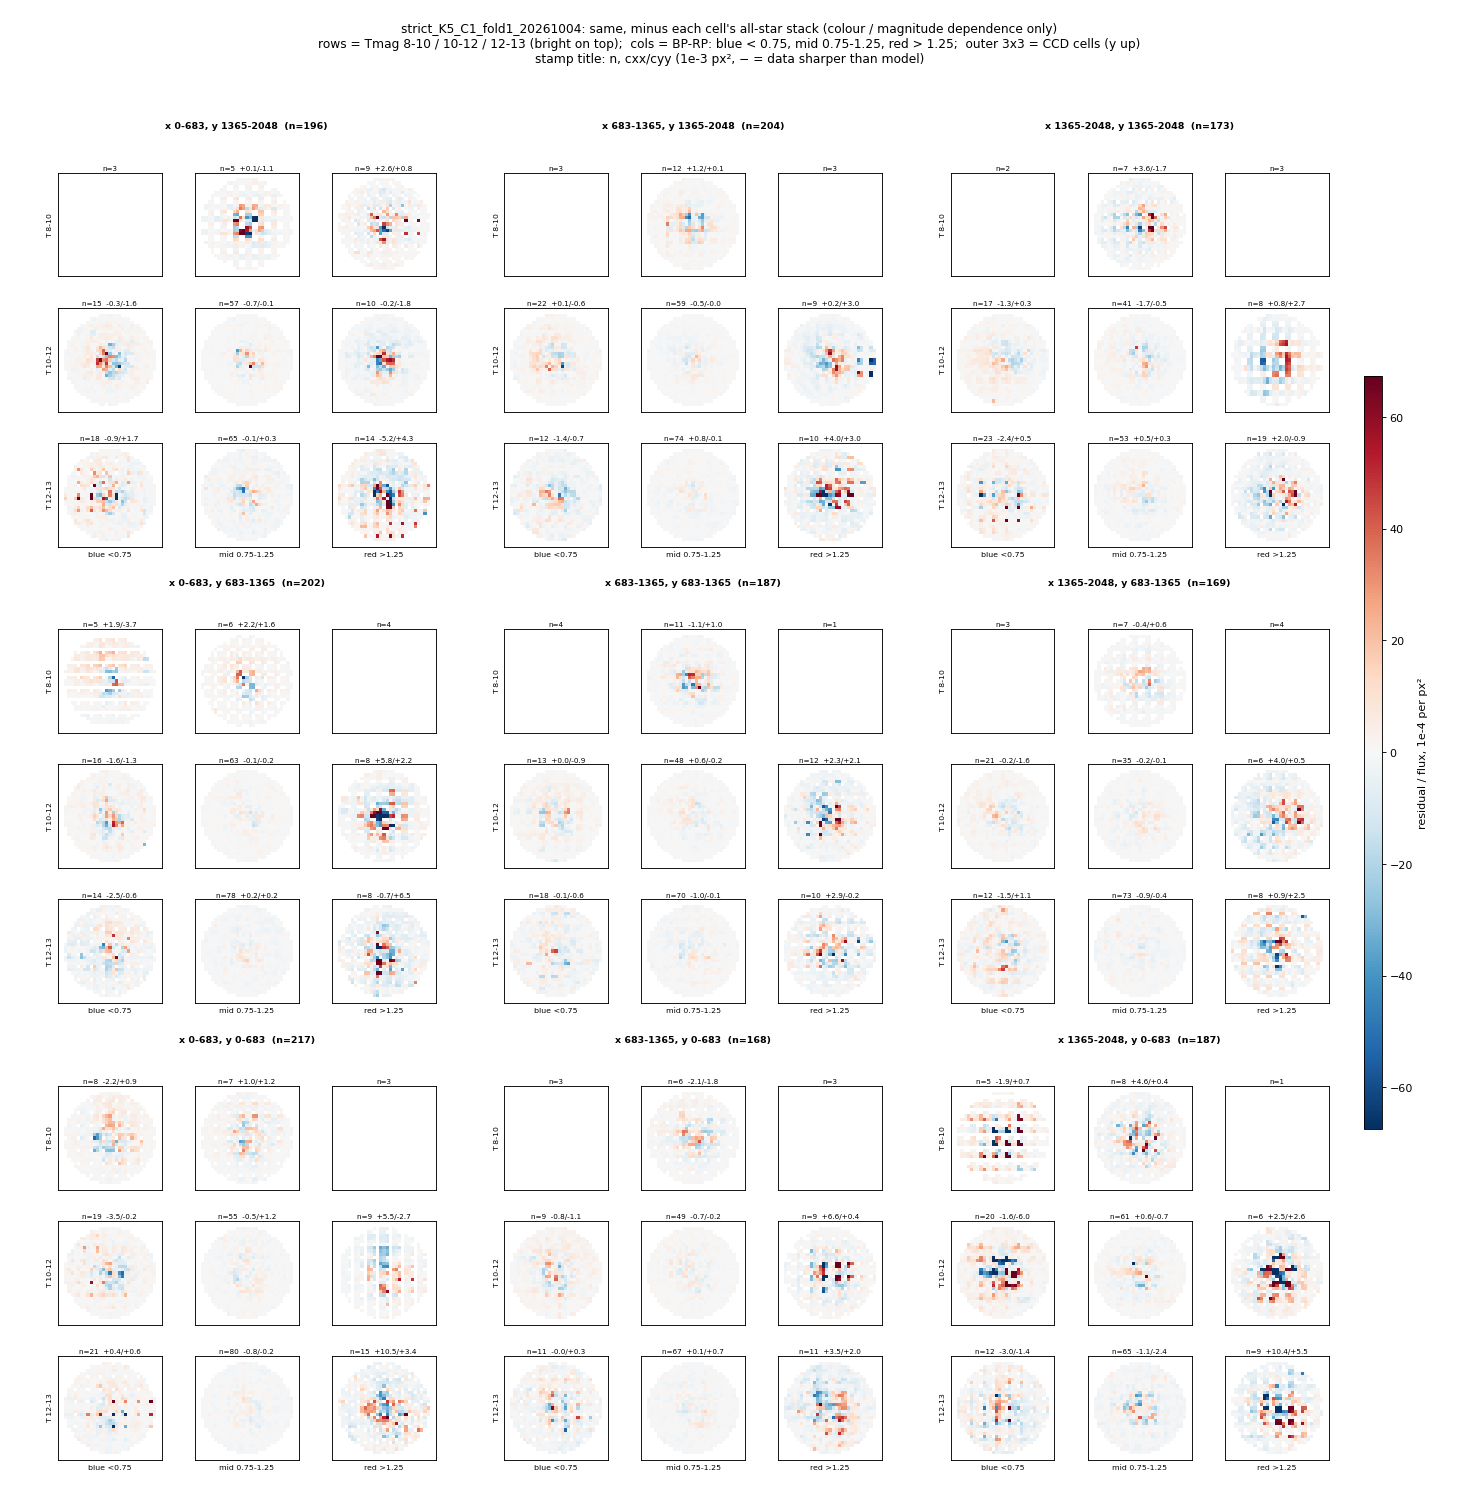
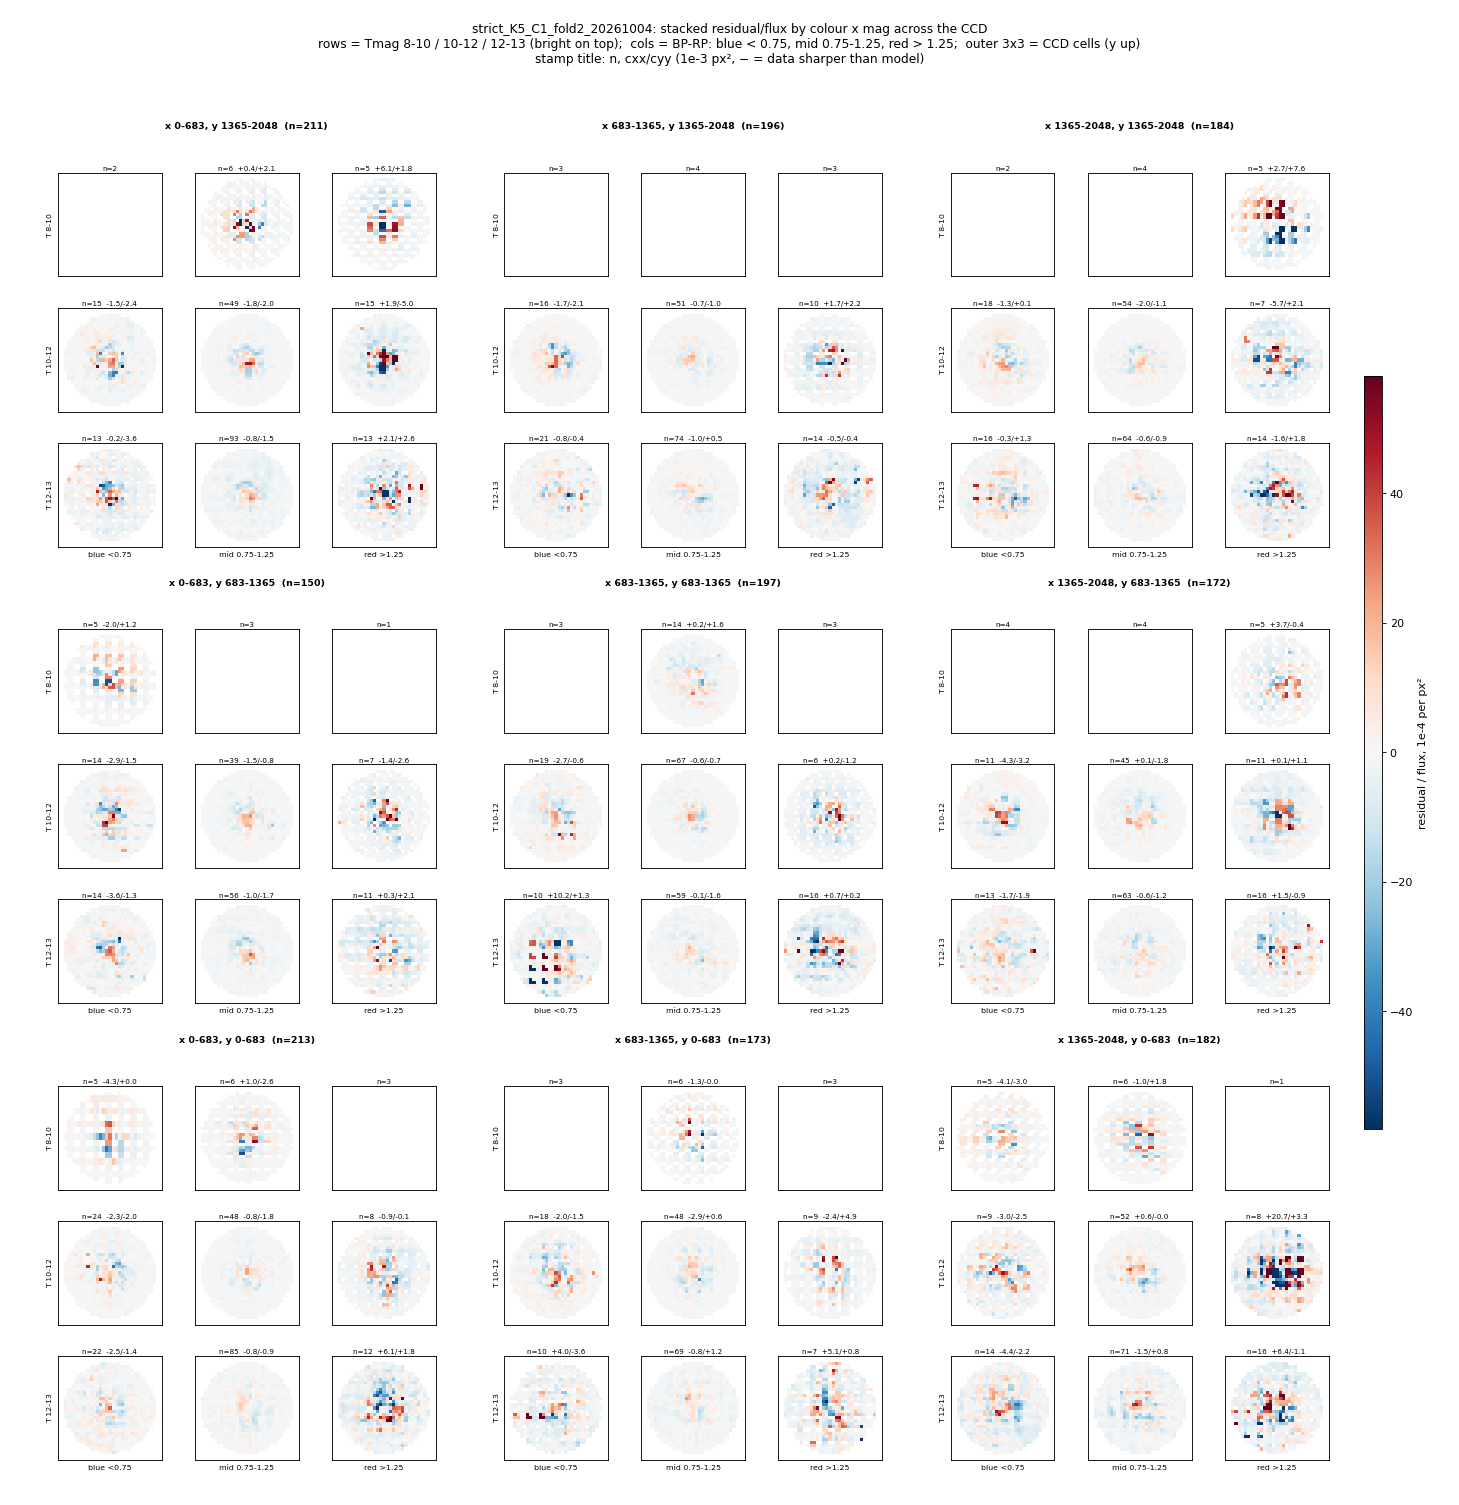
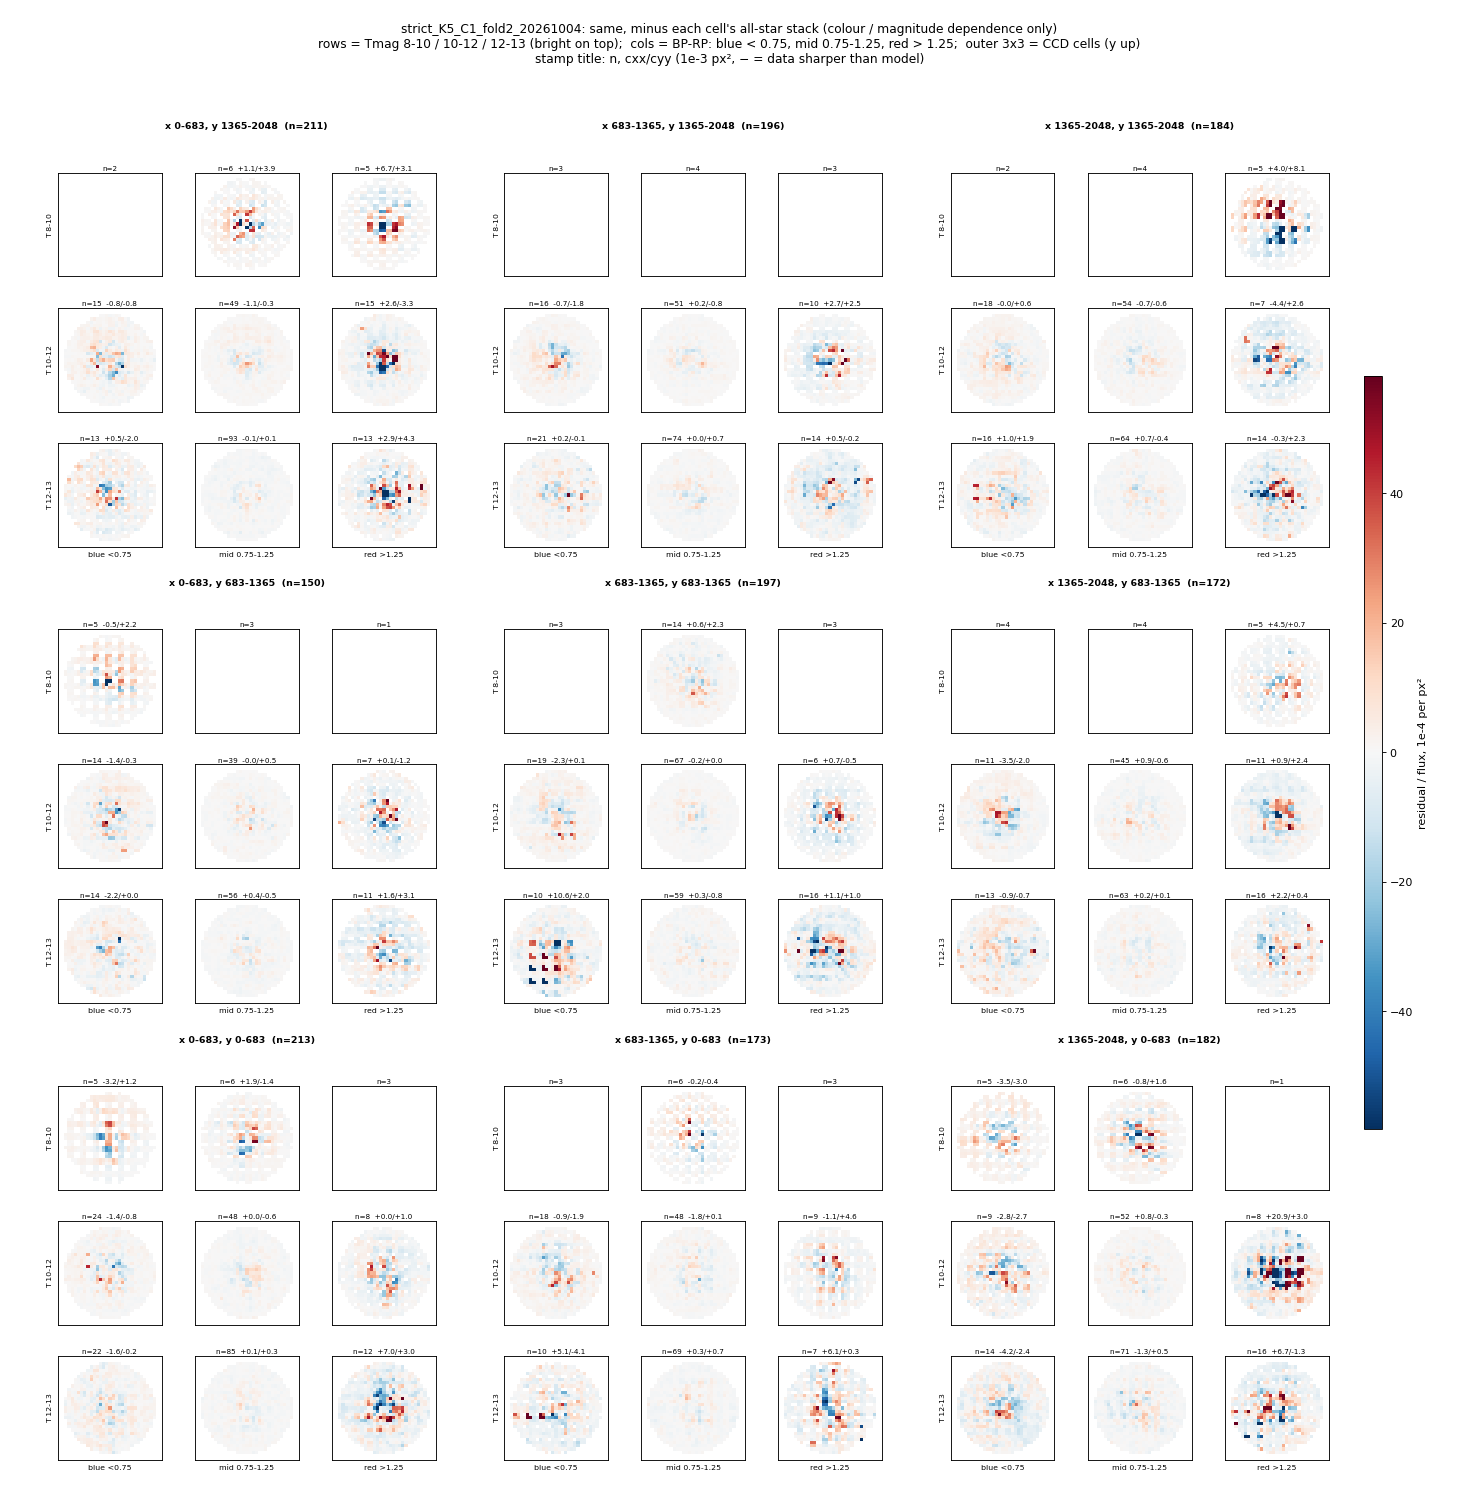
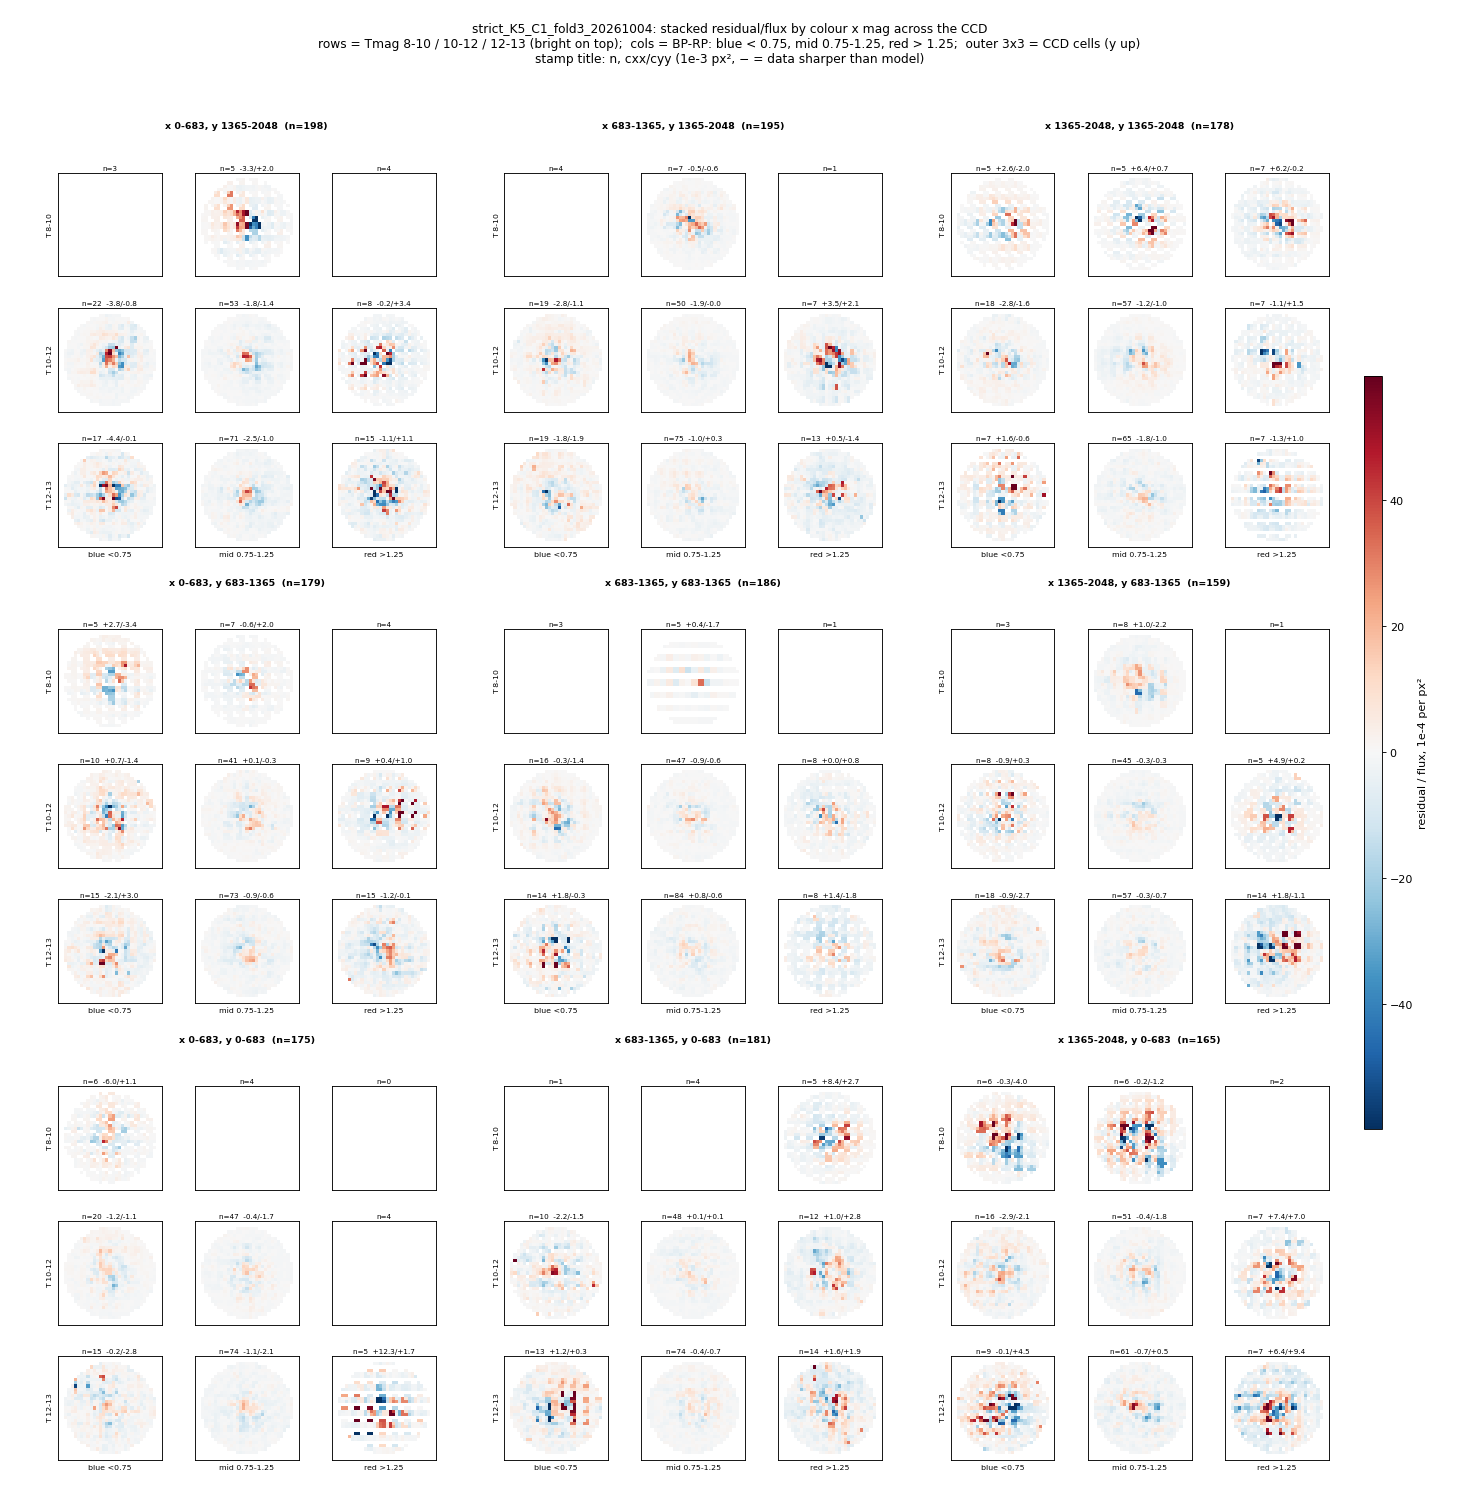
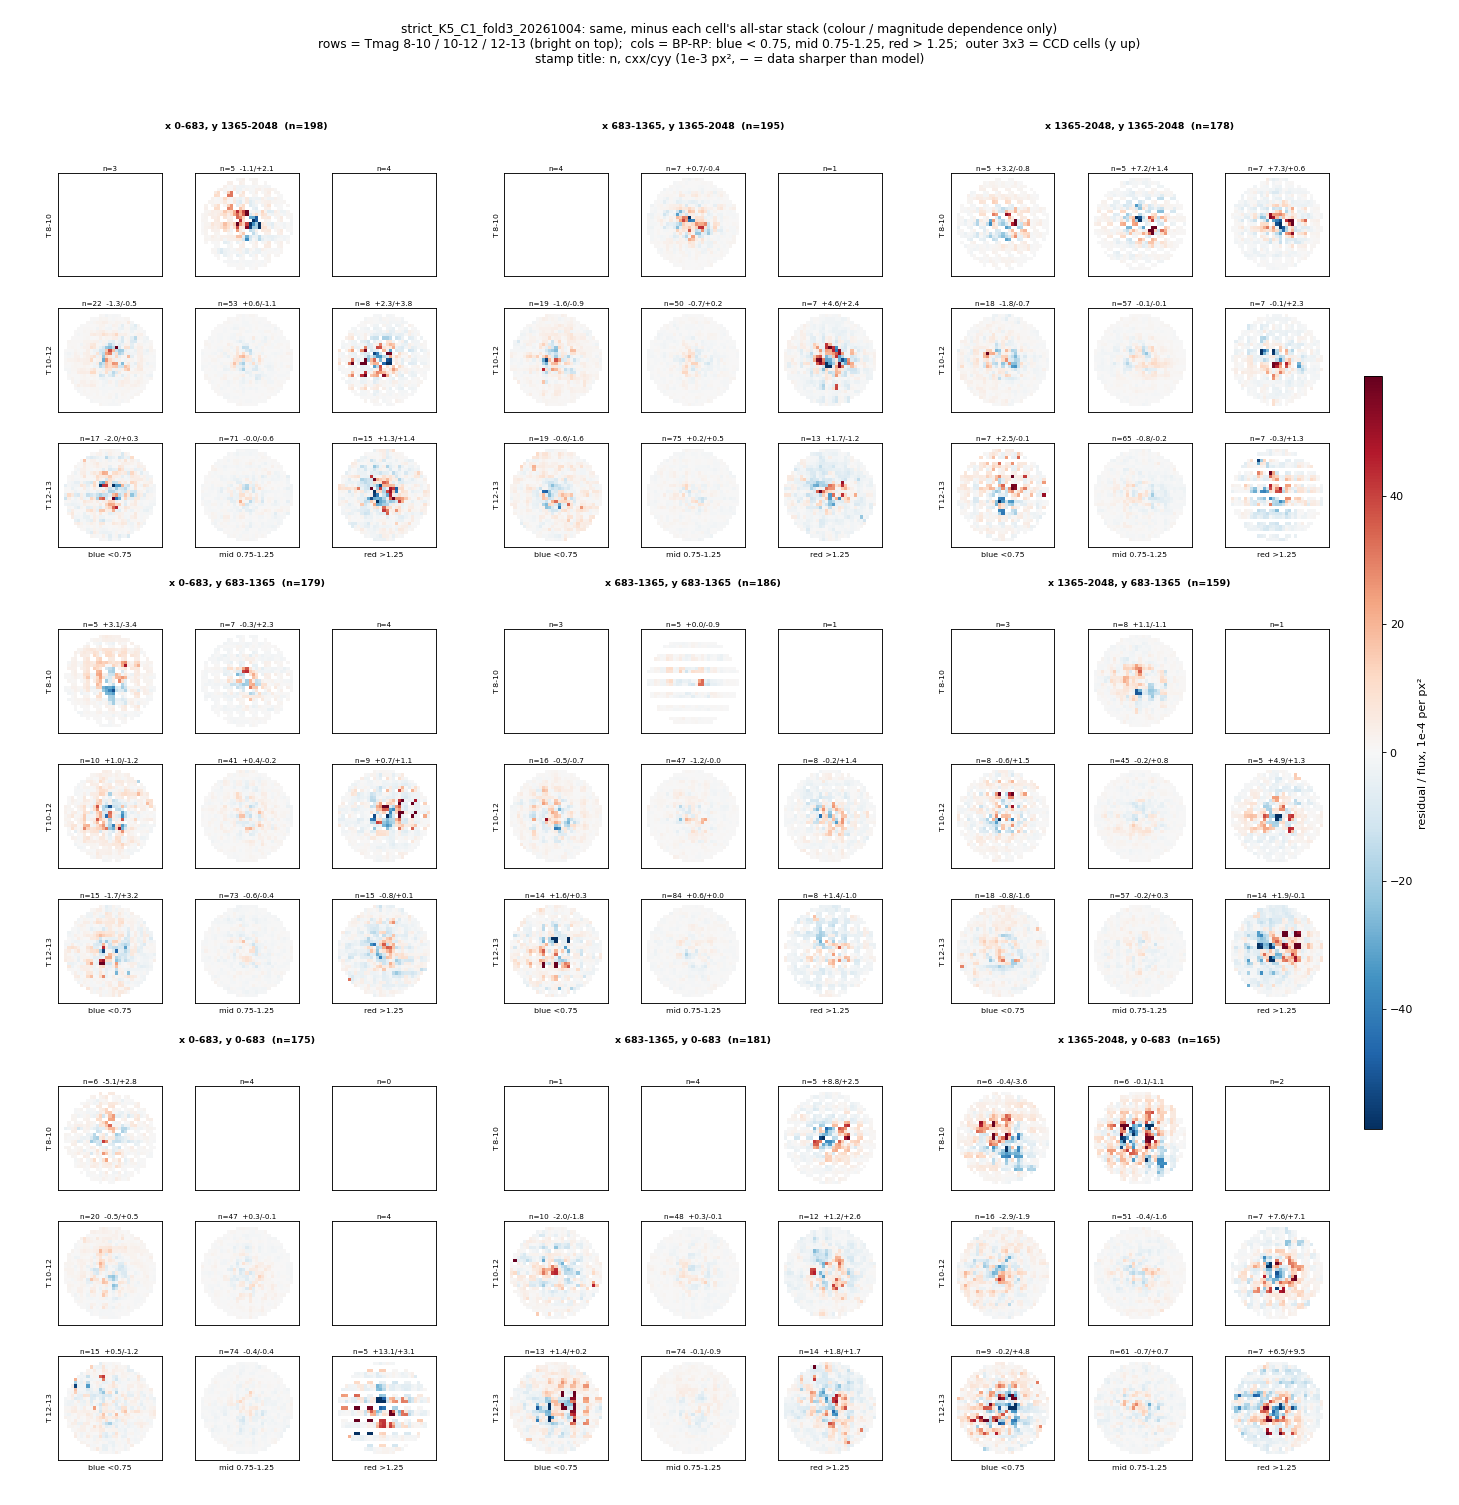
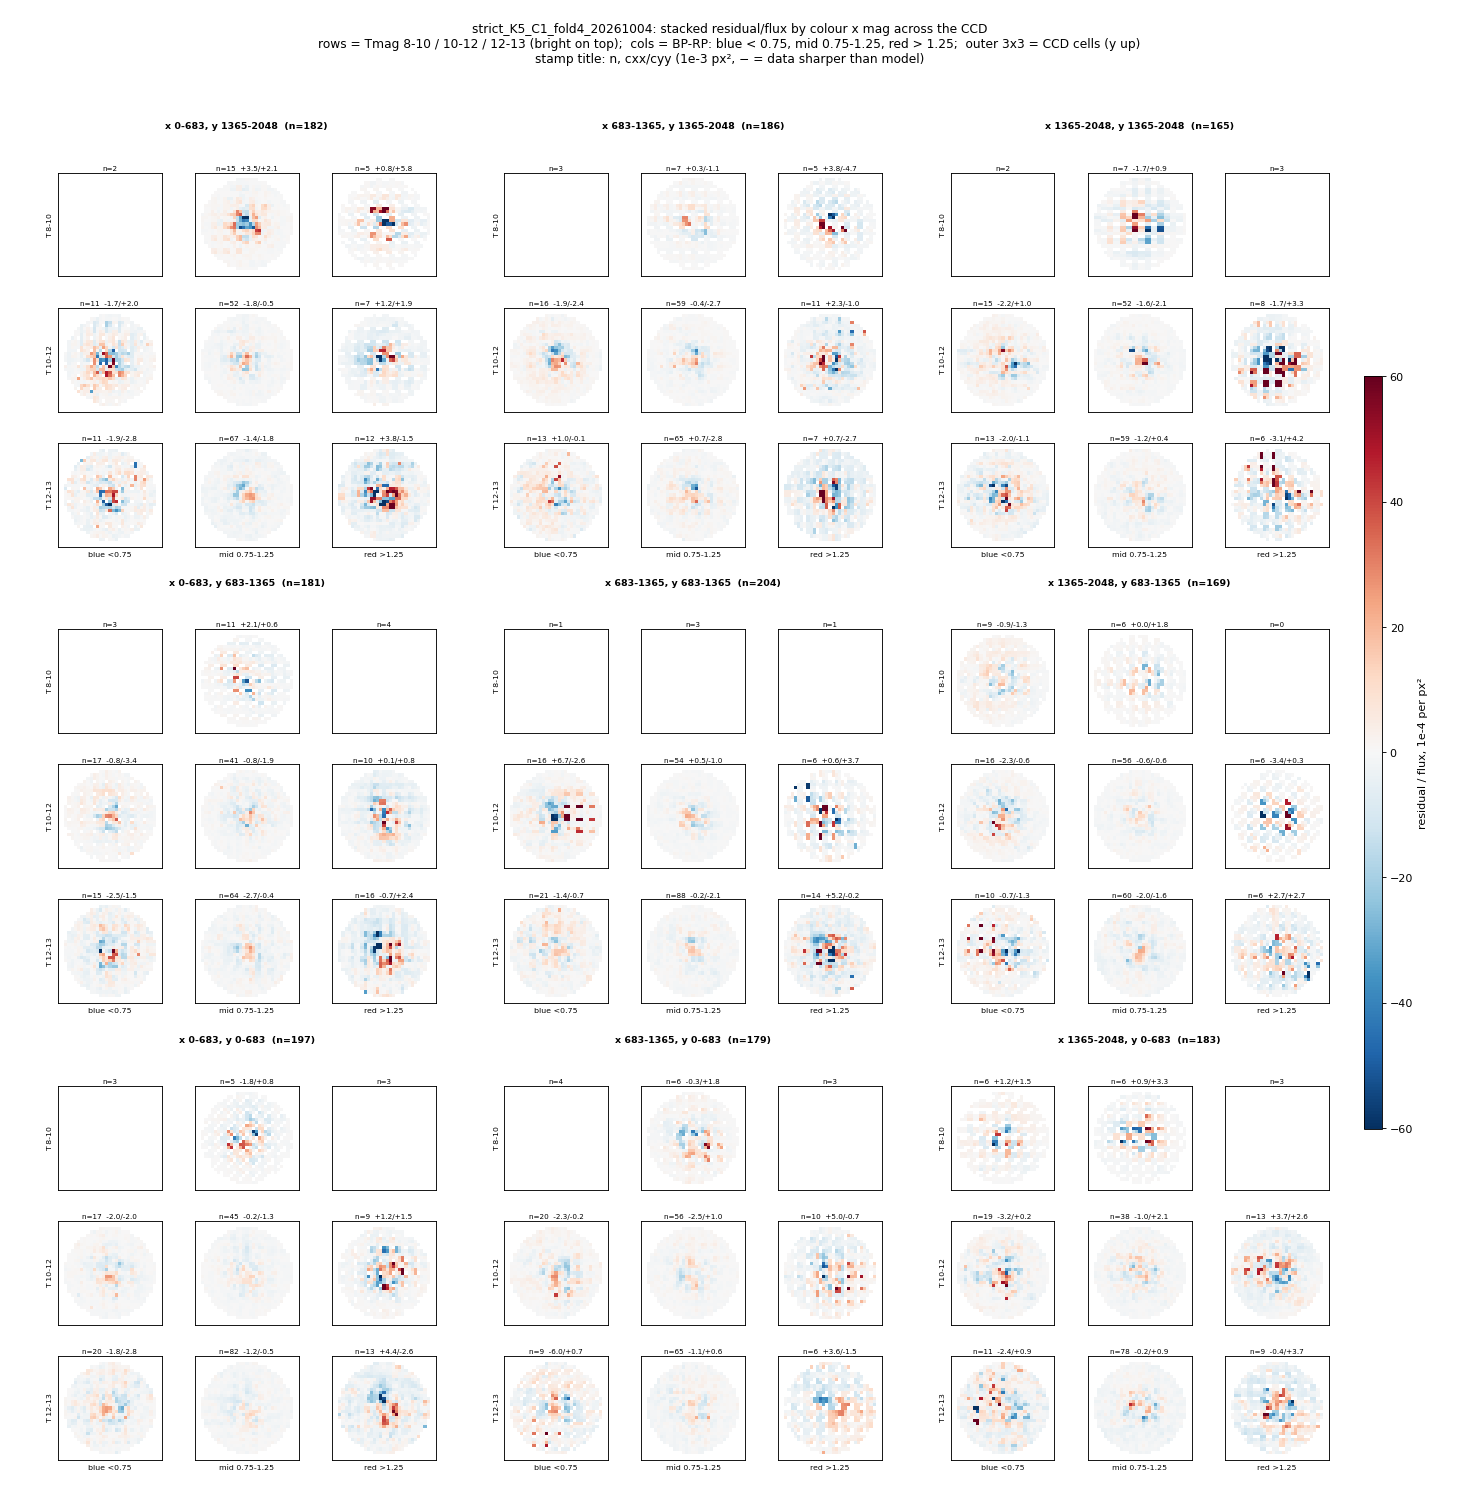
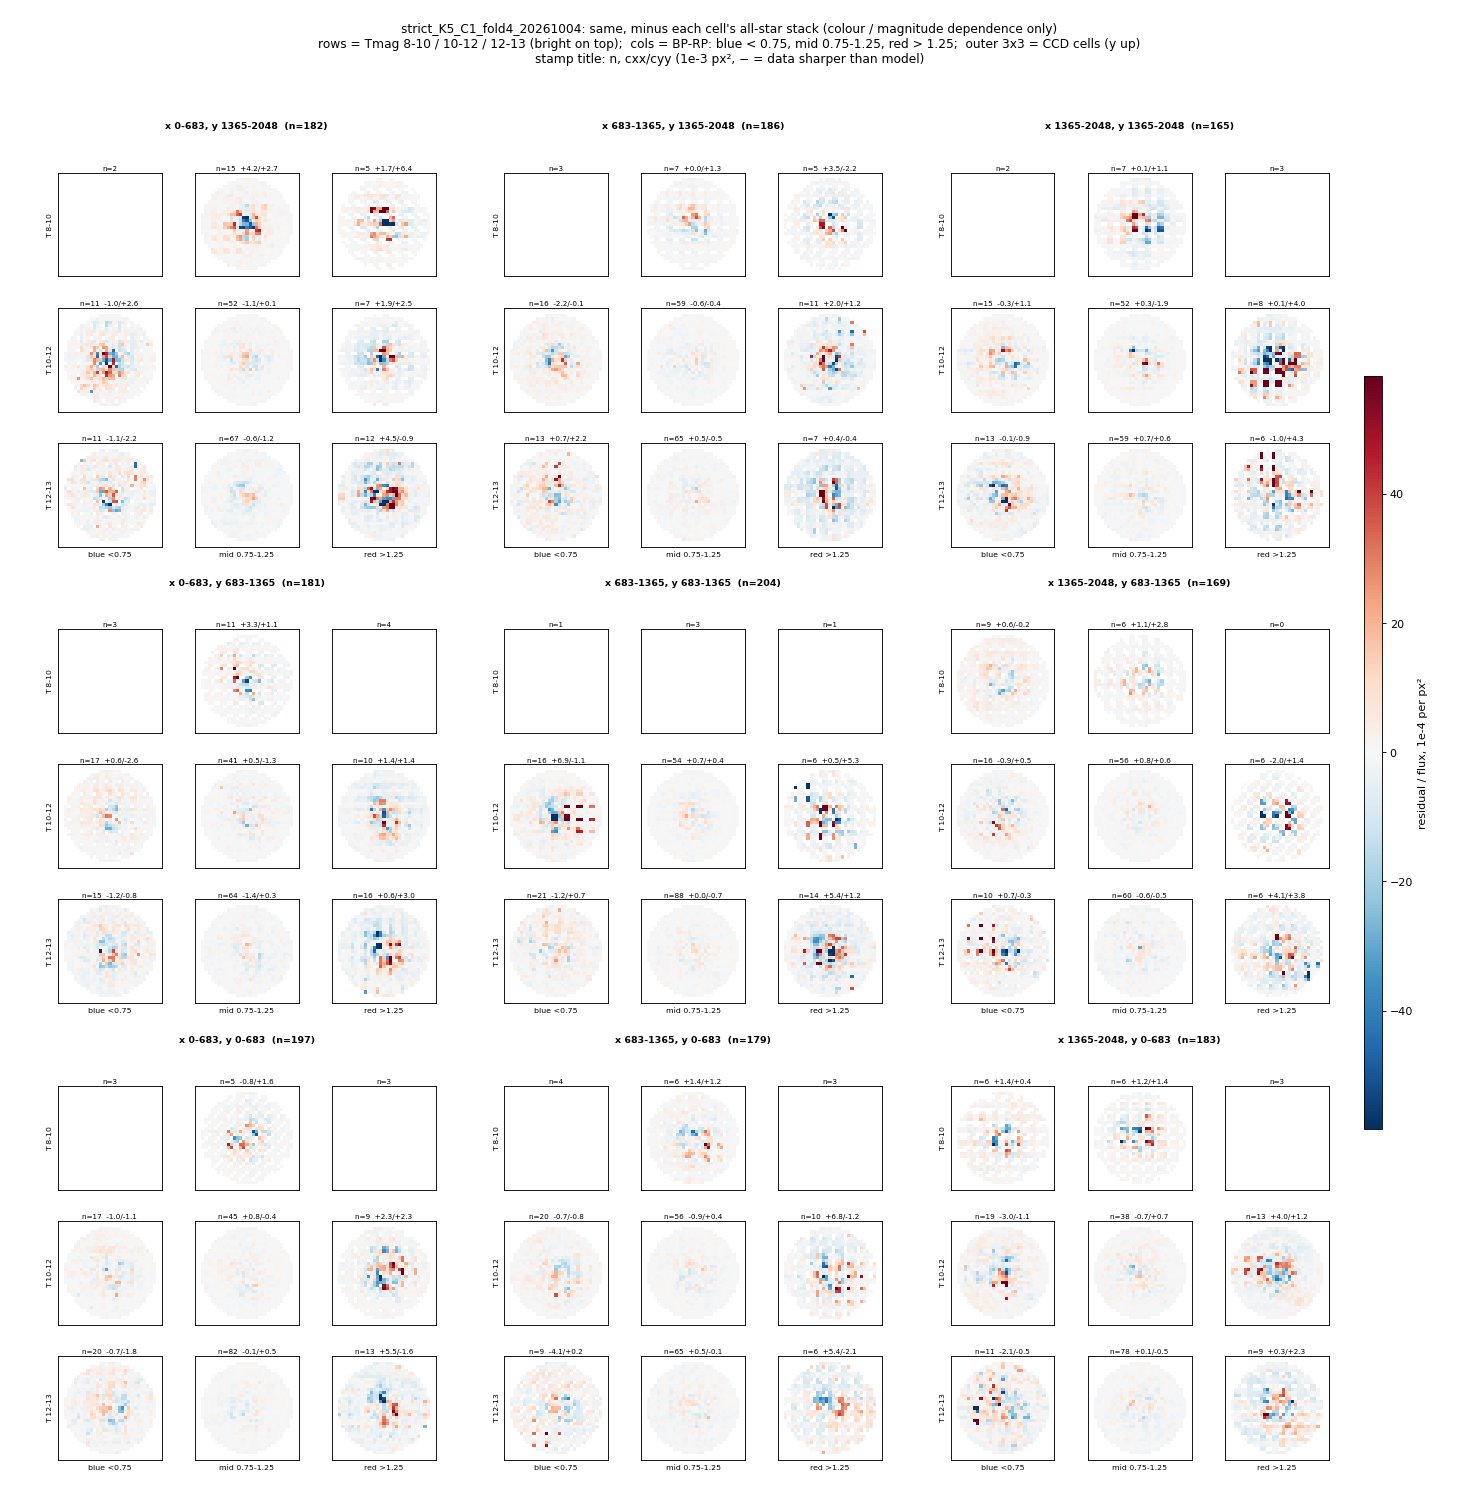
Pooled bright blue residuals often have a negative core and positive surrounding region; red bins show a positive or asymmetric core with negative surrounding structure. The red/blue distinction persists after cell-mean subtraction. More populous faint bins are visually smoother than many single-fold bright bins. One negative-flux source remains in the primary score cohort but is excluded from these flux-normalized grids.
Display bins: Gaia BP−RP and fitted-flux-derived TESS magnitude, not catalogue T / fitted XP u. The relative grid subtracts each cell’s all-star stack. Colour limits vary between images; sparse or blank bins are not null detections.
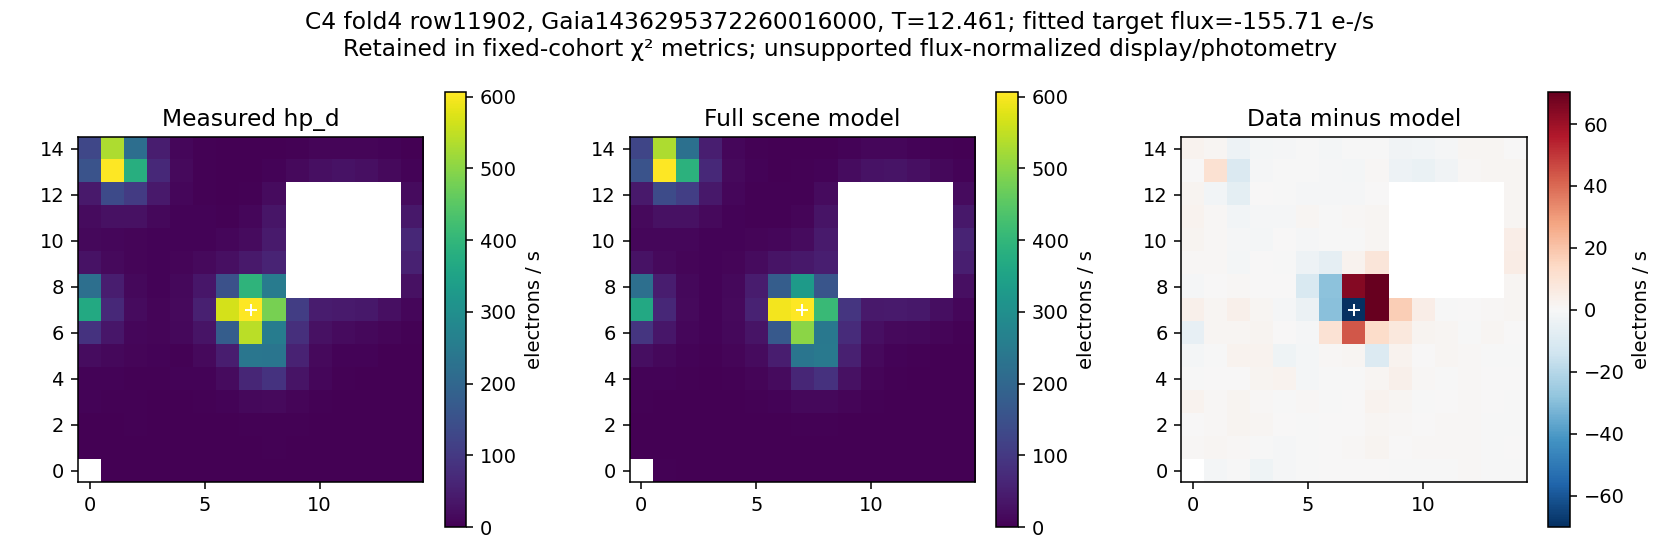
Fold 4, scene row 11902, Gaia 1436295372260016000, catalogue T=12.461, fitted source flux −155.7 e−/s. Retained in primary fixed-cohort c² metrics; excluded only from the positive-flux-normalized compatibility raster. The crowded native stamp includes masked pixels and opposing-sign core residuals; no unique cause is diagnosed here.
The matched images support the F1 bright training gap. All five fields retain colour/spatial residual structure. Spatial training coverage, nuisance amplitude fitting, and field/model uncertainty differ; this is not a one-factor overfitting experiment. These single-image figures do not establish calibrated noise, temporal accuracy, or better photometry. Independent-start and confirmation-image controls are evaluated elsewhere in the parent investigation.