ePSF Colour Model Explorer
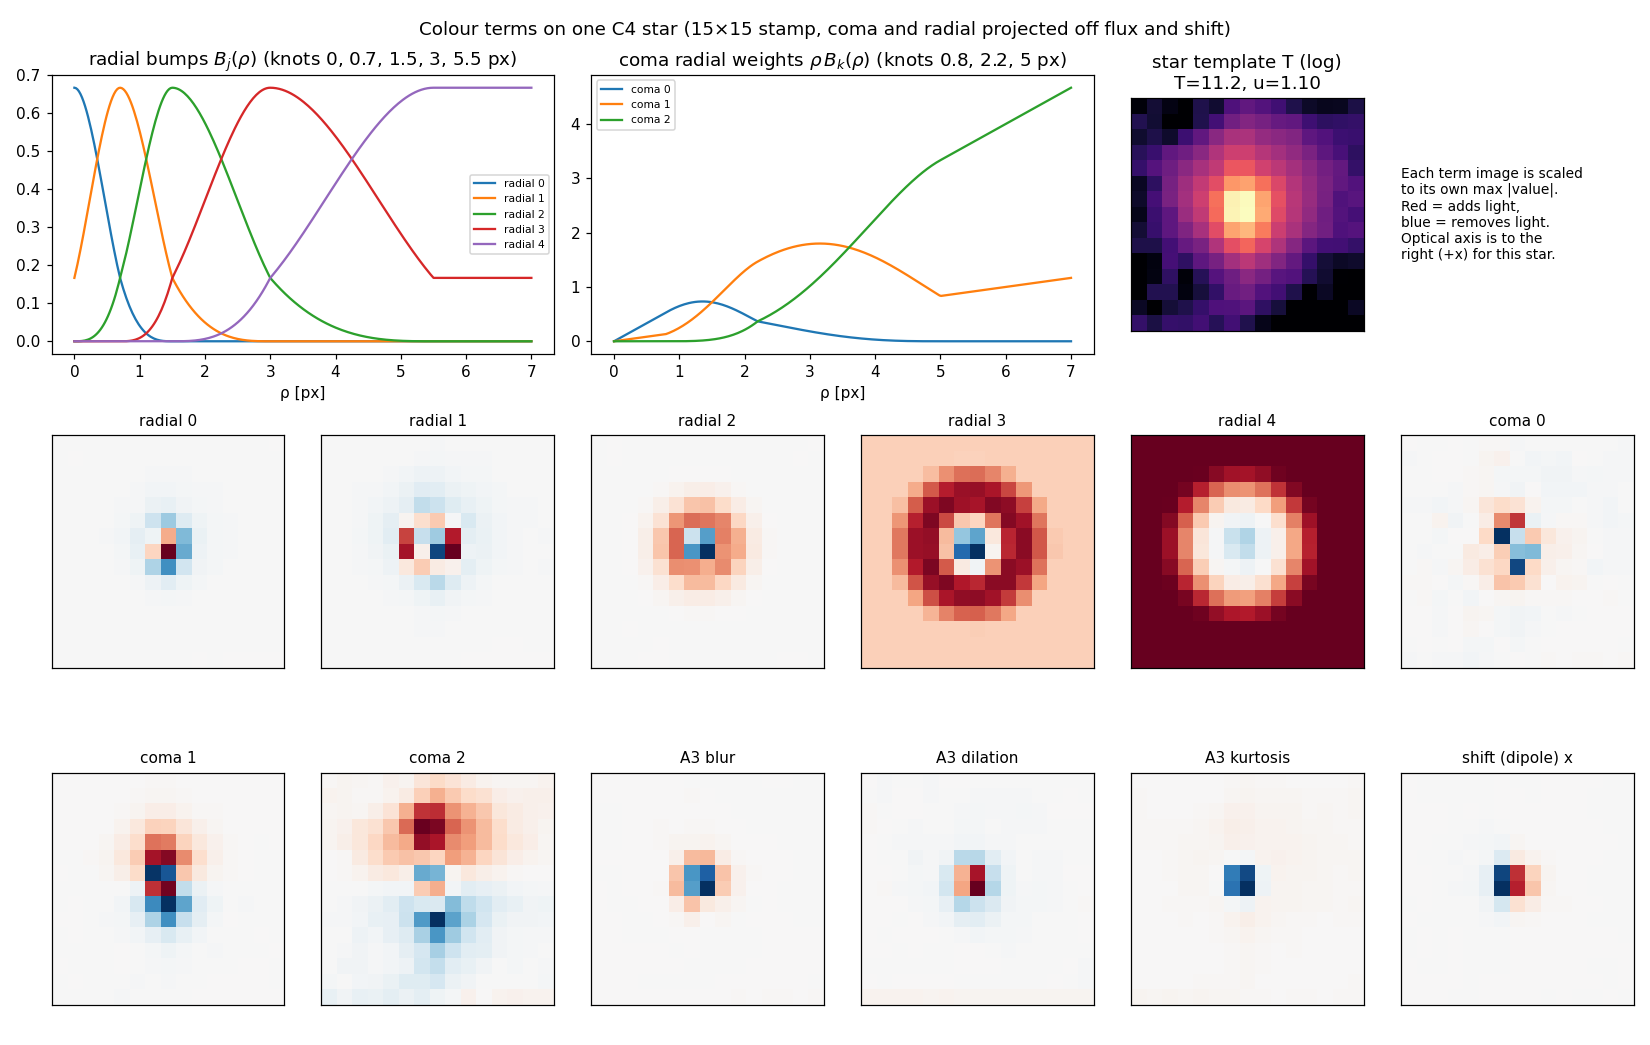
Held-out residual grids for every colour model we trained, on one fixed colour scale, so switching model changes only the residual. Pick a model, a field and a star set below. The figures further down show what the colour terms are and how they compare with the measured colour response.
Grid layout: outer 3×3 = CCD cells (y up). Inside each cell, rows are T 8–10, 10–12, 12–13 (bright on top) and columns are BP−RP blue < 0.75, mid 0.75–1.25, red > 1.25. Each stamp is the clipped mean of residual / flux, in 10⁻⁴ per px². The stamp title gives n and the width residual cxx/cyy (10⁻³ px², negative = data sharper than the model).
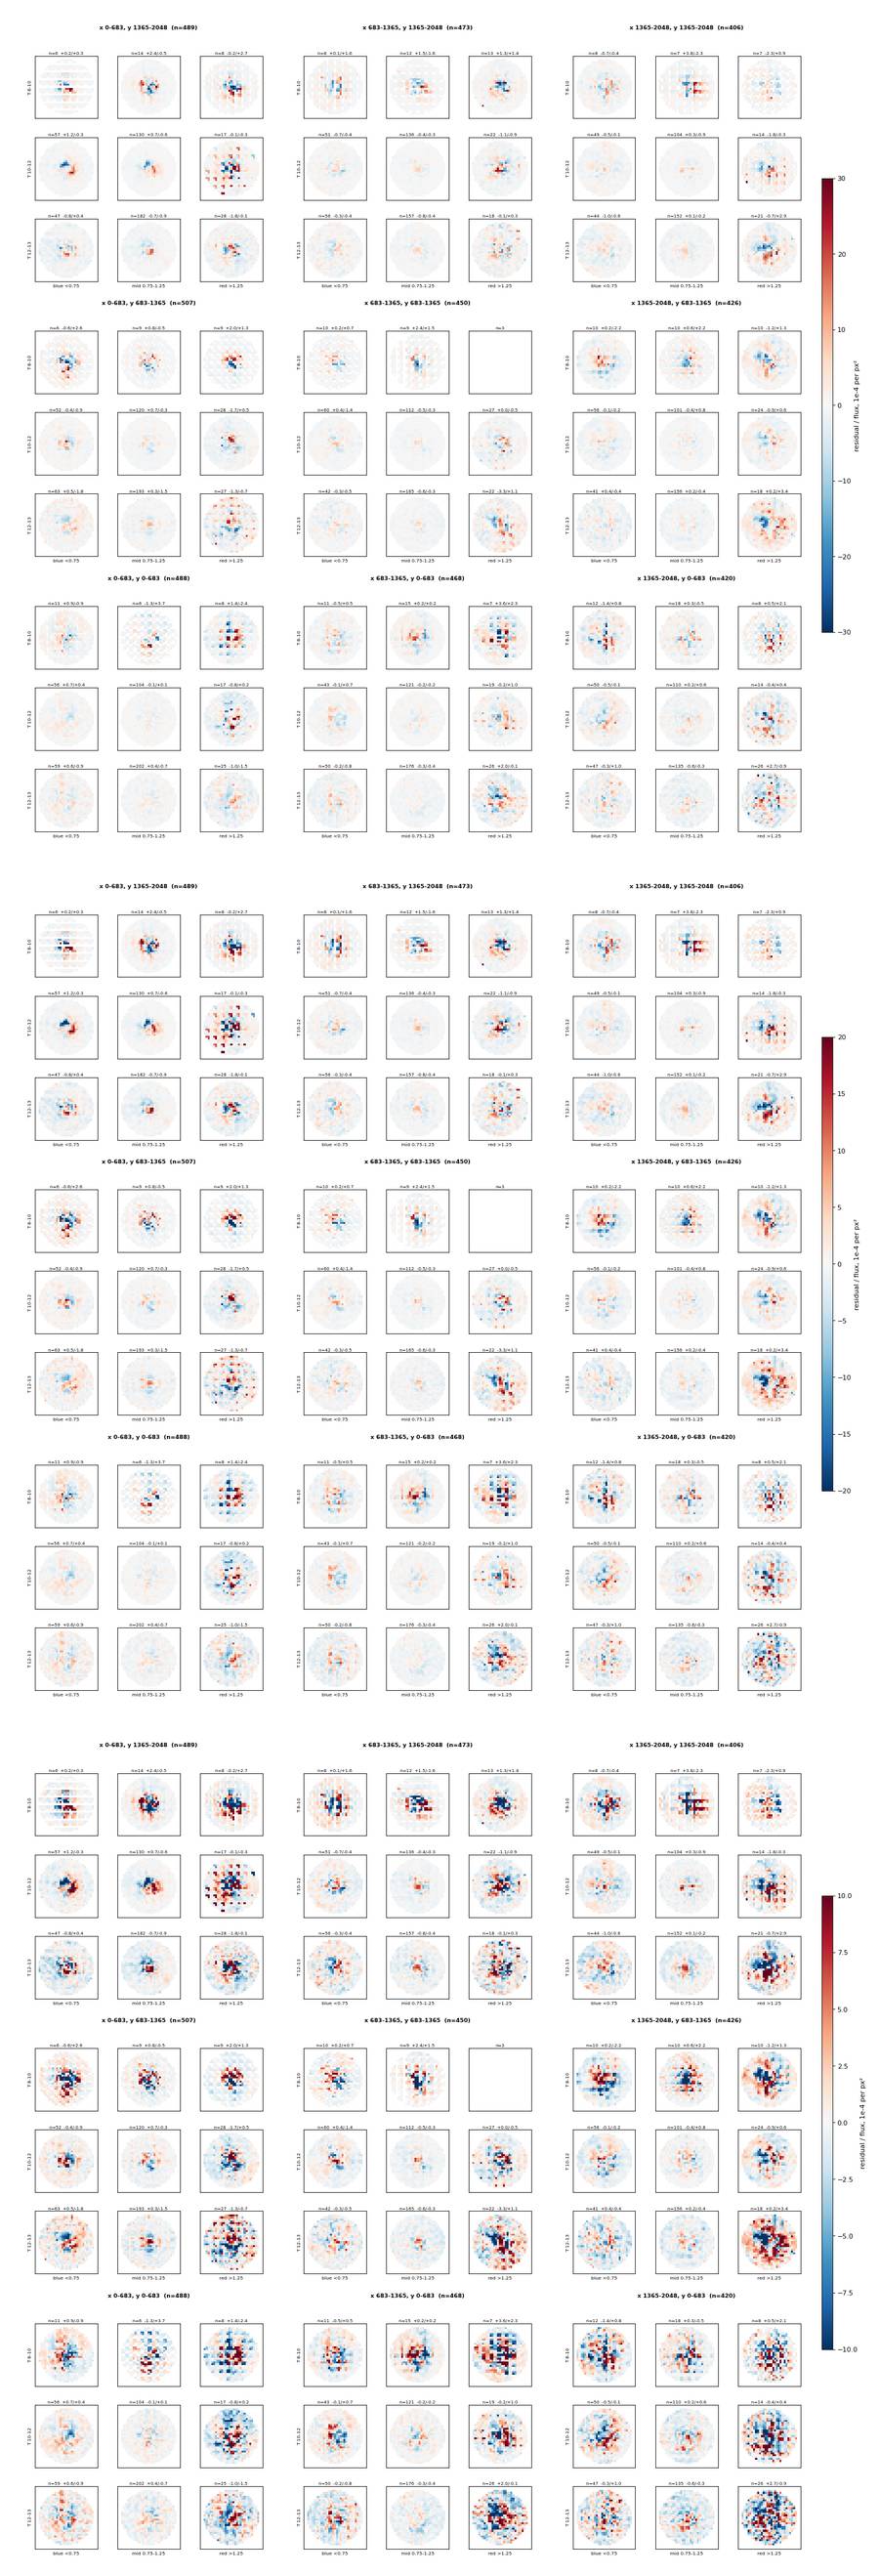
Every model uses the same colour scale, chosen with the scale buttons (±30, ±20 or ±10×10⁻⁴ per px²); switching model never changes the scale. Colour-relative = each cell minus its all-star stack. Fields F1 = S24 cam 2 CCD 2, F2 = S20 cam 3 CCD 3, C4 = S23 cam 4 CCD 2; the final model also has S22 (S22 cam 3 CCD 3) and C1 (S24 cam 1 CCD 2).
What the data show, before any model
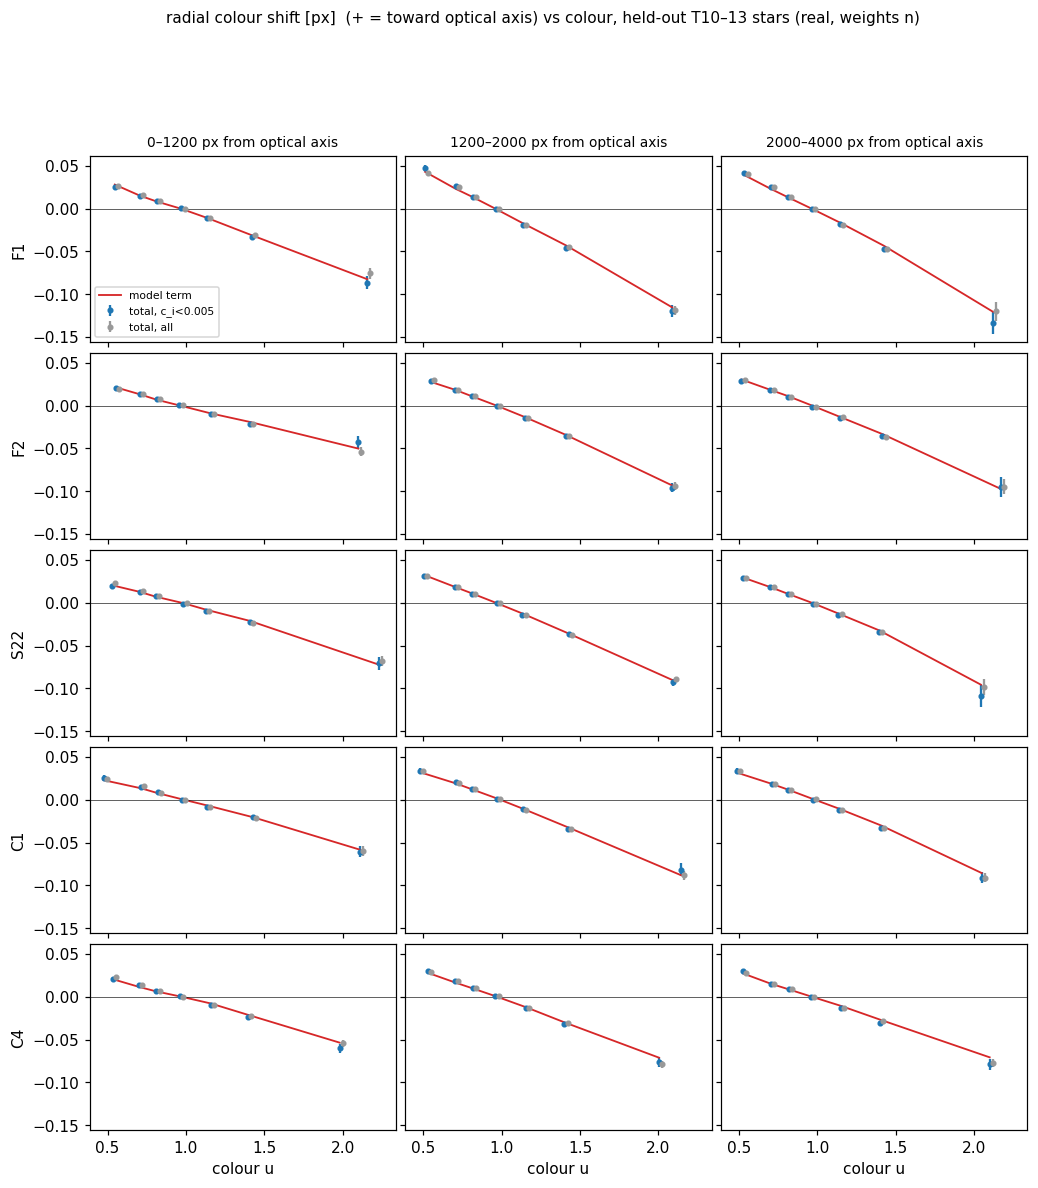
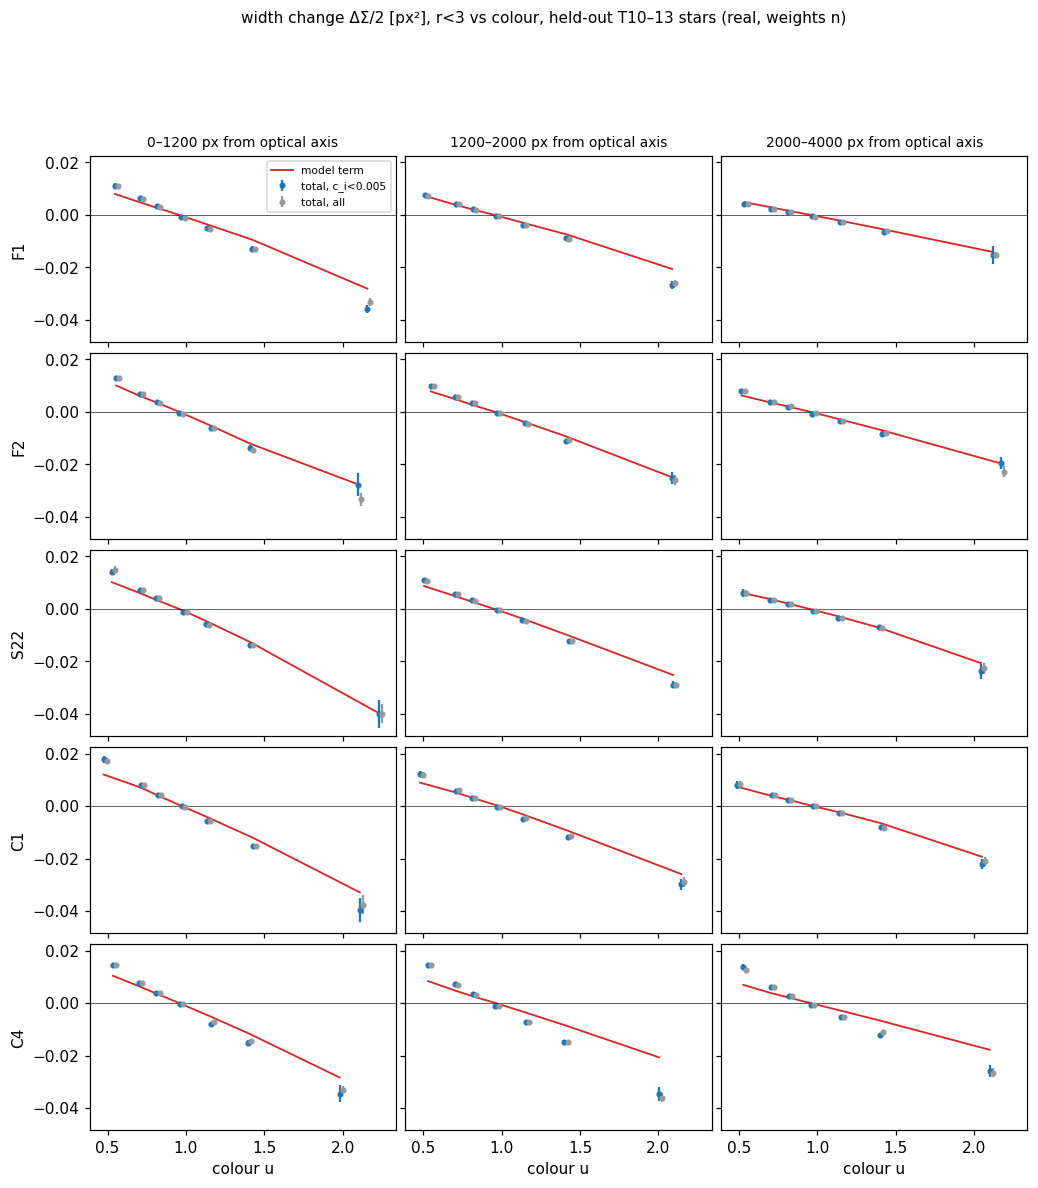
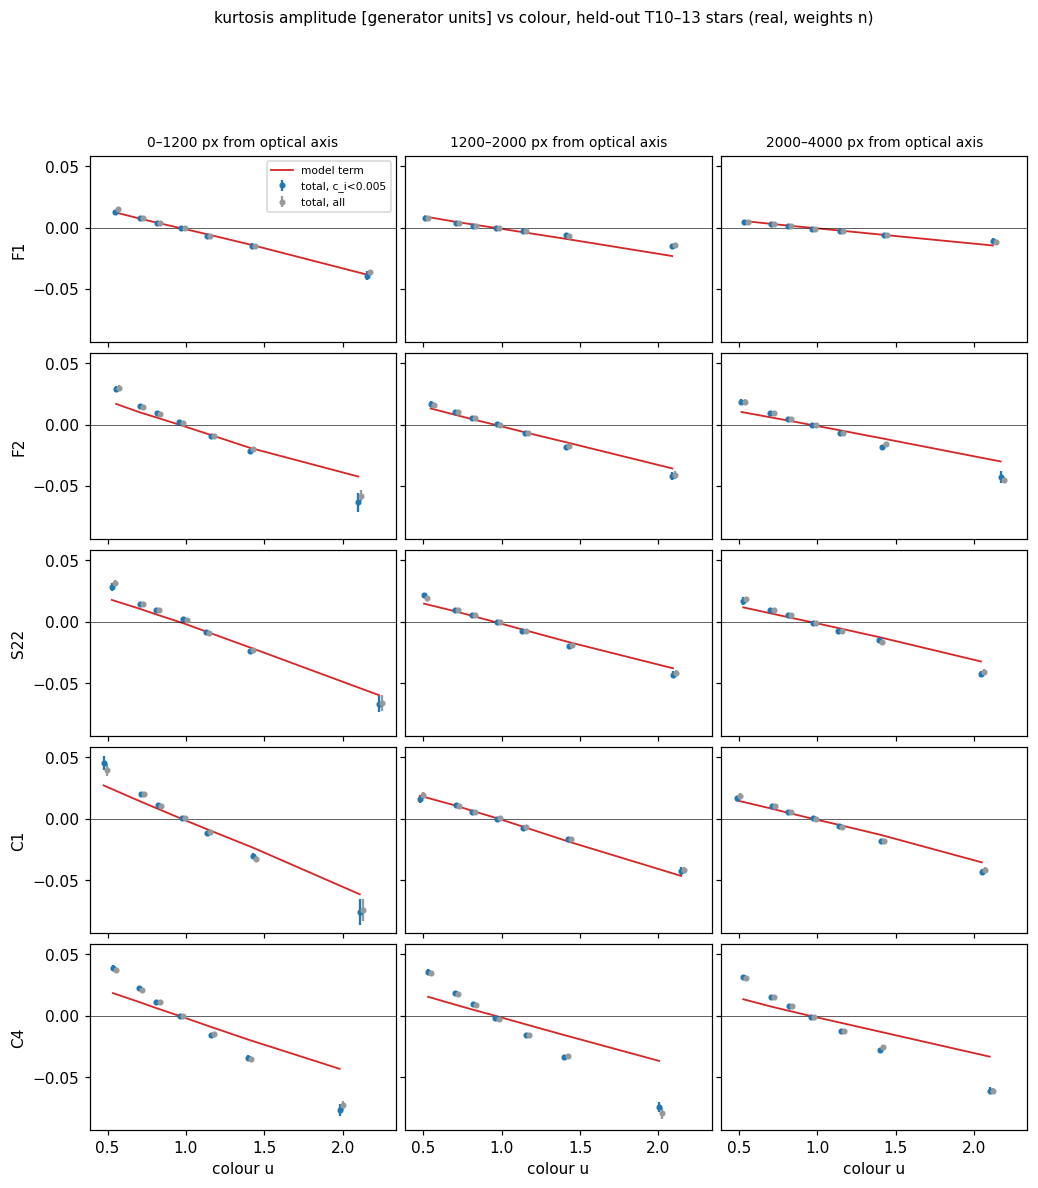
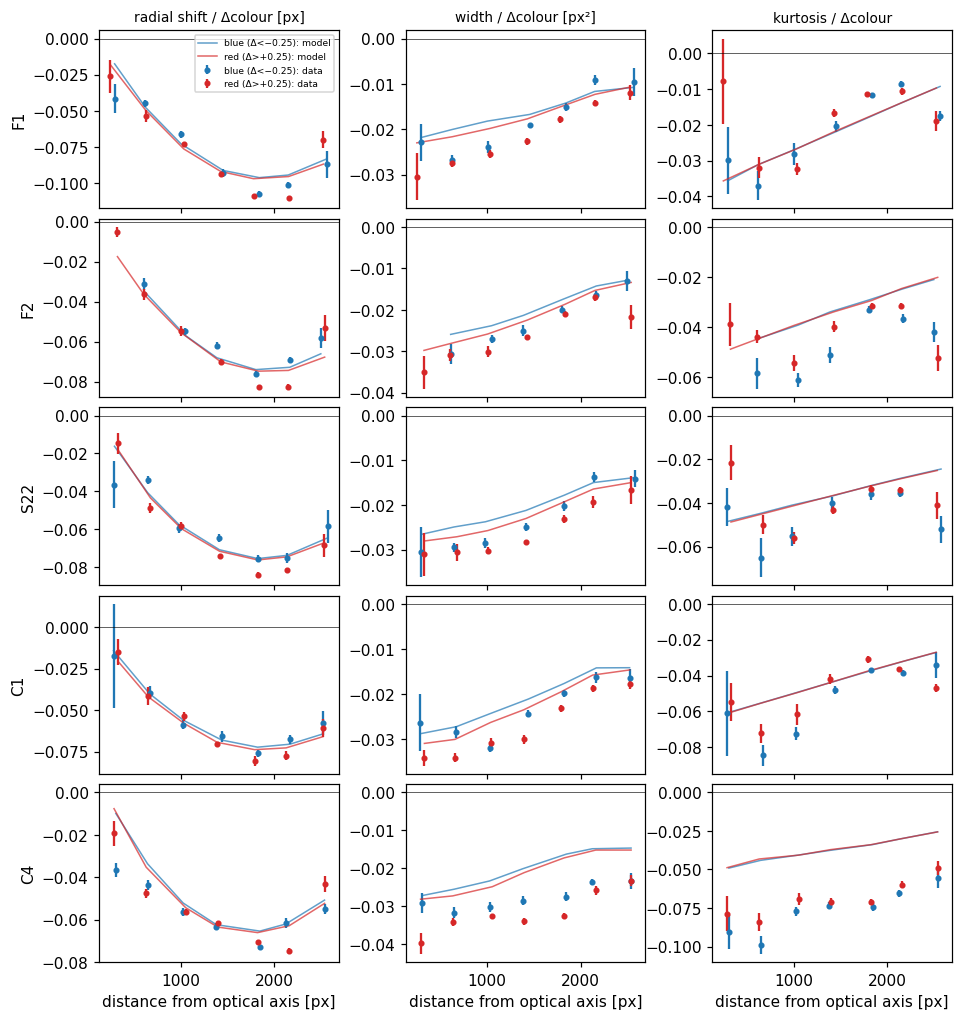
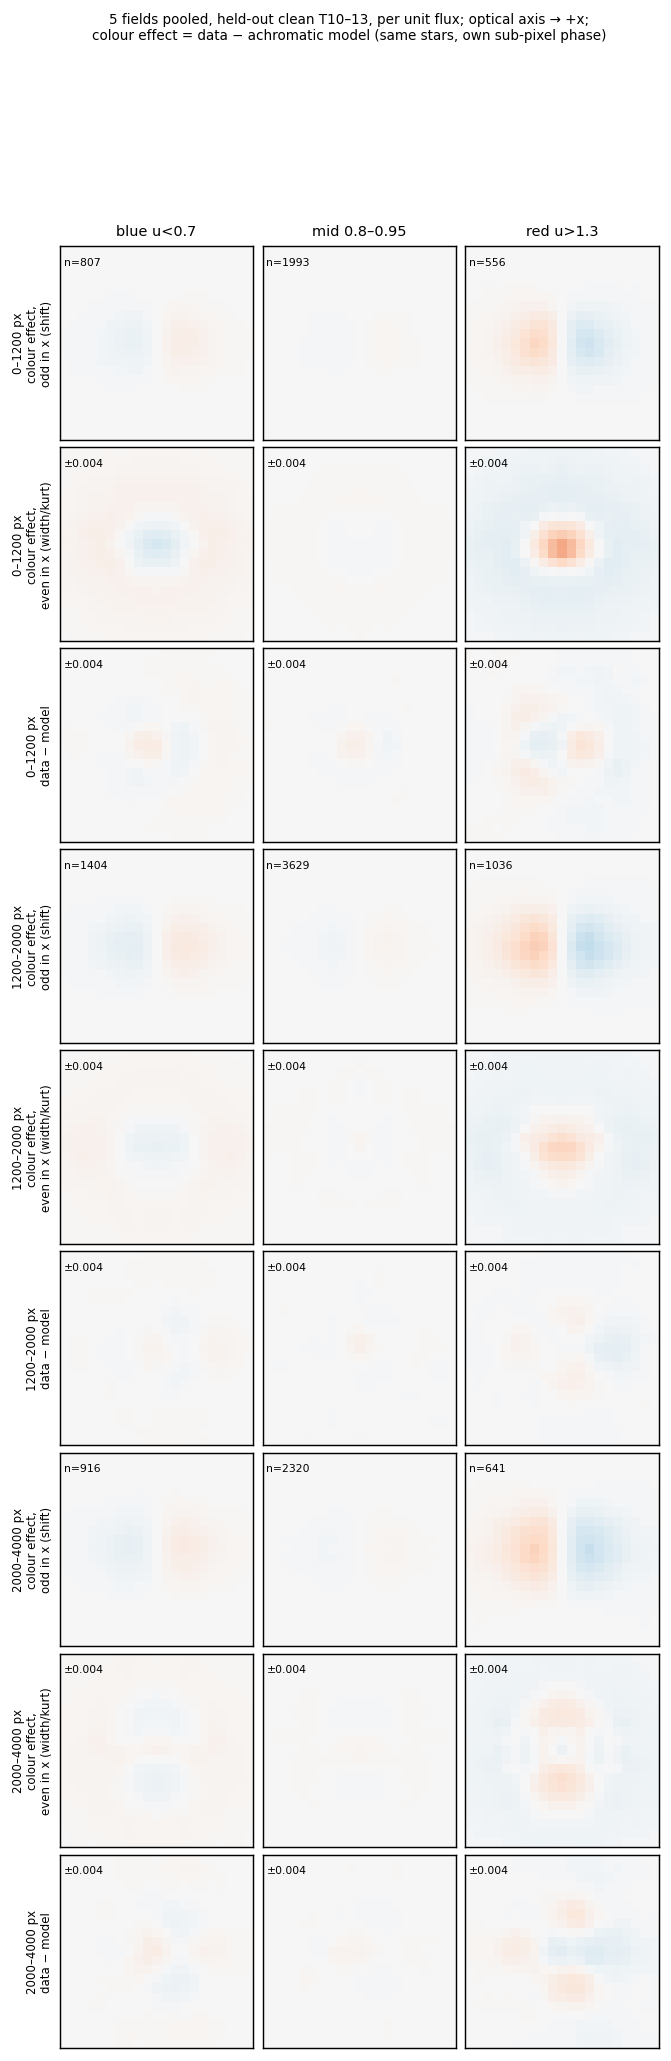
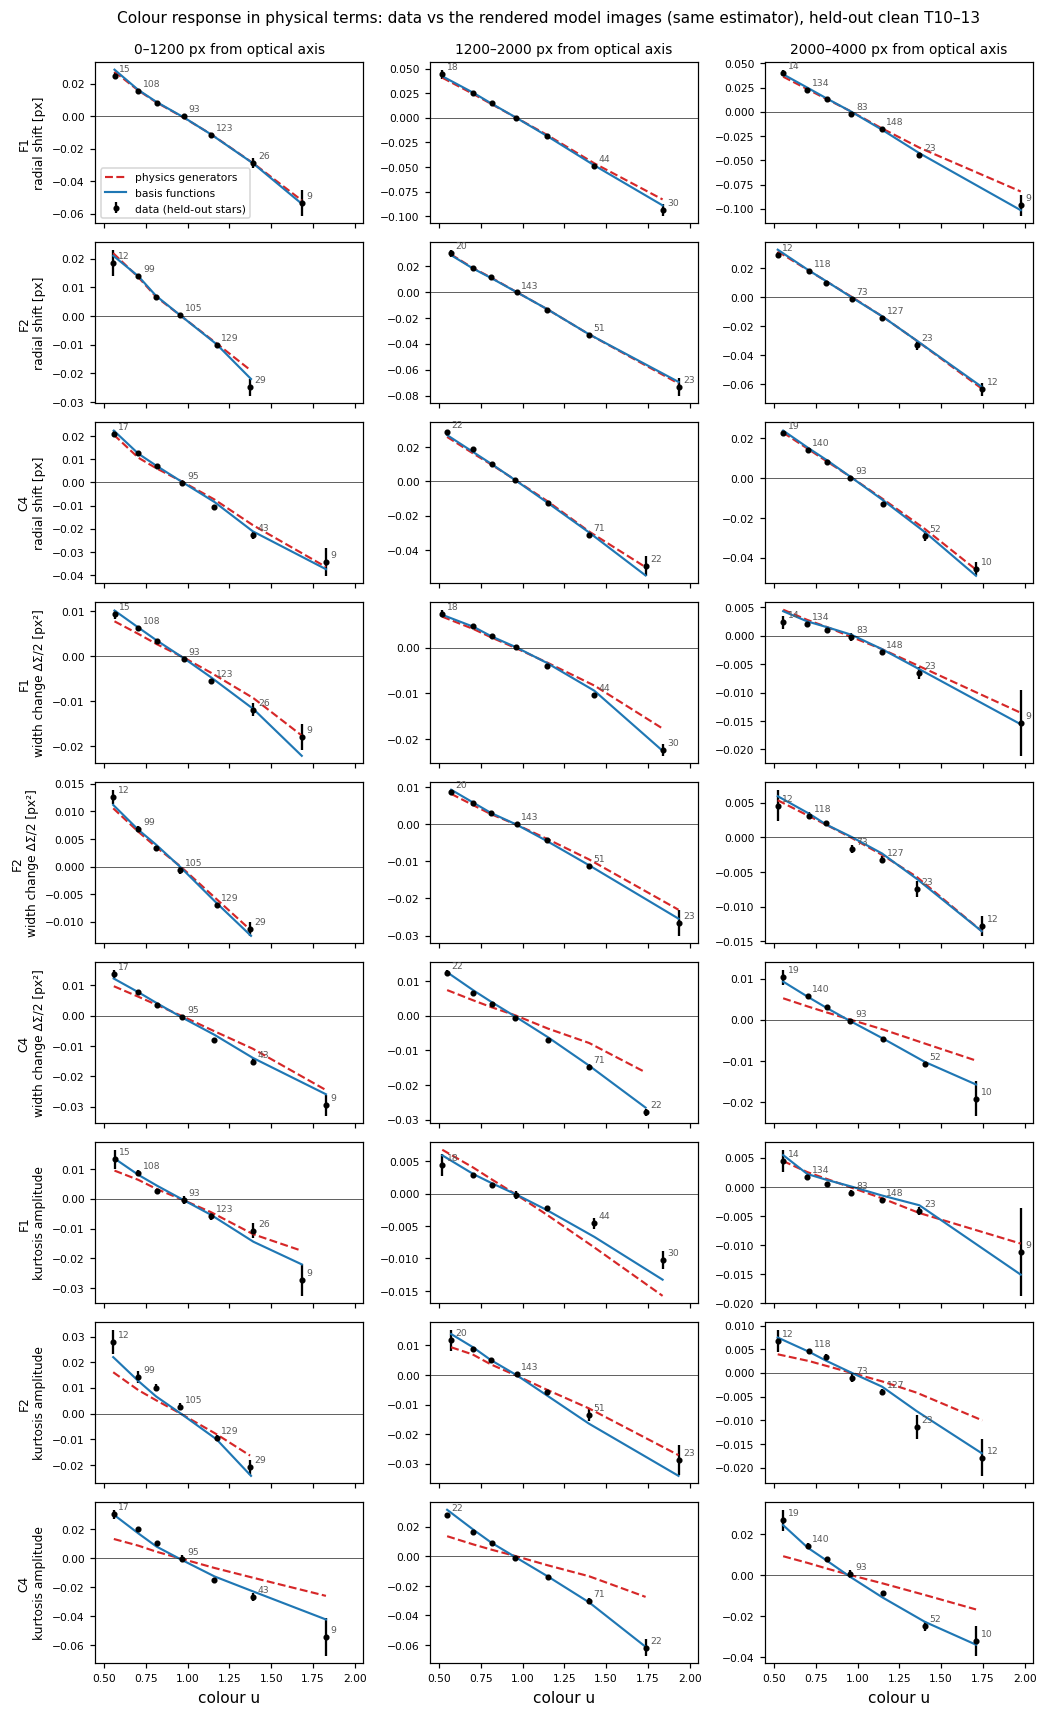
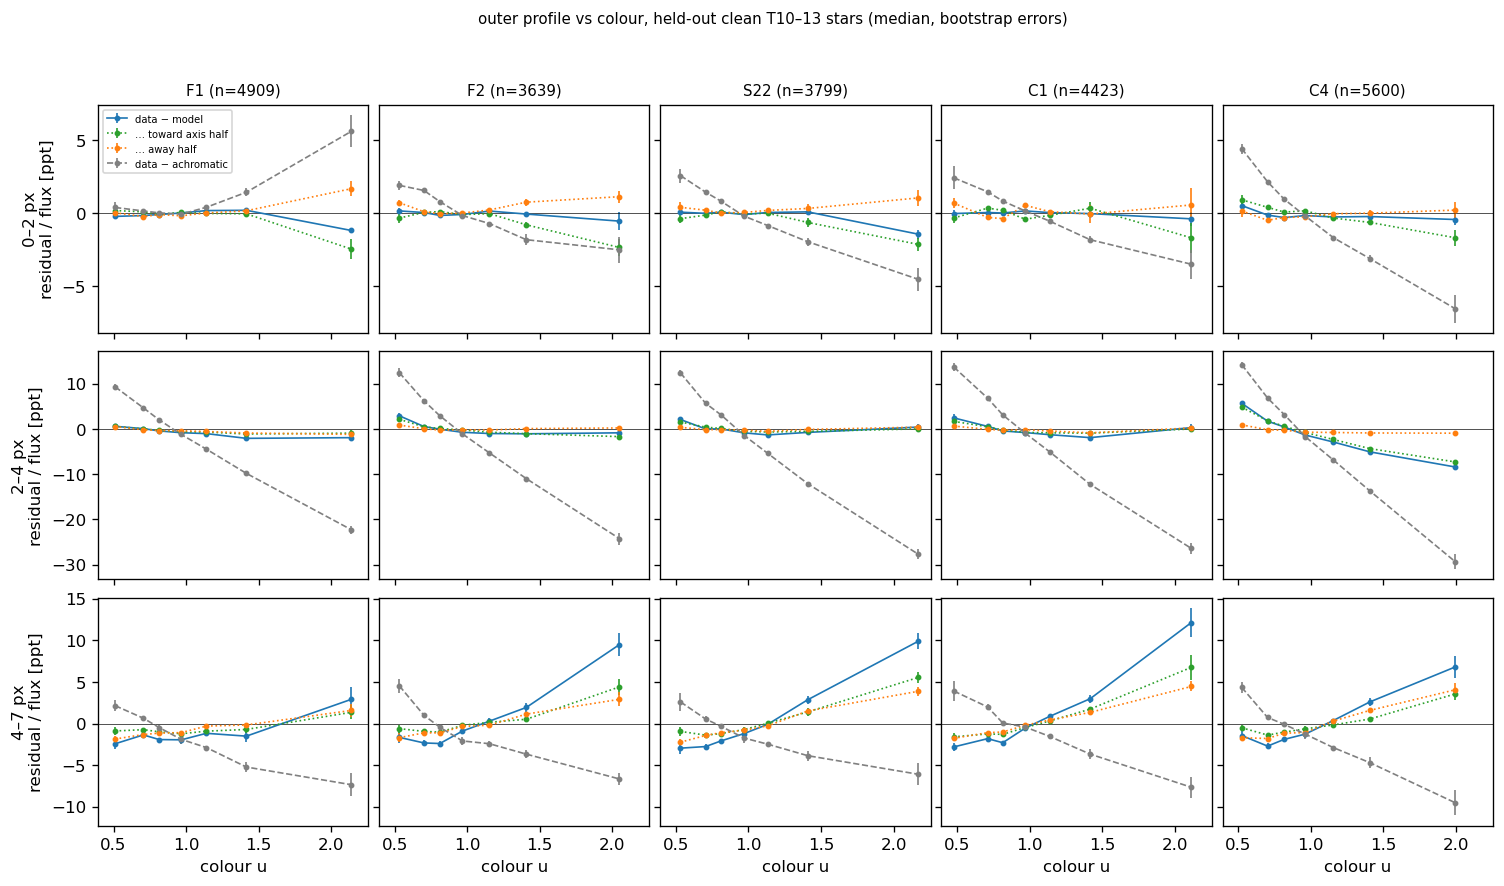
The colour response of the TESS PSF measured on held-out T 10–13 stars, five fields, three zones of distance from the optical axis. u is the model's colour variable: the star's flux-weighted mean wavelength across the template's PS1 bands (from Gaia XP), mapped to BP−RP units by a per-CCD linear fit, so it runs from about 0.5 (bluest) to 2.1 (reddest). The red line in each panel is the operator model's term (A3, run3 final fits).
The terms of the A3 operator model
A3 is the colour model of the Paper 1 freeze (decided 2026-09-29): model #14 plus a shift quadratic in colour and colour elongation planes across the CCD, 17 coefficients fitted per CCD. Every term is proportional to the star's colour offset, so a star of the reference colour gets the plain ePSF.
δ = c − cref, c = a + b·u
c: the star's colour in BP−RP magnitudes, from u through a per-CCD linear fit (slope b ≈ 0.035 mag/nm), or Gaia BP−RP when there is no XP spectrum. cref: mean colour of the scene stars, fixed at the start of the fit. r: distance from the star to the optical axis in units of 1000 px. X, Y: the star's CCD position scaled to [−1, 1]. P: the ePSF at the star's position; ρ: radius from the star centre; n̂: unit vector from the star toward the optical axis.
| Term | What it does to the PSF | Generator | Amplitude for a star | Coefficients |
|---|---|---|---|---|
| Colour shift | Moves the whole PSF toward or away from the optical axis (lateral colour). Red stars sit further out. | translation along n̂ | Δx = [δ(s0 + s1r + s2r²) + (δ² − ⟨δ²⟩)(qs0 + qs1r)] n̂ | 5 |
| Kurtosis | Moves light between the centre and a ring at 1–2 px without changing the flux: red stars get a brighter centre and a darker ring. | P·(ρ² − ⟨ρ²⟩) | δ(k0 + k1r) | 2 |
| Blur | Gaussian-like broadening or sharpening of the core. | ∇²P | δ·b | 1 |
| Dilation | Magnifies or shrinks the whole PSF, wings included. | 2P + x·∇P | δ(d0 + d1r) | 2 |
| Trefoil | A three-fold (120°) distortion aligned with the radial direction. | radial trefoil | δ·t | 1 |
| Elongation planes | Stretches the PSF along x vs y and along the 45° diagonals, by an amount that varies linearly across the CCD. | traceless stretch, x/y and 45° | δ(q1,0 + q1,xX + q1,yY), δ(q2,0 + q2,xX + q2,yY) | 6 |
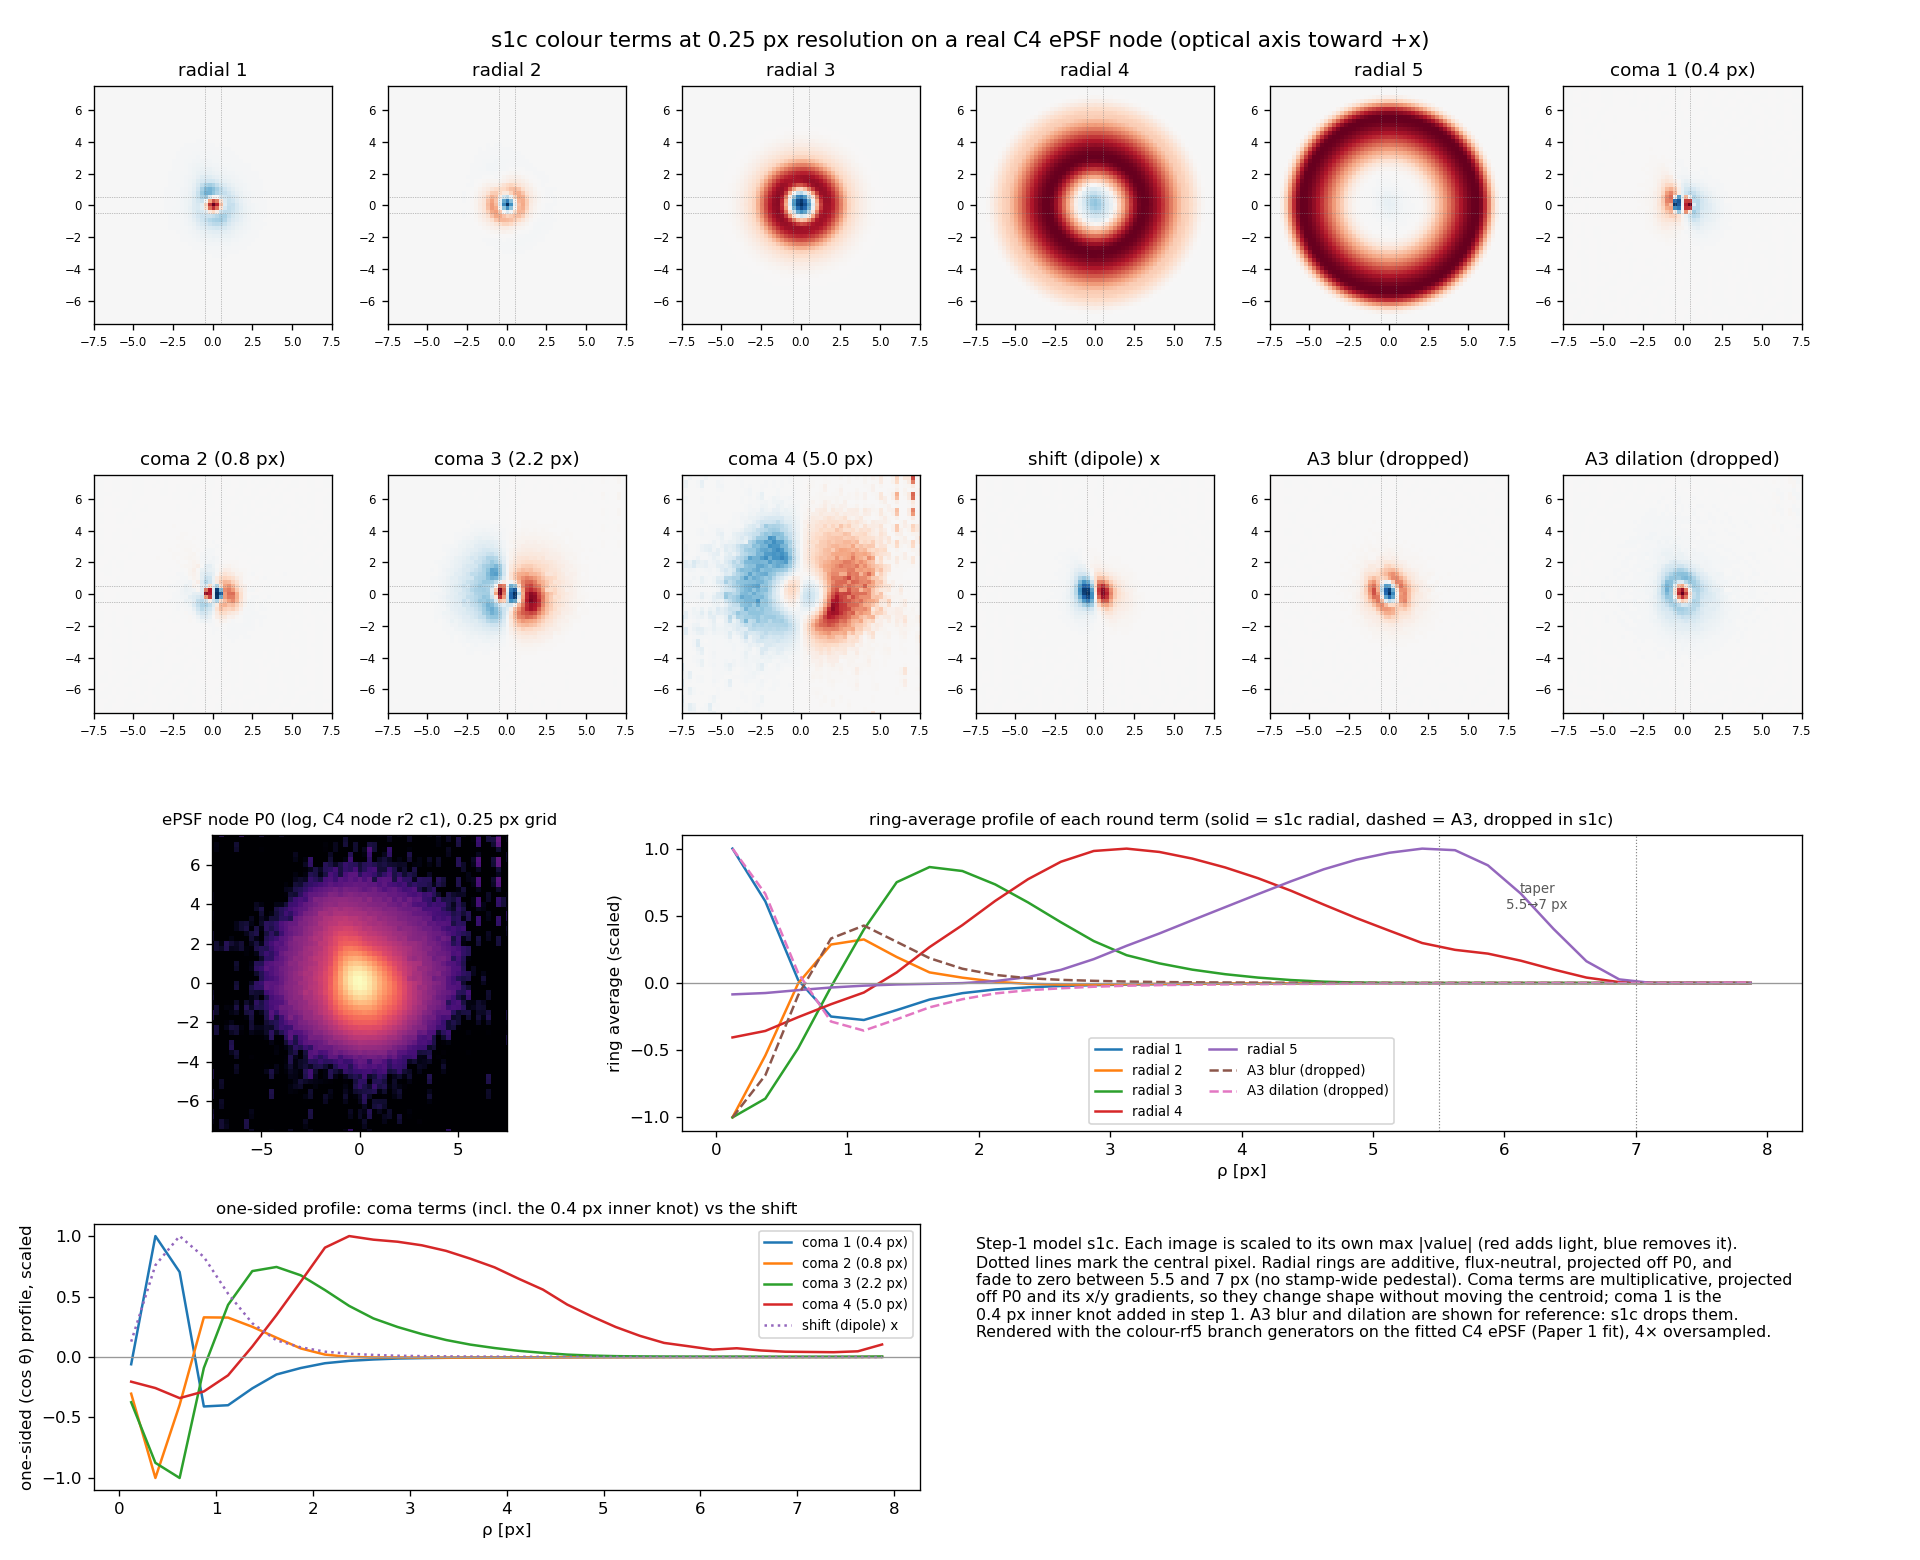
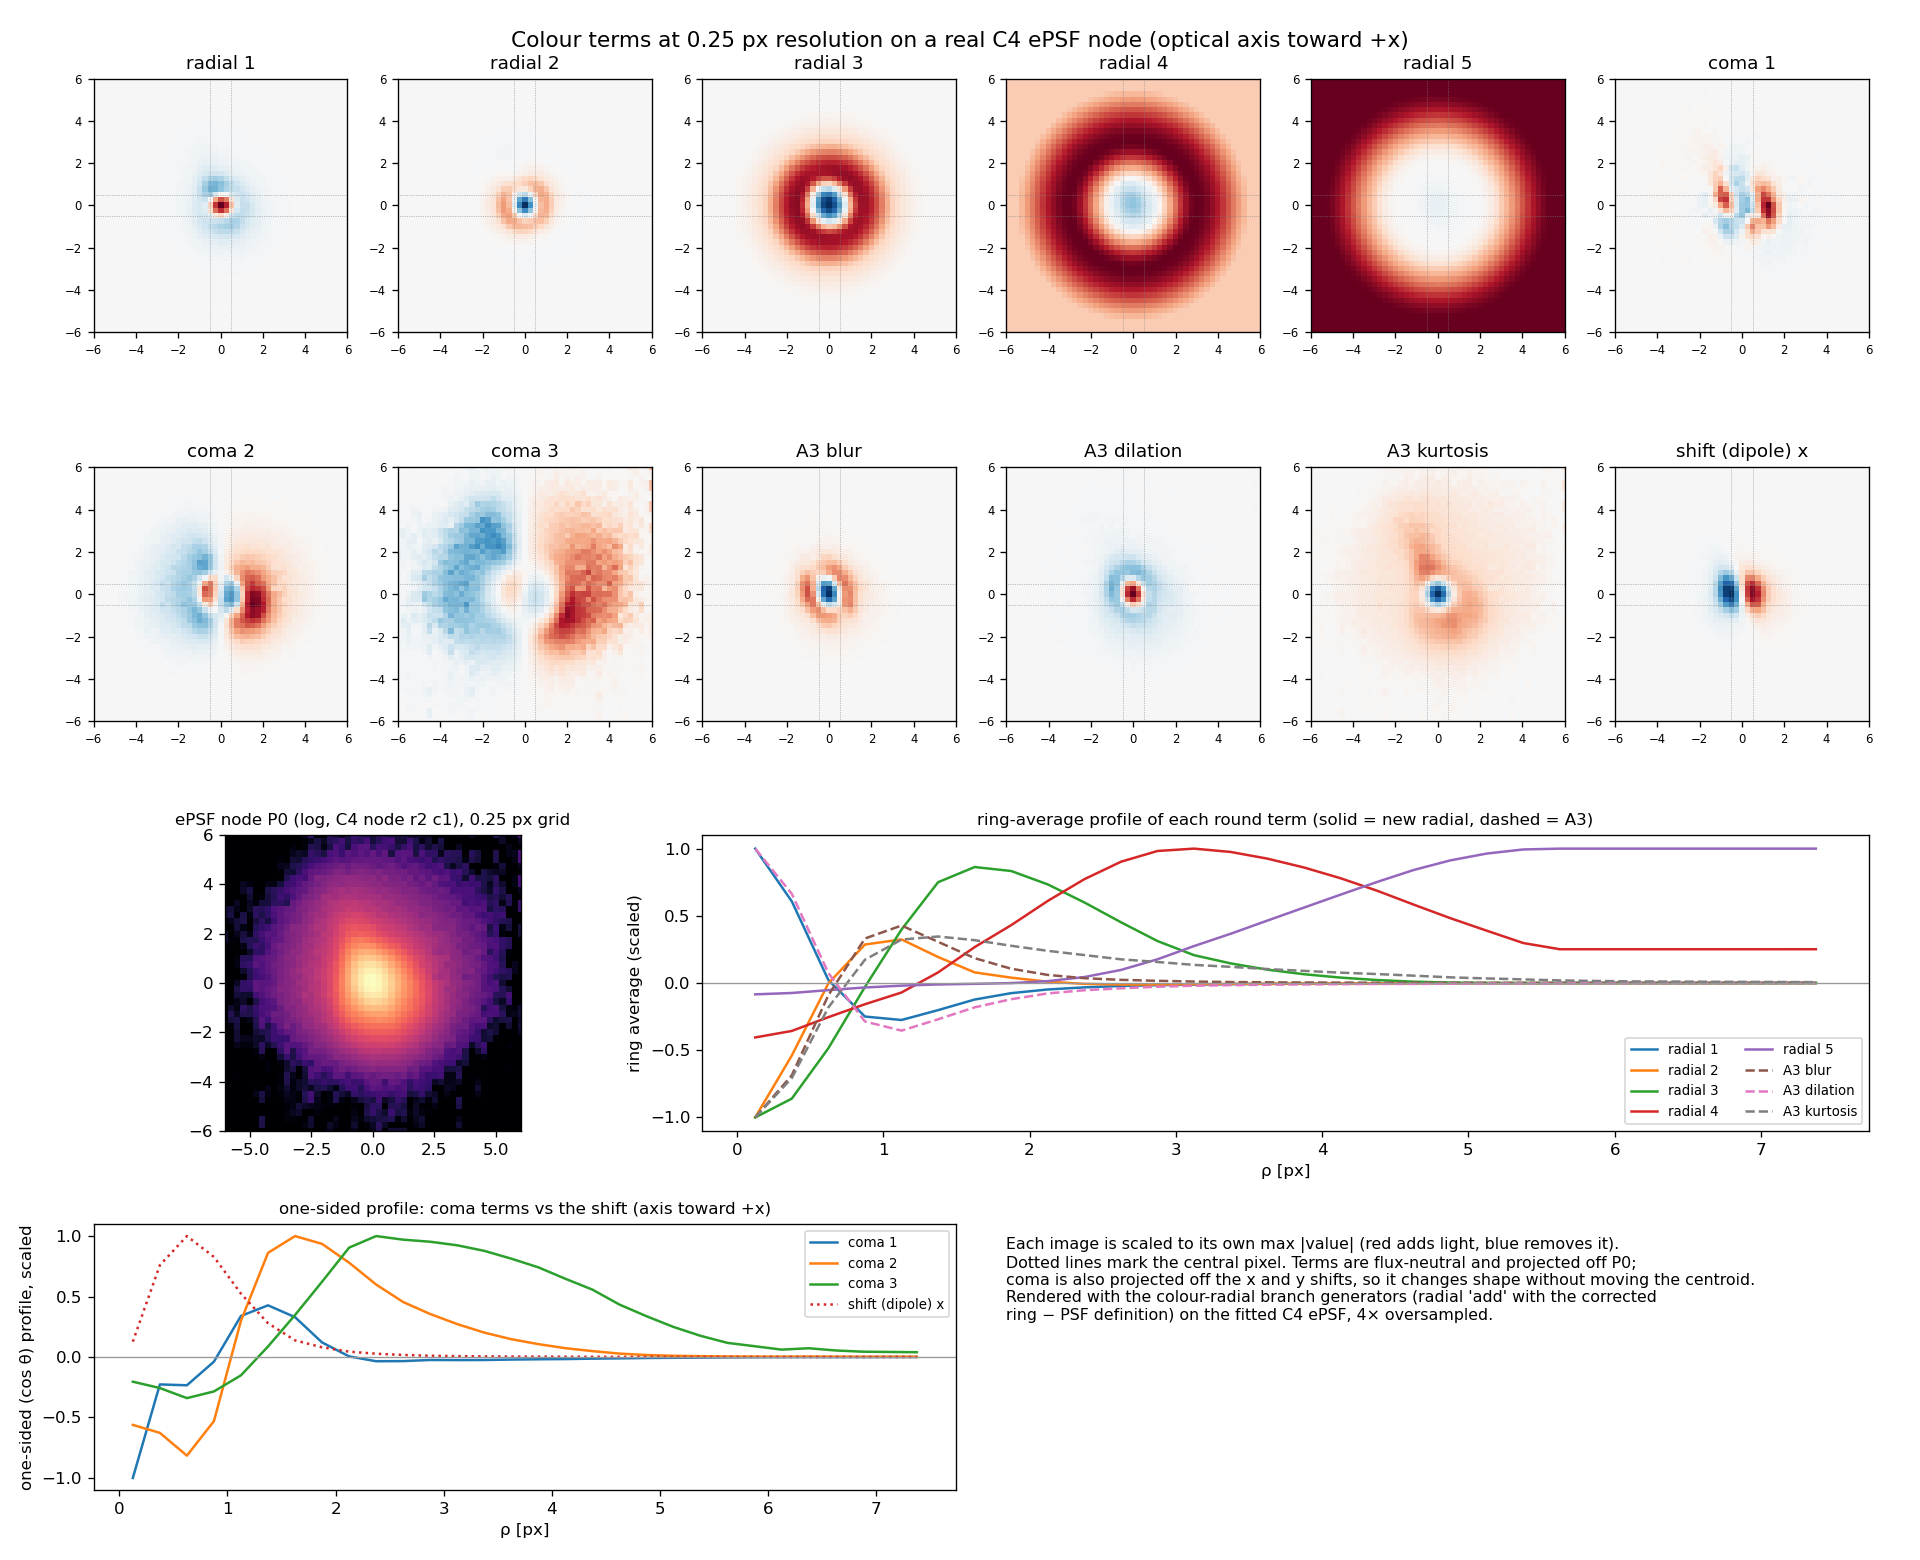
Each generator is made orthogonal to the ePSF itself (the "raw-P" gauge), so no term changes the total flux or the centroid except the shift. Kurtosis, blur and dilation are the round terms: they change the radial profile, and they overlap with each other and with the inner rings of the radial + coma model (see the ring-average plot below). The final model drops them and keeps the shift, trefoil and elongation planes. The images of blur, dilation and kurtosis on a real ePSF are in the second figure of the next section.
Records: dev/forward_epsf_wcs/docs/COLOUR_MODEL_DECISION_20260924.md (#14) and COLOUR_MODEL_V2_DECISION_20260929.md (A3).
The terms: operator model and radial + coma model
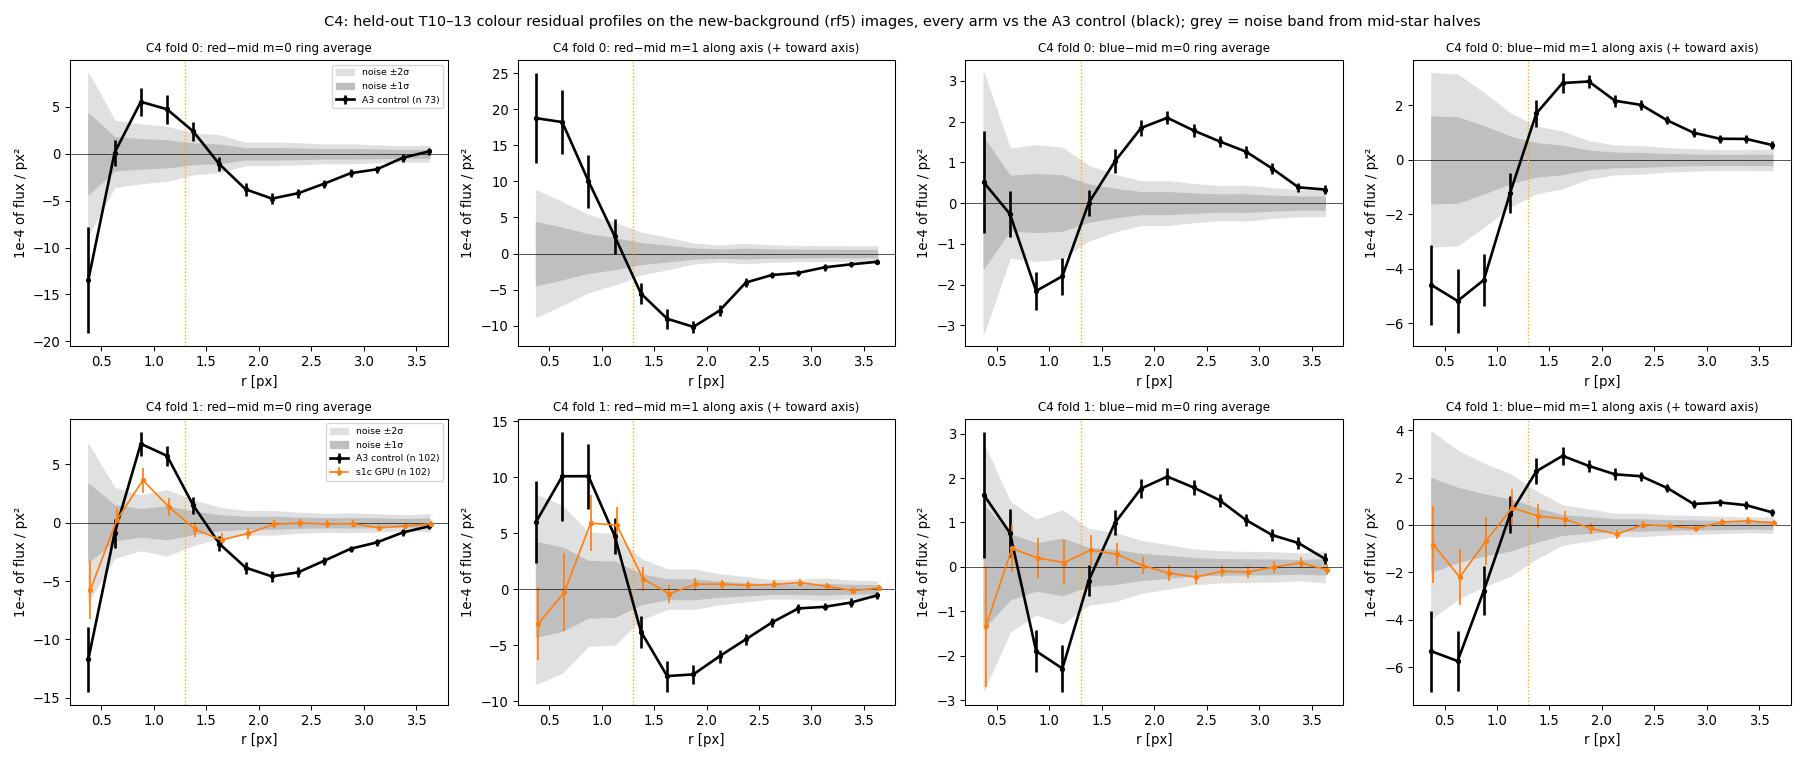
Two ways to describe the colour response. The operator model (A3) uses physical operators on the ePSF: a colour shift toward or away from the axis, blur, dilation, kurtosis, trefoil and elongation planes. The radial + coma model replaces the round operators with five flux-neutral rings in radius and coma terms that change the one-sided shape without moving the centroid. The final model is the radial + coma law with an extra coma knot at 0.4 px, the rings tapering to zero between 5.5 and 7 px. It keeps A3's colour shift, trefoil and elongation planes and drops A3's round terms.
How the two models compare
Records
| Model comparison fits and grids | /astro/armin/koji/syndiff/dev_runs/colour_shoulder_20261008/README.md (grids: canvas_figs/code/resgrid_fixed.py) |
|---|---|
| Final model grids | /astro/armin/koji/syndiff/dev_runs/group_meeting_slides_20261013/colour_viewer/run5_fixed.py on e2e_final_recipe_20261007/run5/<F>/folds_final, folds 0+1 |
| Data and term figures | colour-model framing canvas, /home/kshukawa/syndiff_pipeline/doc/epsf_framing_canvas/figs/; term images colour_shoulder_20261008/canvas_figs/ |
| Earlier side-by-side explorer | https://claude.ai/artifact/Geoq6EAspMjfJS7LocNSaR (with metric charts) |